Income & Expenditure Statistical Analysis Completed

Azra Tayyab

Income & Expenditure Statistical Analysis
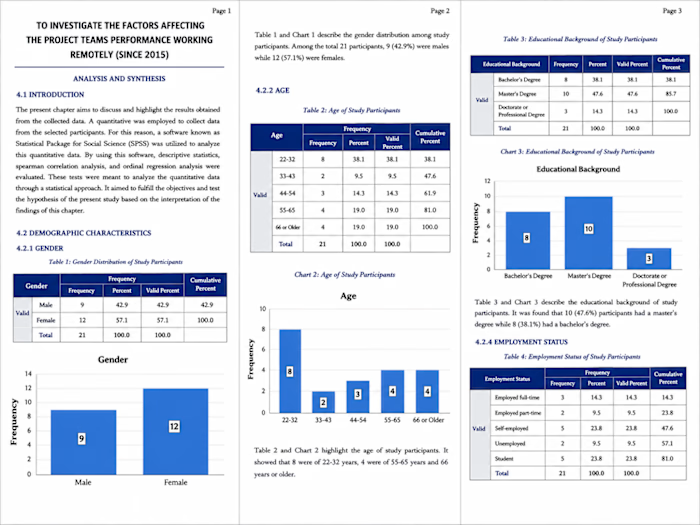
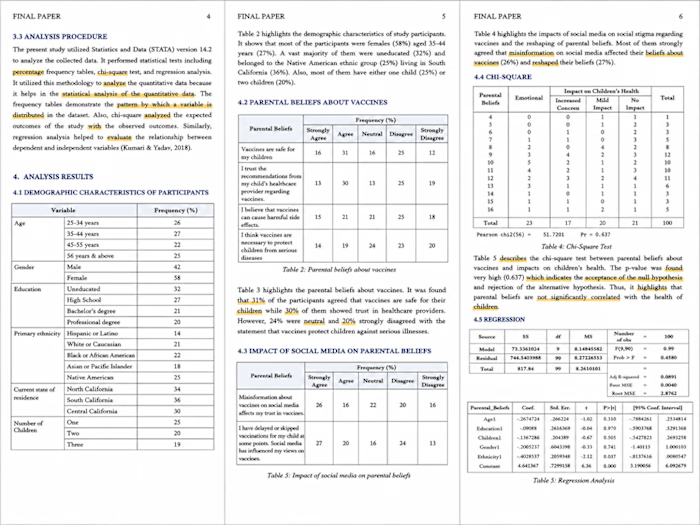
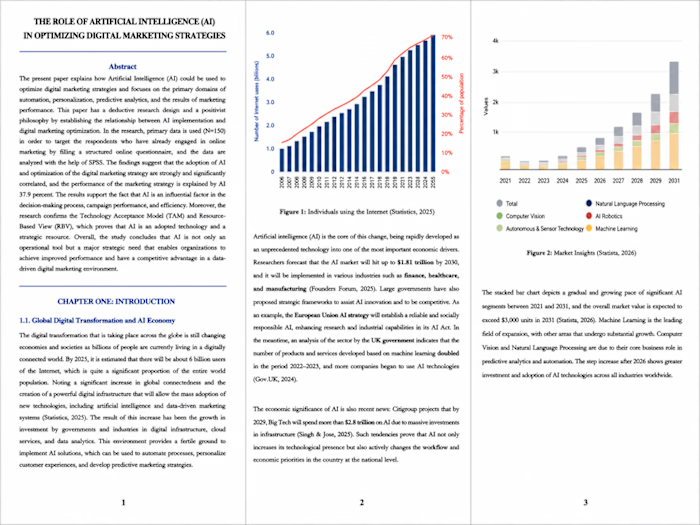
Completed a quantitative data analysis project focused on examining income and expenditure patterns within a client dataset. I carried out a structured statistical analysis to identify distribution patterns, variation, and the relationship between the two variables.
The work included calculating and interpreting descriptive statistics such as mean, median, mode, standard deviation, variance, range, quartiles, skewness, and coefficient of variation. I also analyzed income and expenditure distributions using histograms and presented the results through professionally formatted statistical tables.
To examine the relationship between income and expenditure, I conducted correlation analysis and developed a scatter plot to visually communicate the findings. The analysis identified a strong positive correlation (r = 0.800), which was clearly interpreted and incorporated into the research report.
I transformed the statistical output into clear, client-ready findings with organized tables, charts, visualizations, and concise written interpretation suitable for academic and research reporting.
Like this project
Posted Aug 25, 2026
Income & Expenditure Statistical Analysis Completed a quantitative data analysis project focused on examining income and expenditure patterns within a client...
Likes
0
Views
2
Timeline
Apr 23, 2026 - Apr 25, 2026
Clients
Tutory