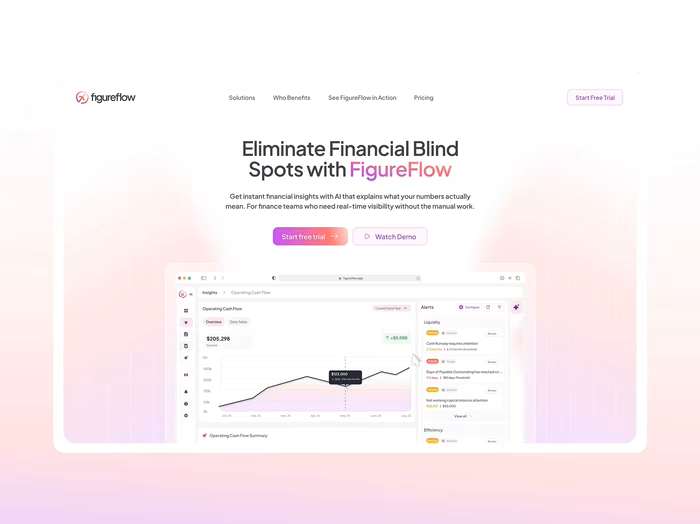
FigureFlow Product Design: AI Financial Intelligence Platform

Daniel Adeeri
Verified


Overview
FigureFlow is an AI SaaS financial platform that brings conversational AI, forecasting, insights, reporting, and localised compliance tools into one place. Businesses can connect ERPs, banking systems, and relevant files to work with current financial data, or connect FigureFlow’s engine and infrastructure into their own systems.
This case study focuses on the product design created for FigureFlow. Links to other related work can be found at the footer of this page.
The work shared in this portfolio is the version as of January, 2026. Any changes or updates to development and branding are post-hand-off implementations.
The challenge
Financial data is often scattered across tools, leaving leaders without a clear and current picture of business performance. Pulling it together can be time-consuming and error-prone, while many financial tools are visually dense and built primarily for experts.
The product approach
FigureFlow brings key numbers, always-current insights, forecasts, automatically generated reports, and plain-English answers into a single decision surface. The experience is built to show what happened, why it happened, and what might happen next.
Product design
The app covers onboarding, dashboard, insights, forecasting, reports, AI Query, data sources, notifications, help and support, and settings.
Onboarding
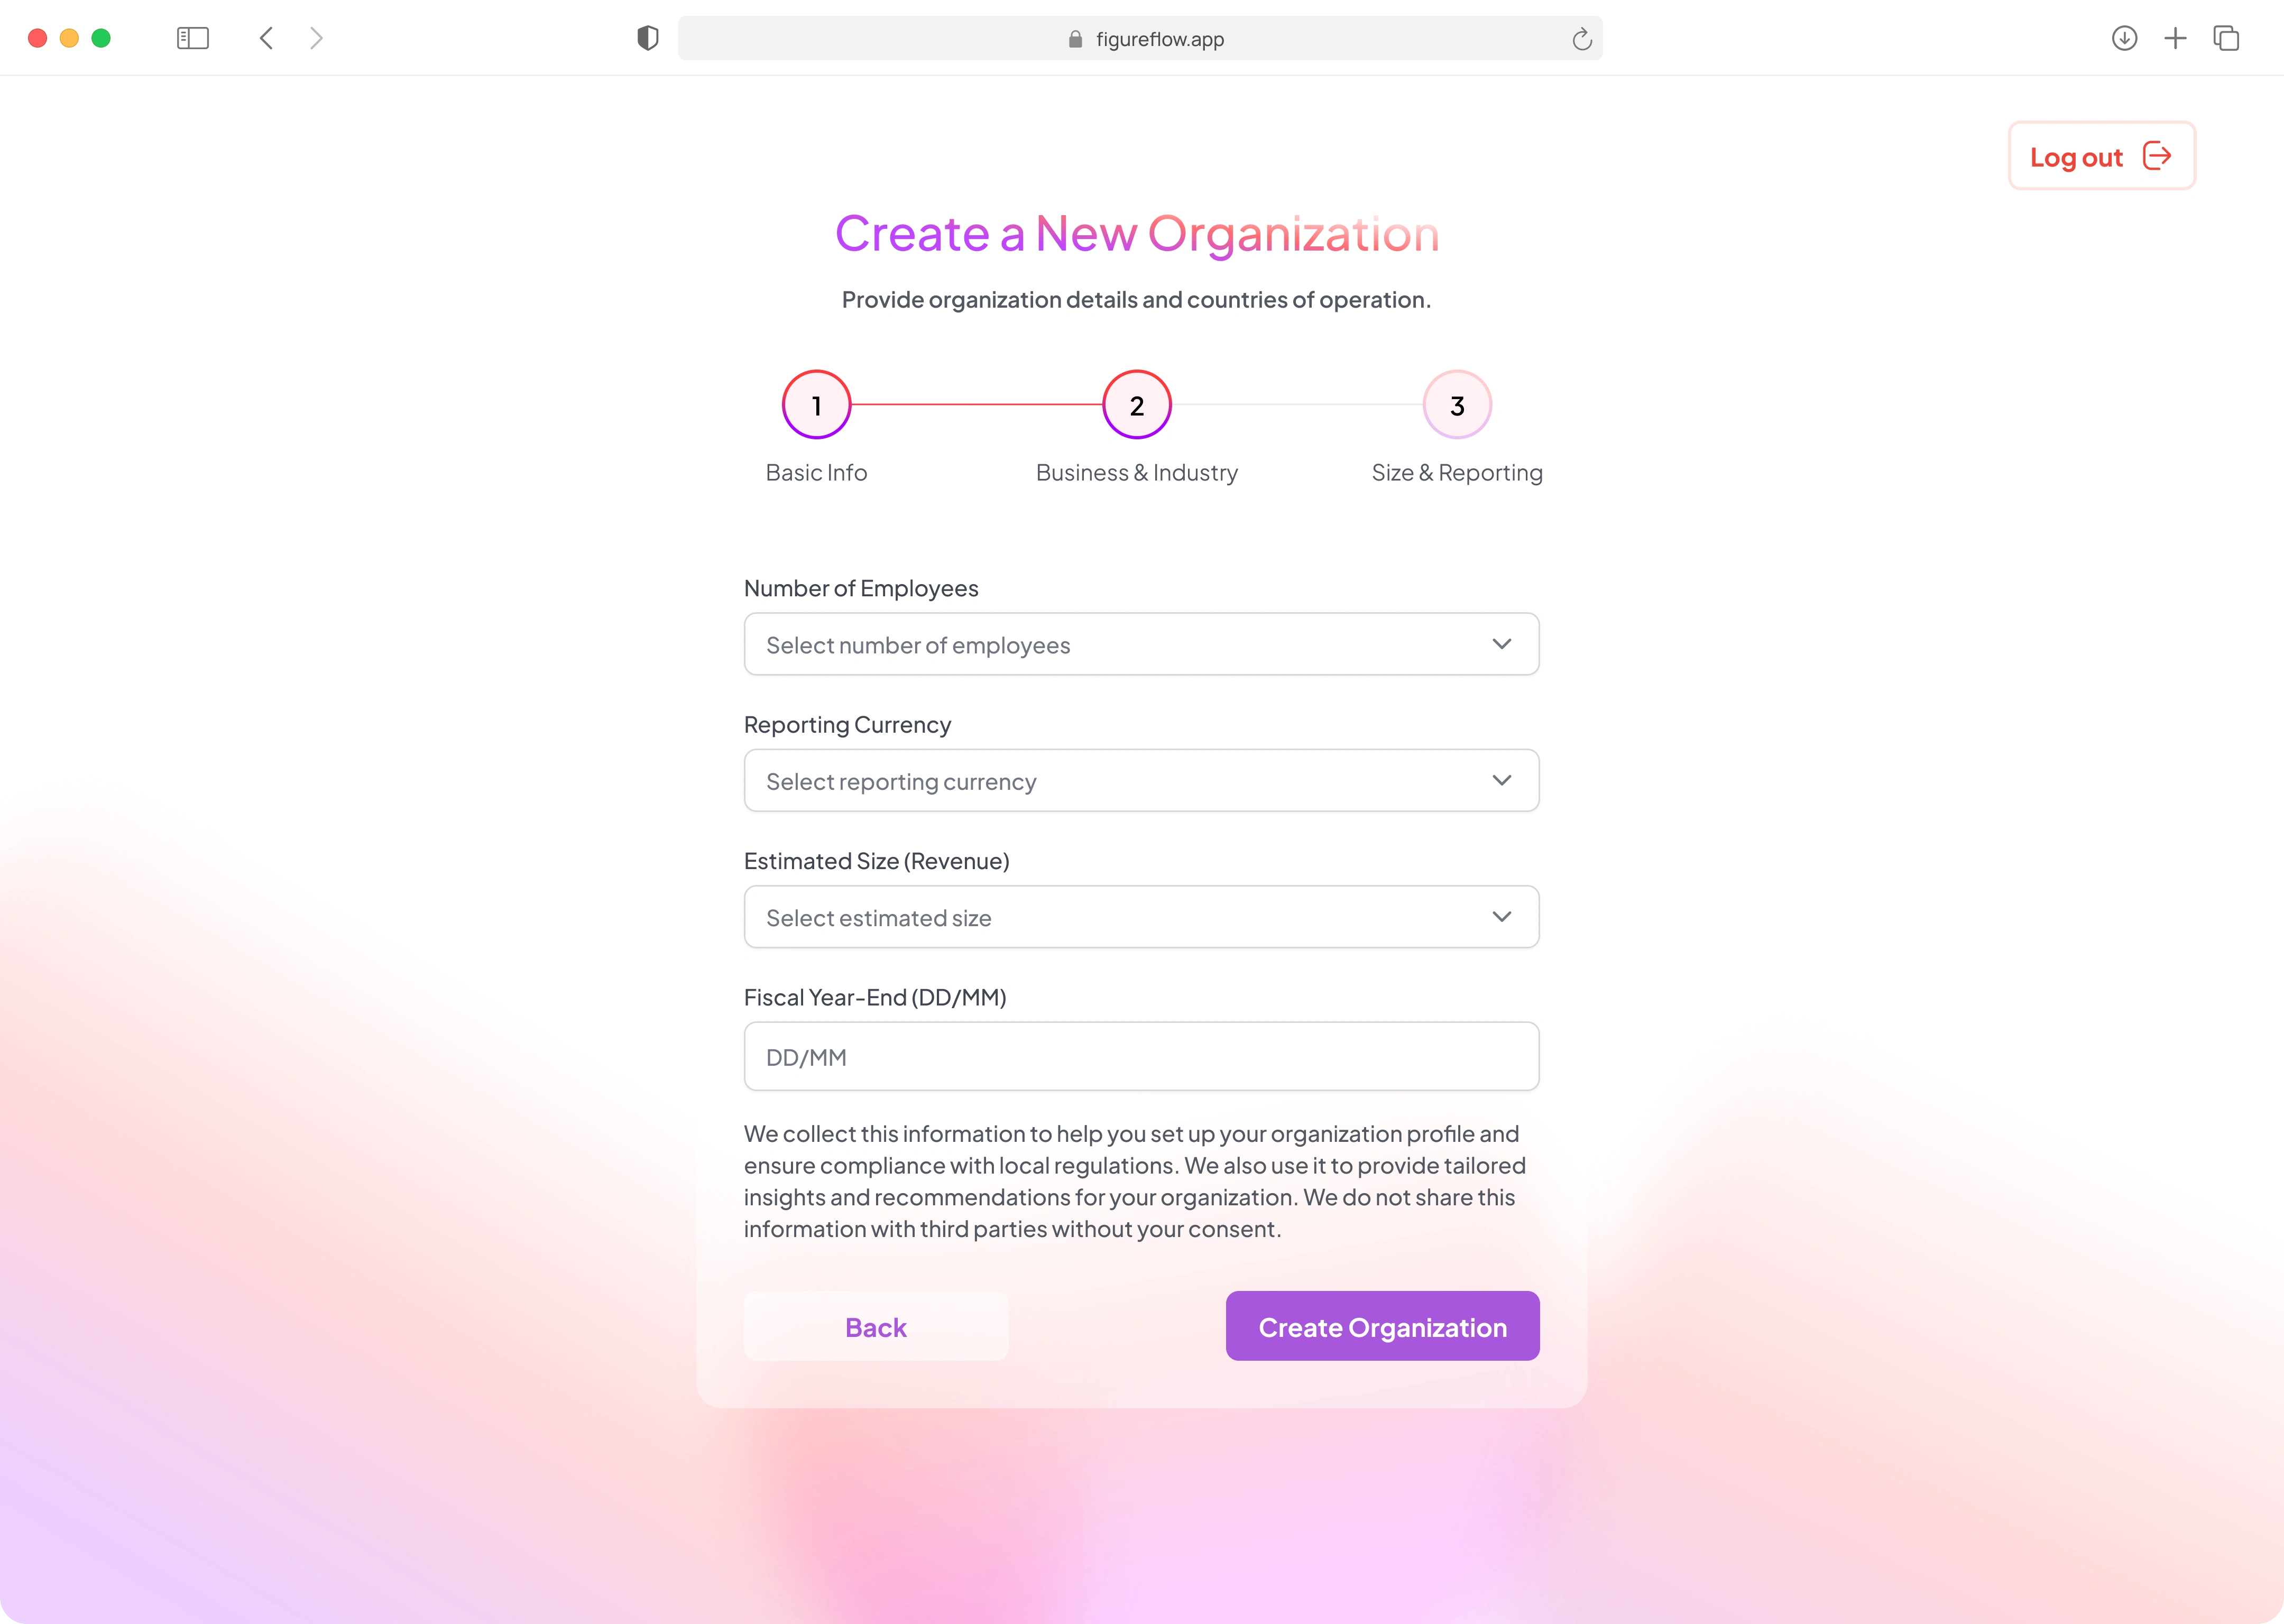
The onboarding experience was designed to feel guided and easy for first-time users. It includes sign-in and sign-up, business profile setup, and billing.
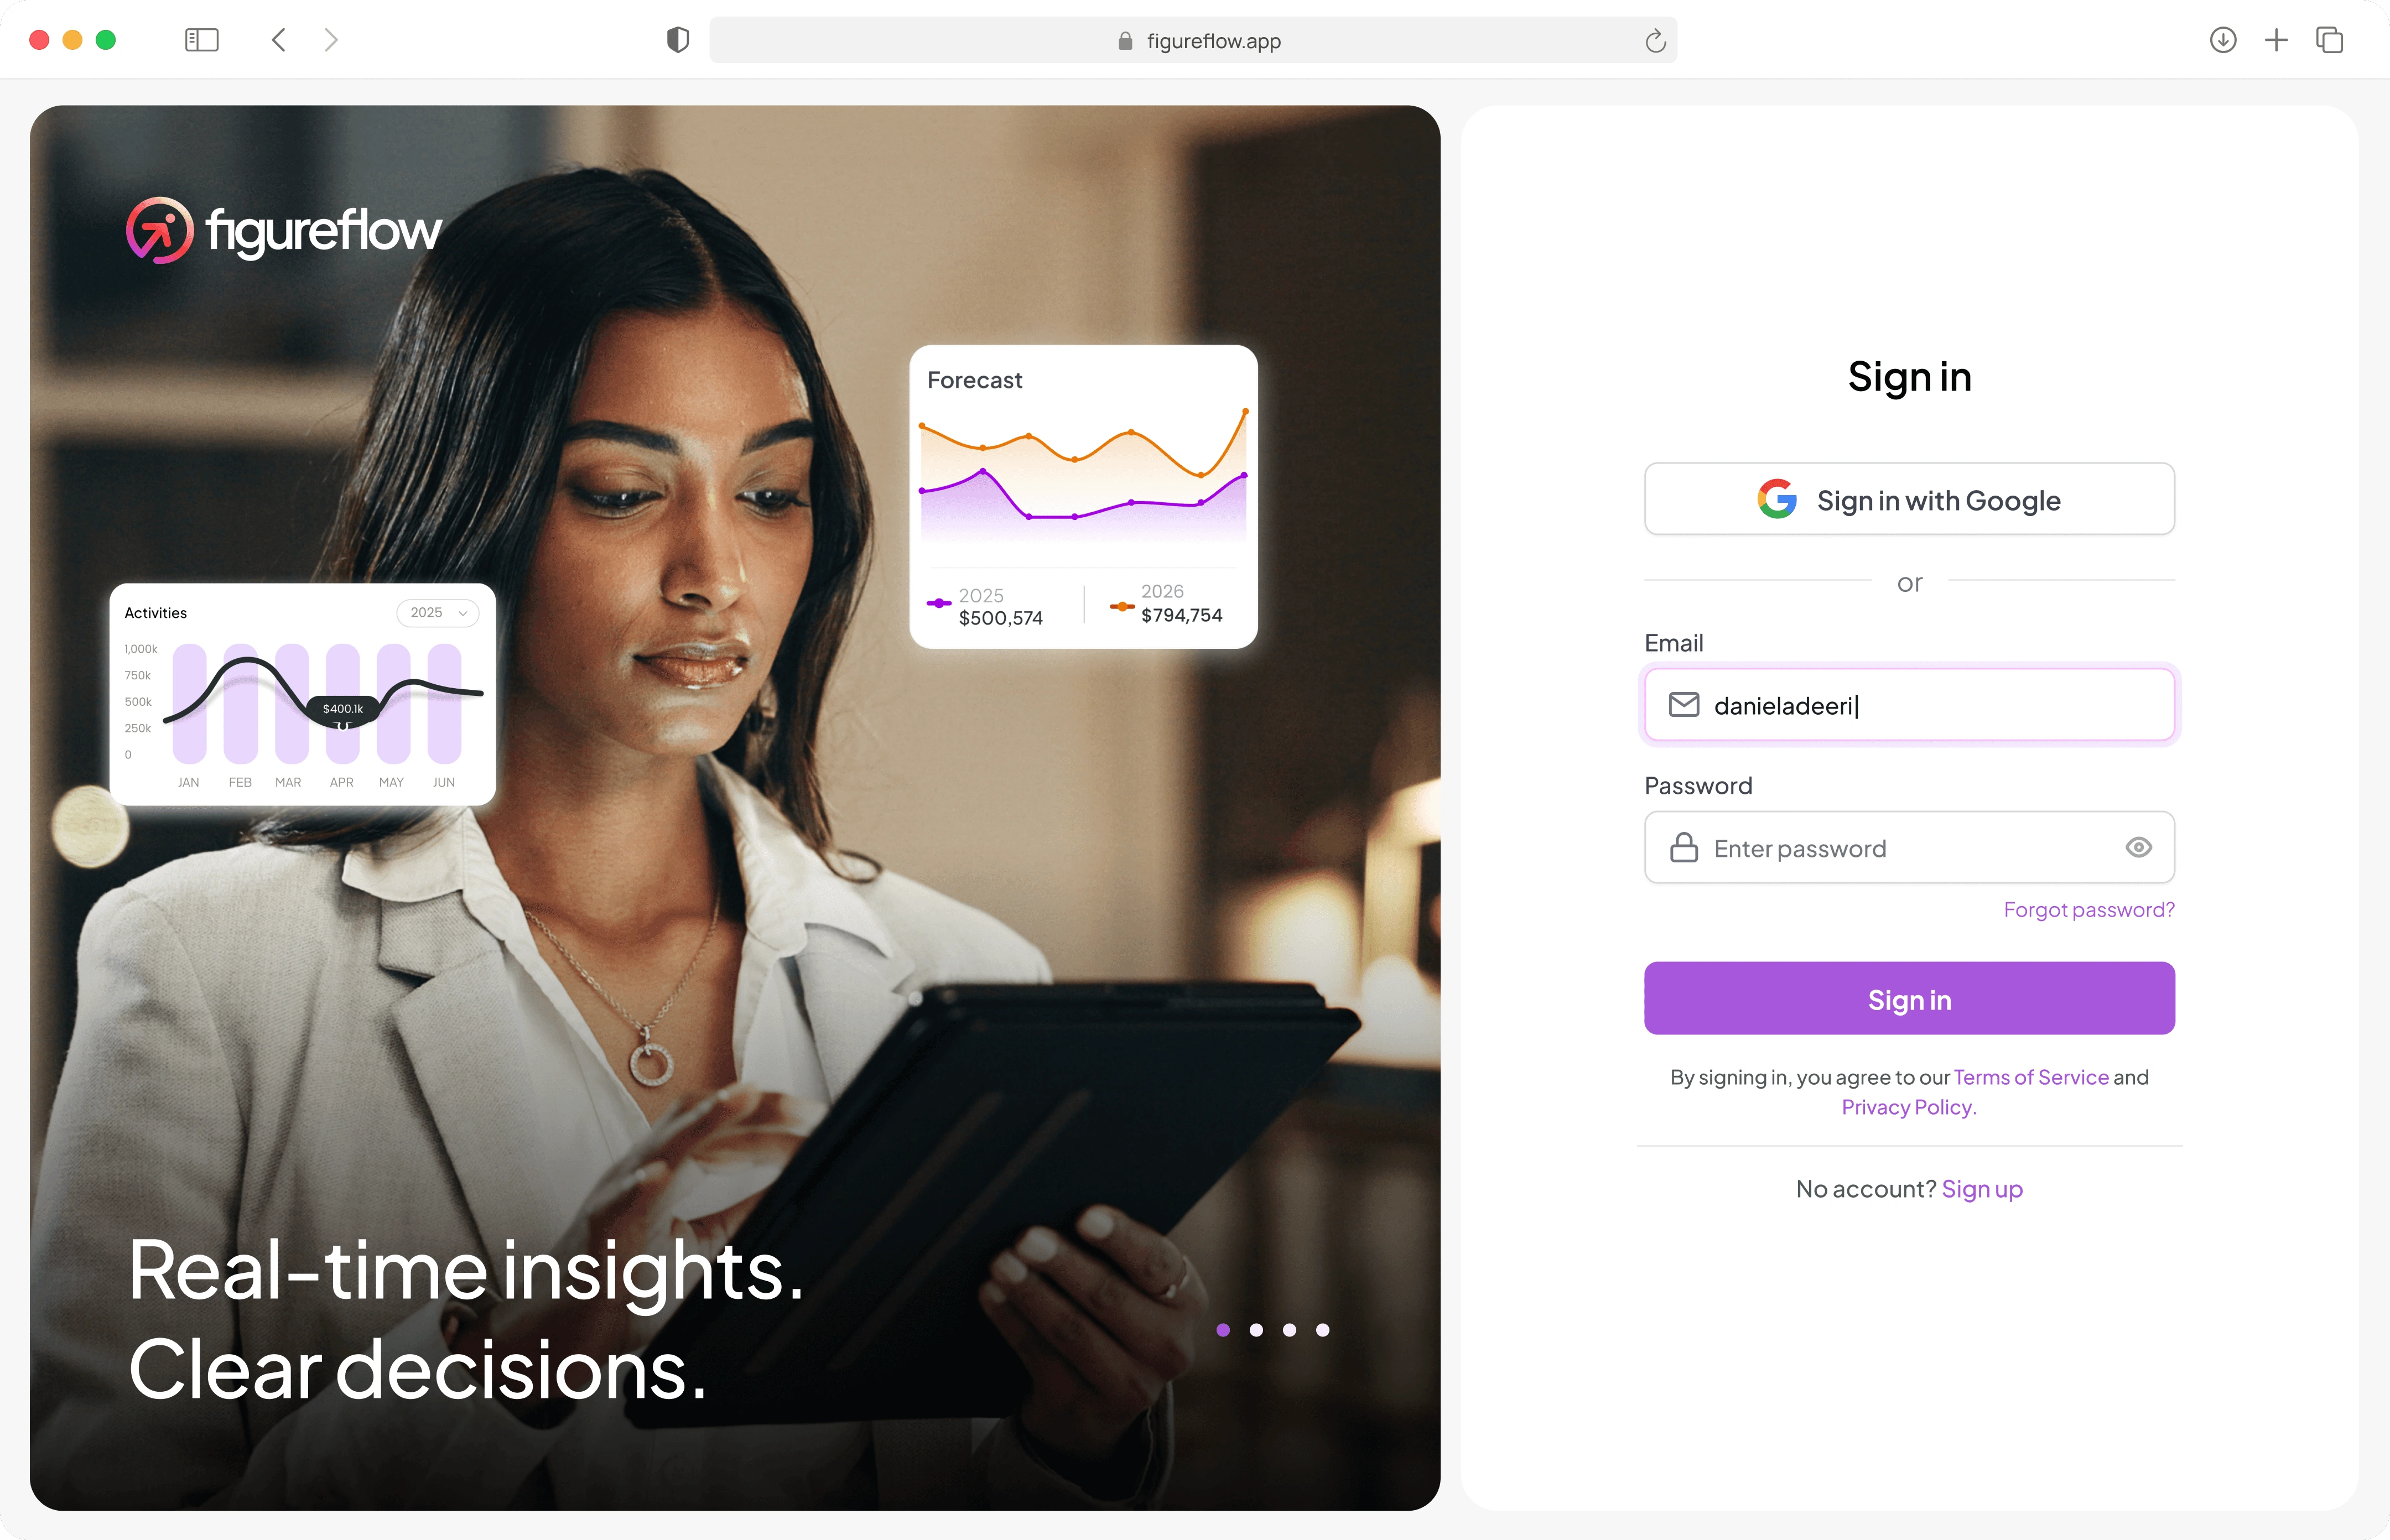
FigureFlow onboarding screens
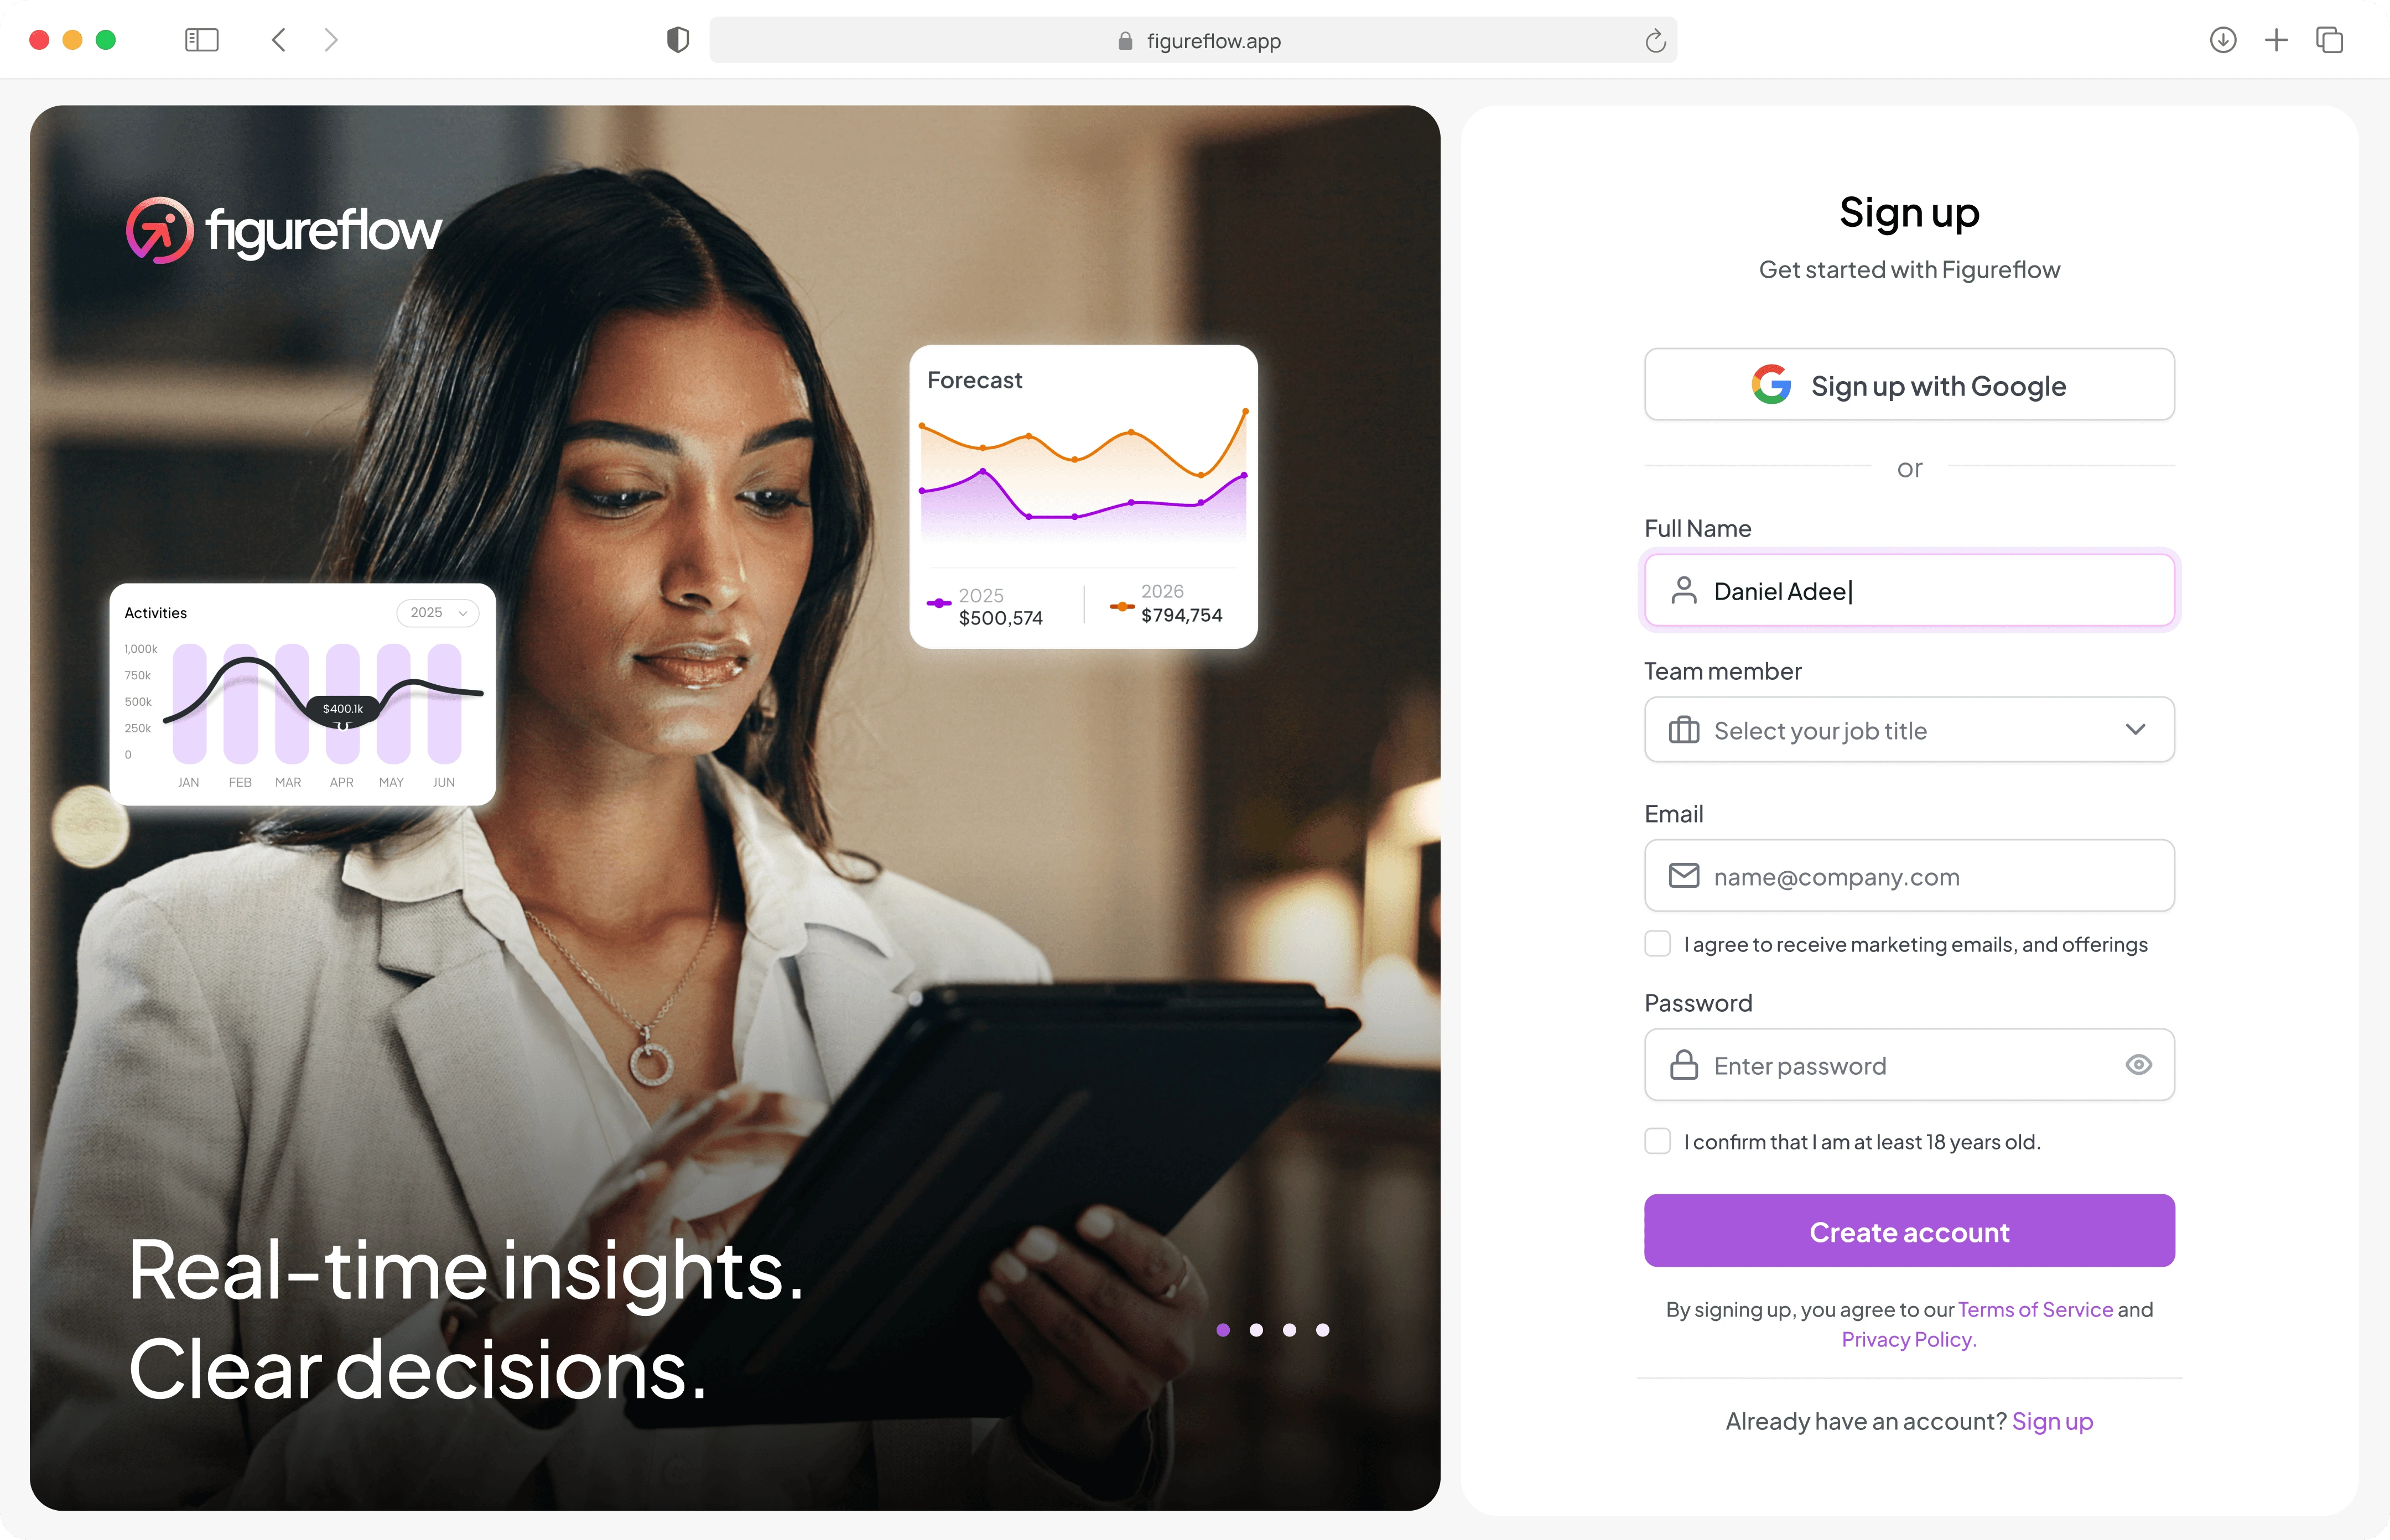
FigureFlow onboarding screens
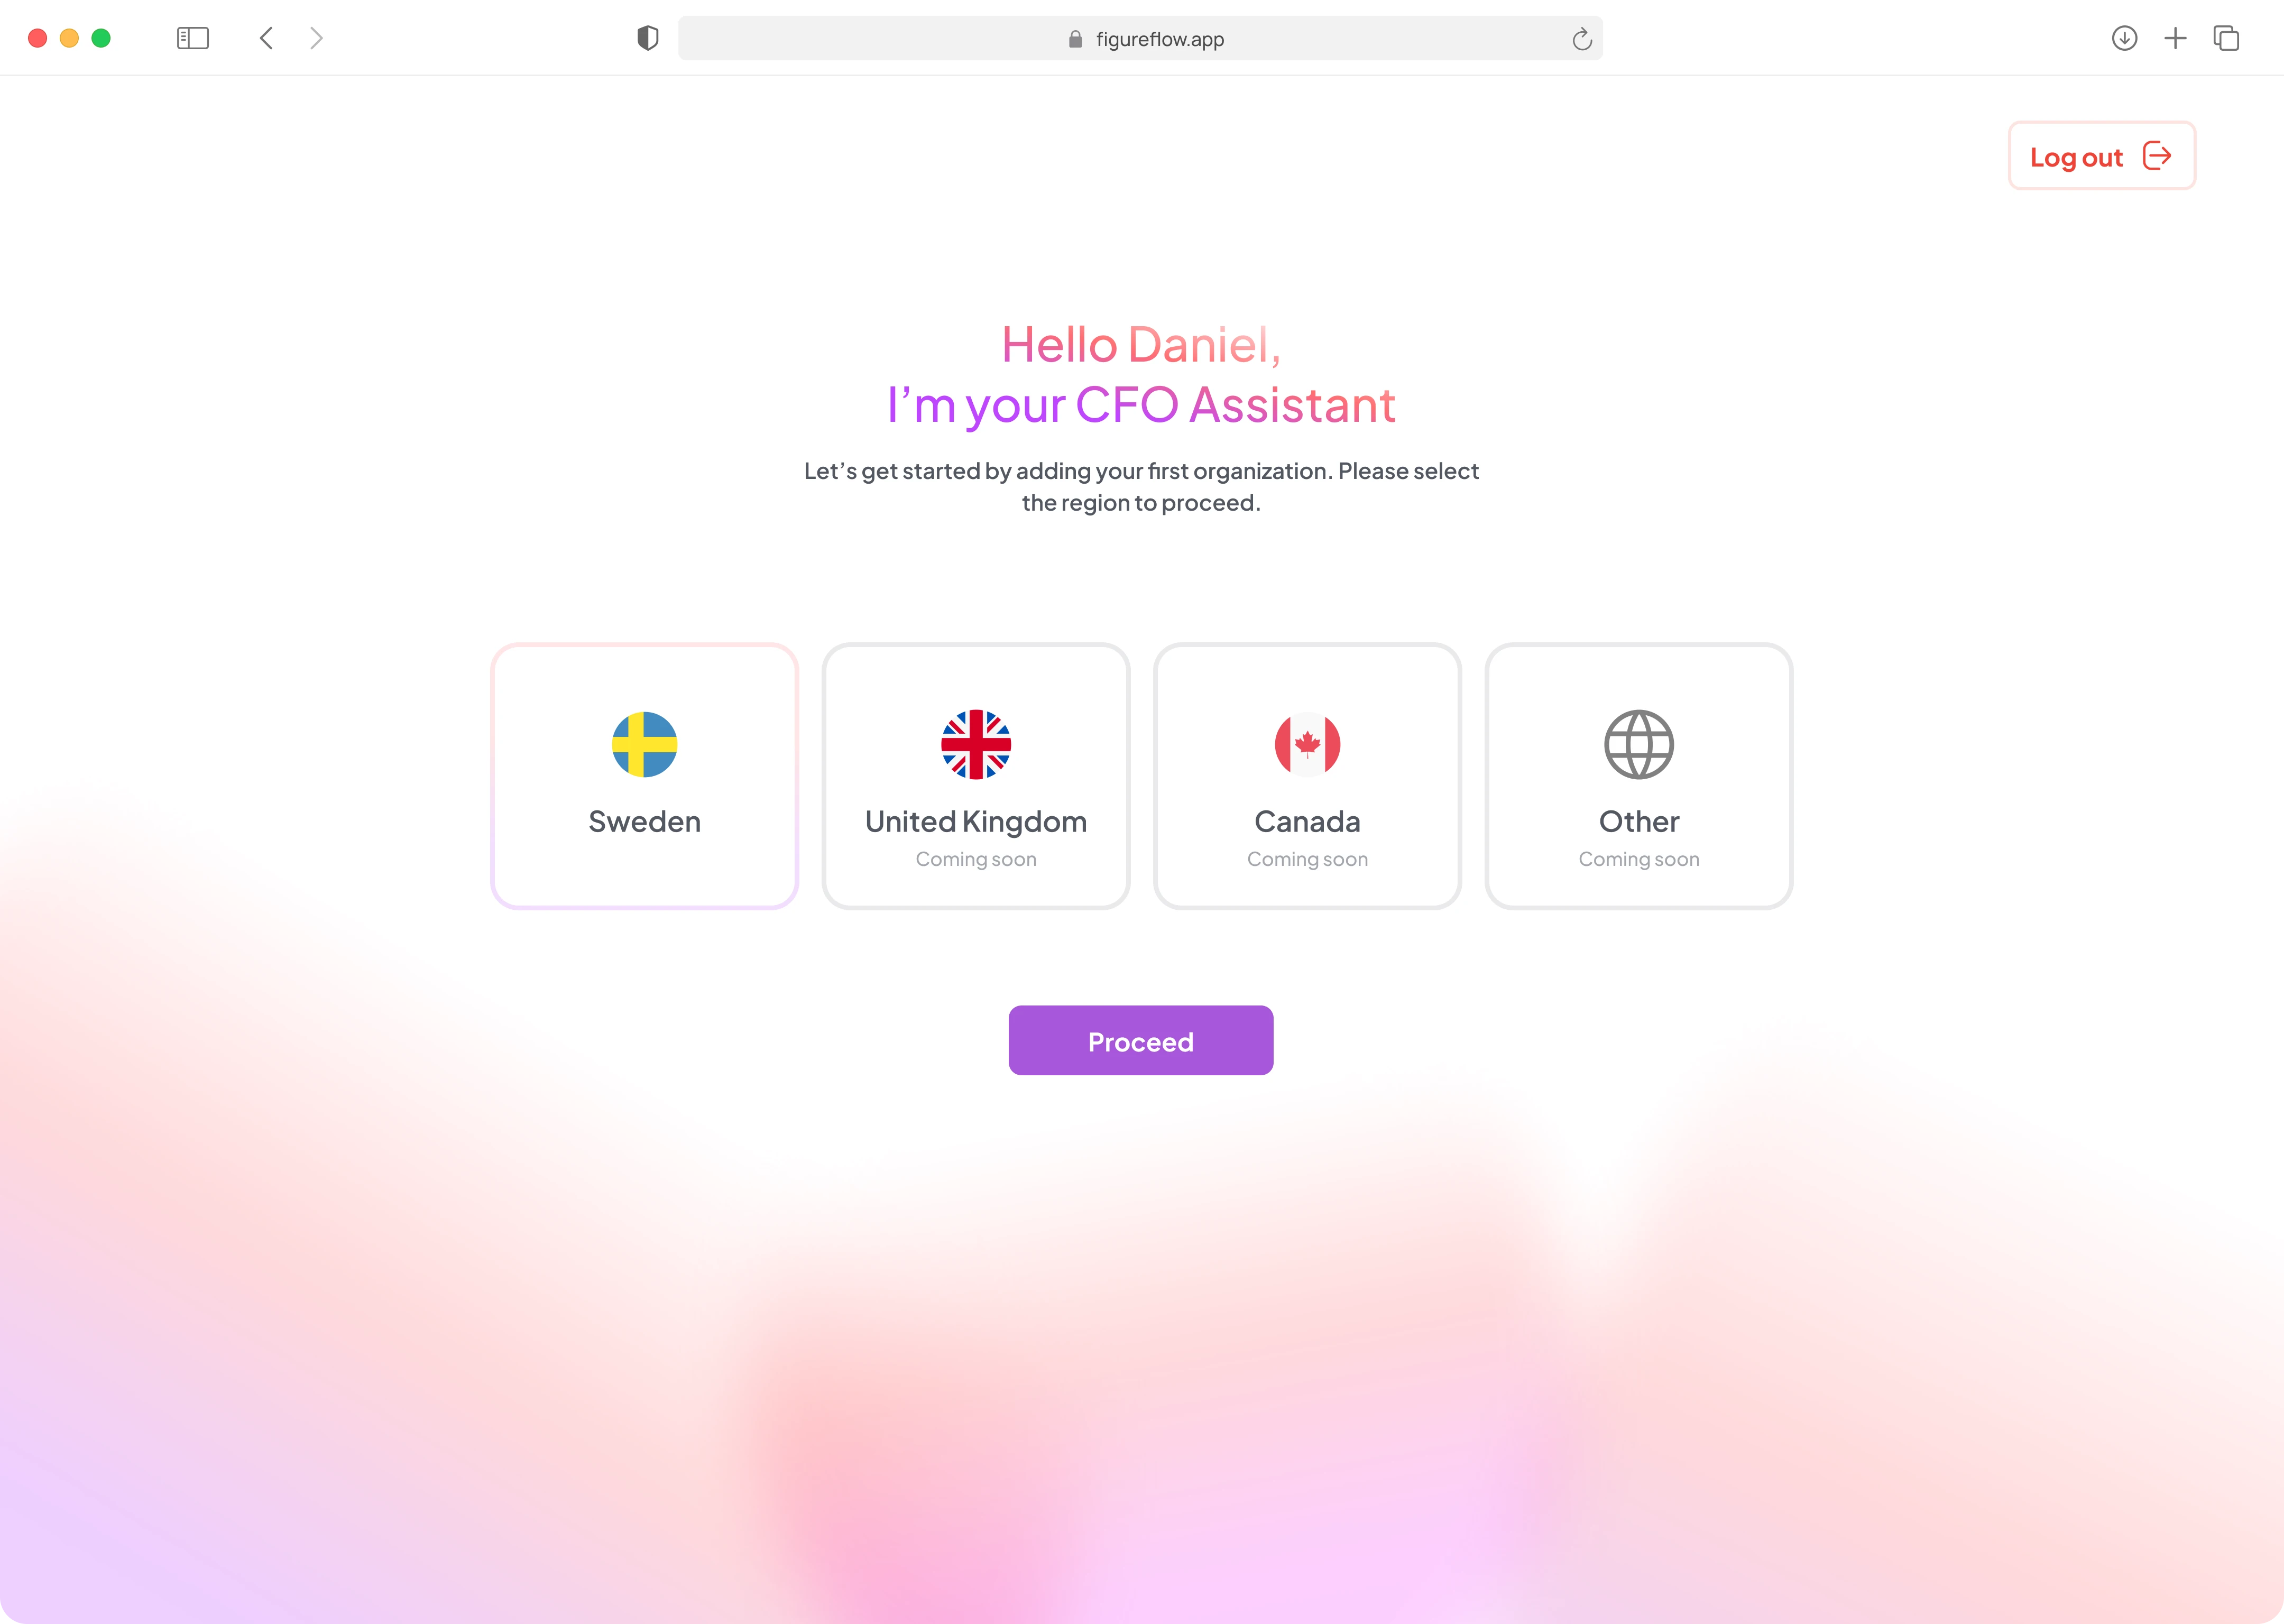
FigureFlow onboarding screens
FigureFlow onboarding screens

FigureFlow onboarding screens

FigureFlow onboarding screens
Dashboard
The dashboard answers one core question immediately: How healthy is my business right now? Instead of presenting raw accounting data alone, it surfaces financial health, key metrics, forecasts, and risks in a structured, explainable way.
The General view translates revenue performance, expense behaviour, liquidity, and overall stability into a readable executive summary. Users can also switch to Profit & Loss, Balance Sheet, or Cash Flow views.
A focused KPI strip highlights cash runway, burn rate, gross margin, and net cash flow. Each KPI can lead into a detailed view in the Insights module.
The forecast snapshot combines a visual projection graph with an AI-generated summary, helping users see expected revenue trends, cost behaviour, and net-income outlook alongside the reasoning behind those projections.
The AI Assistant and AI Query make finance conversational. Users can ask about revenue trends, margin comparisons, working capital, and other questions based on their data.
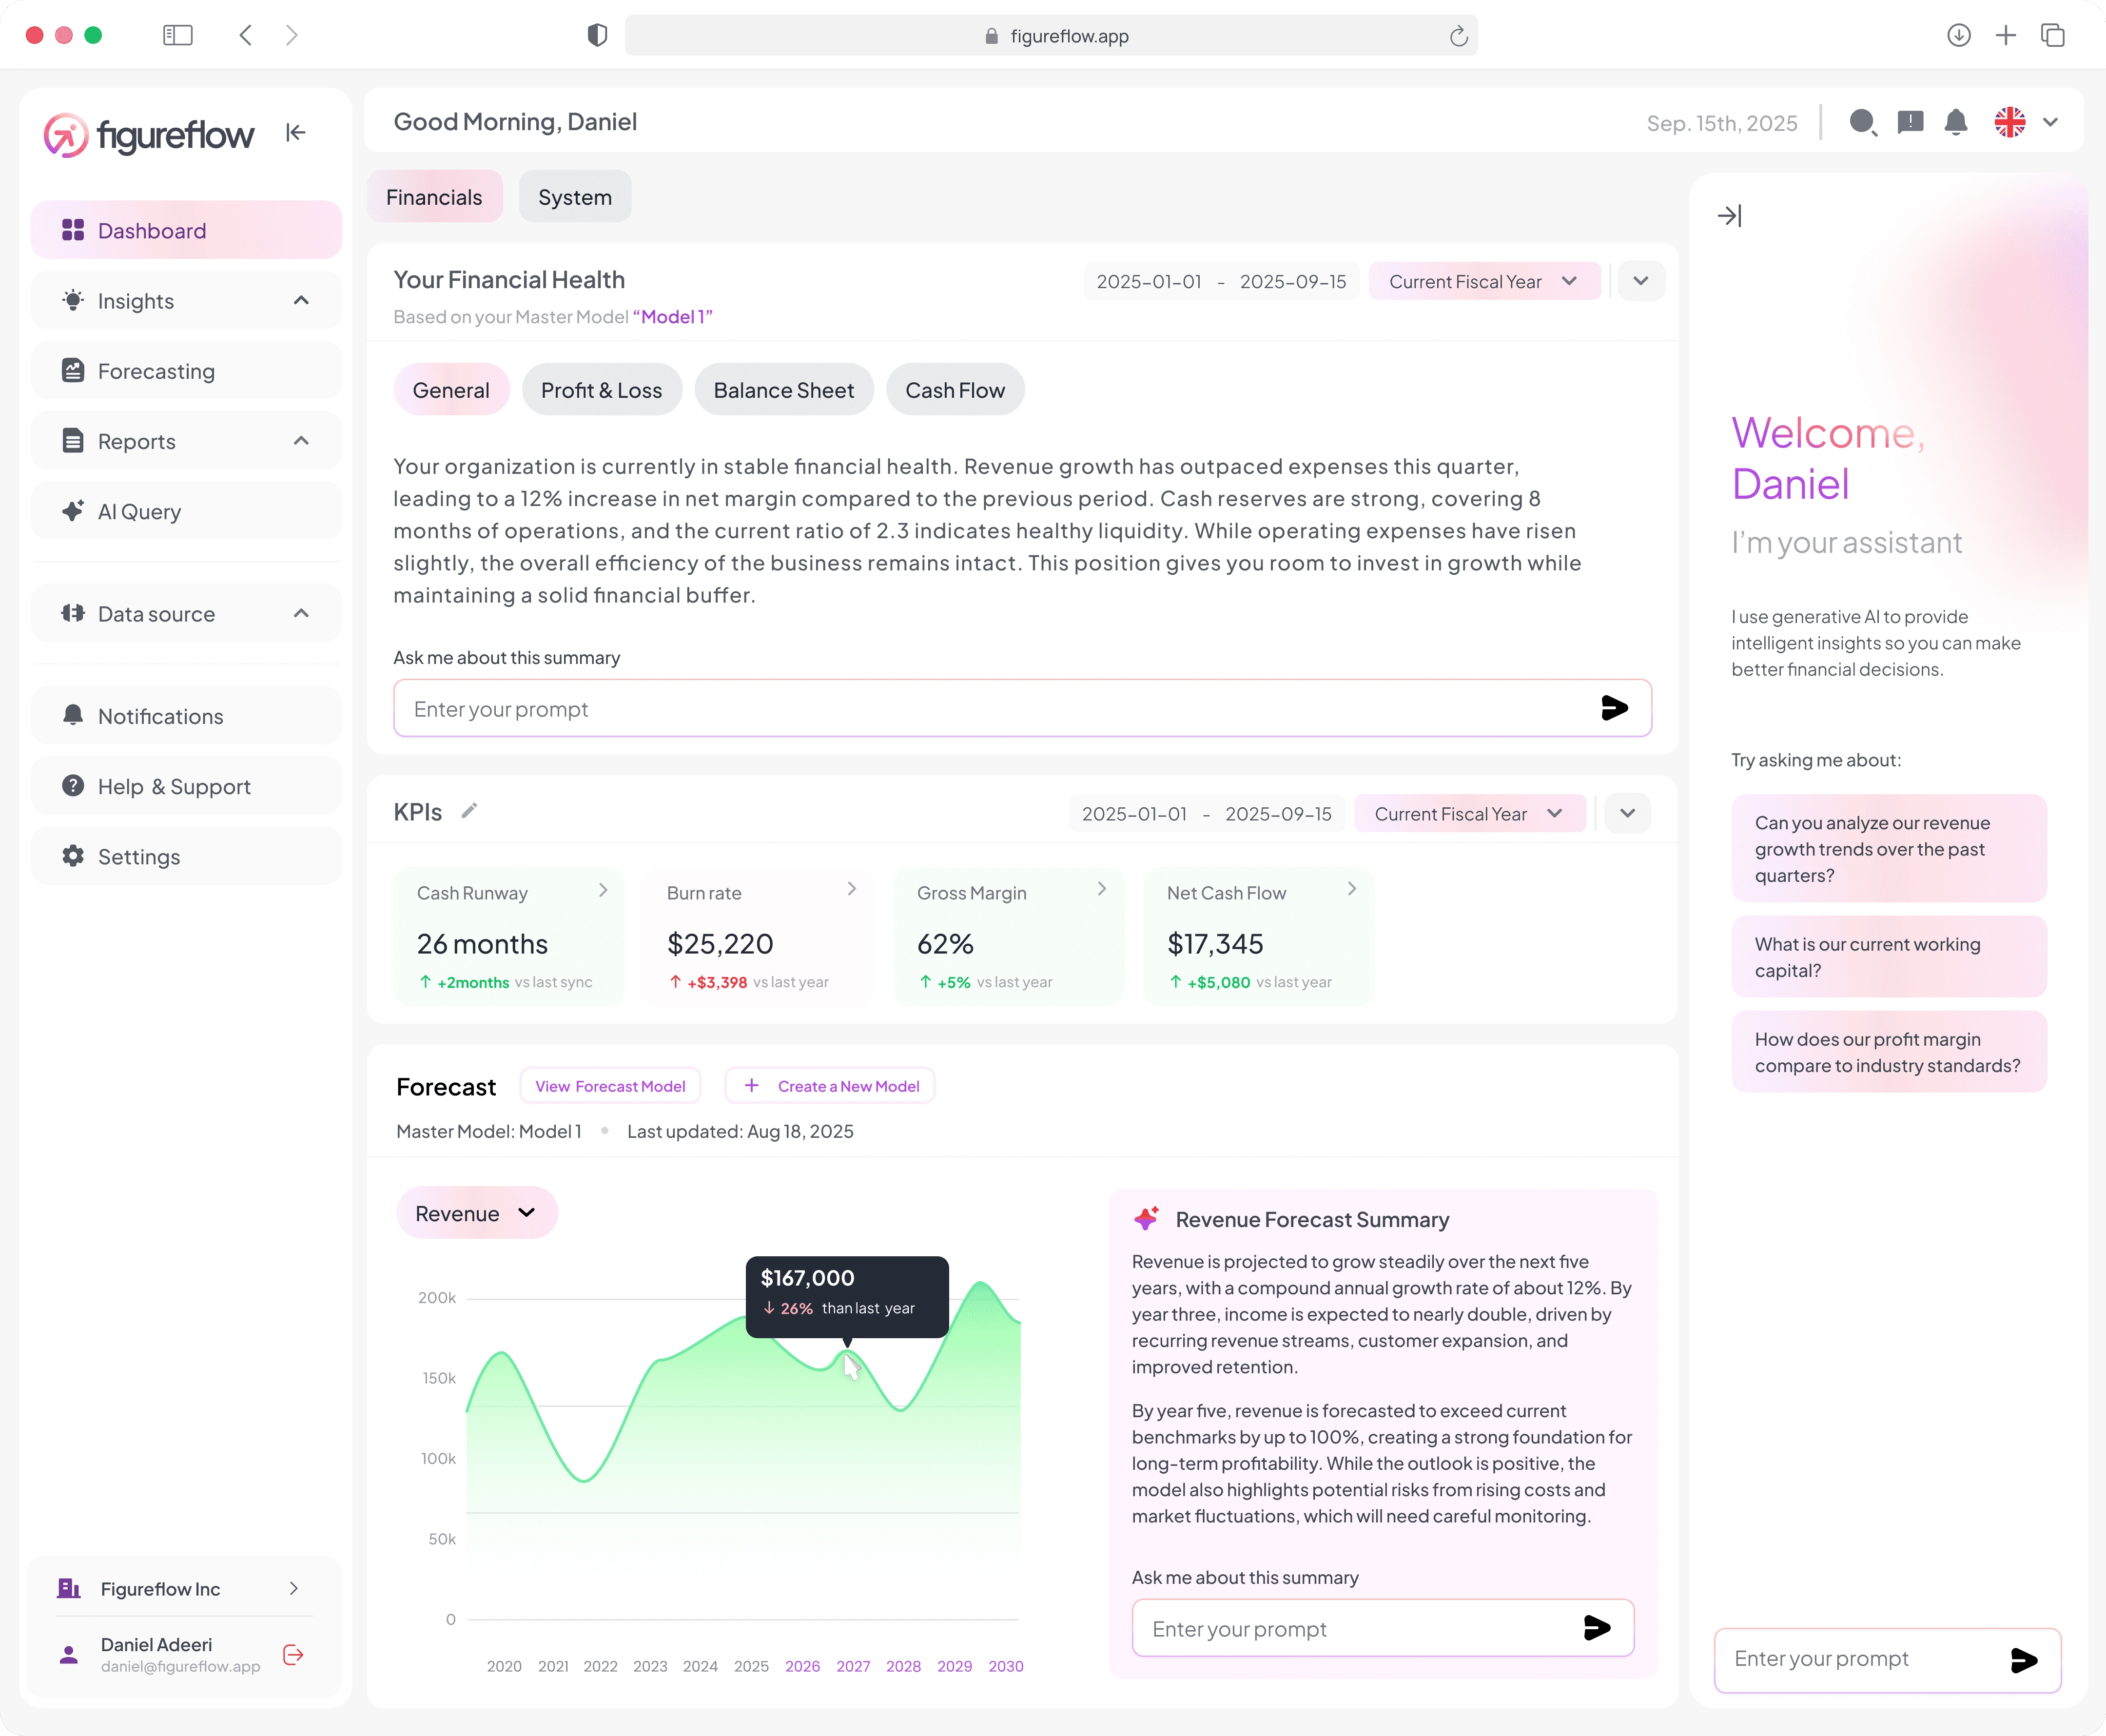
FigureFlow financial health dashboard
A separate System view shifts the focus from analysis to management, including data sources, reports, alerts, and organisation switching.
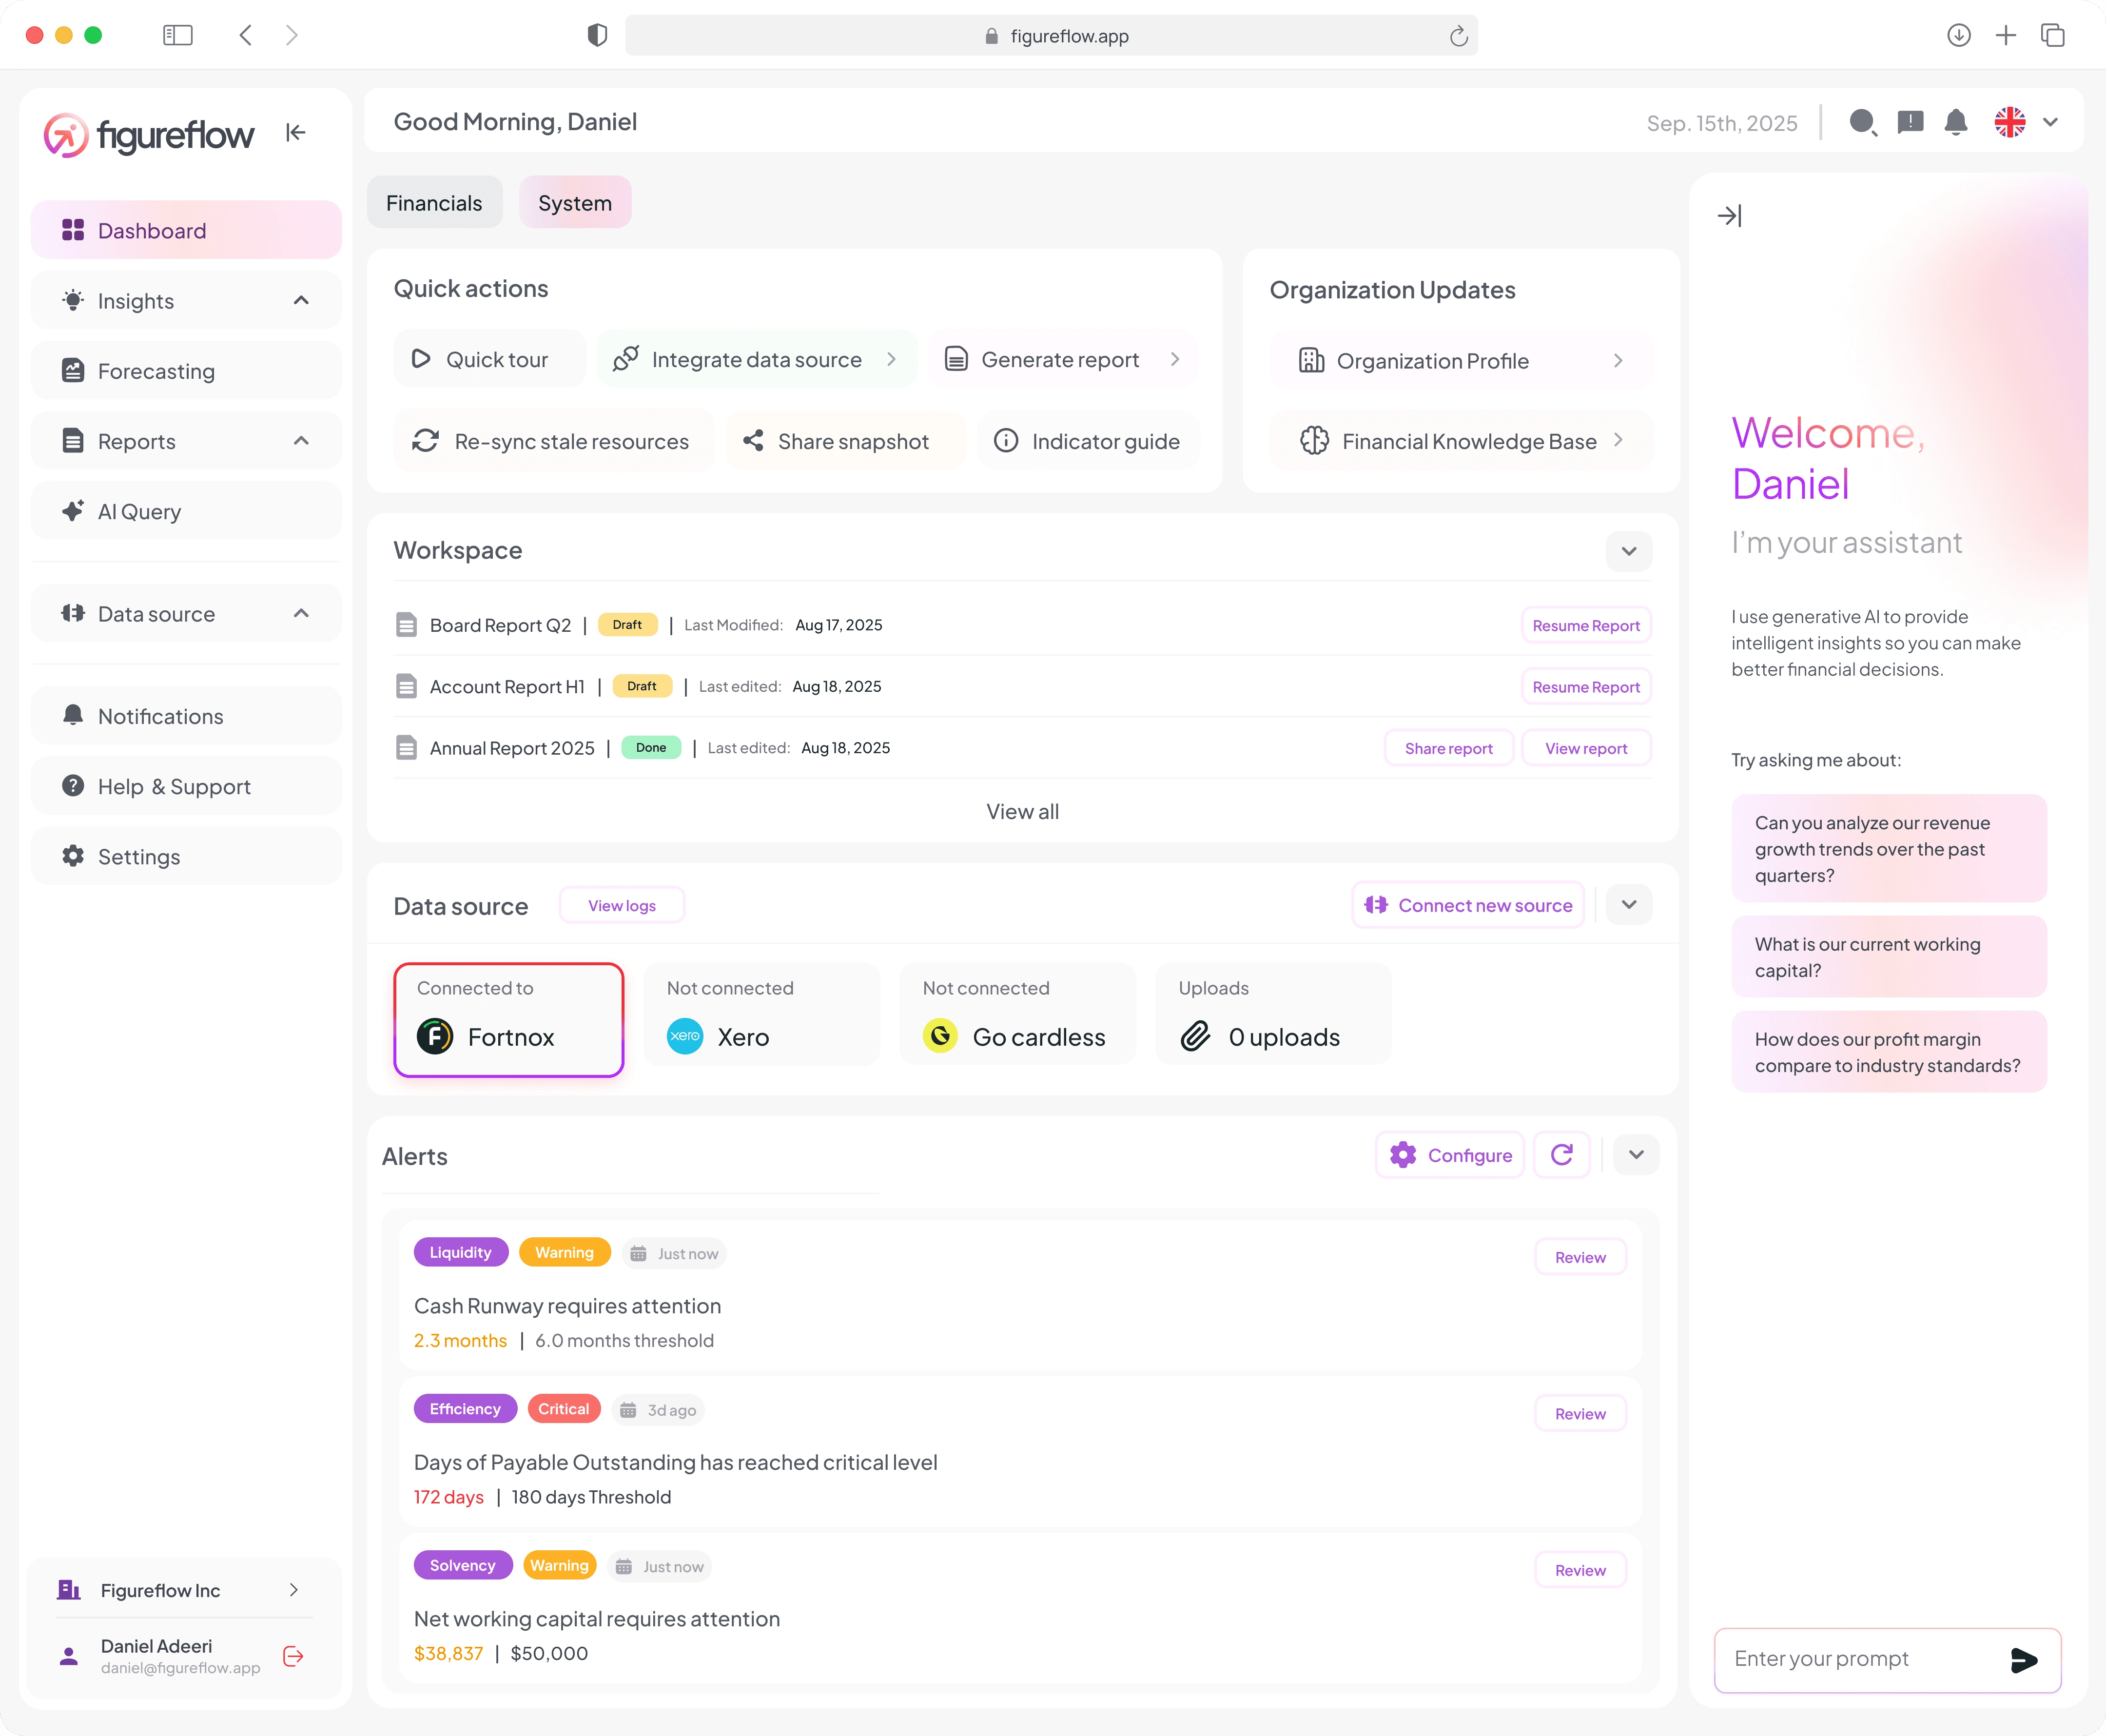
FigureFlow system dashboard
Insights
The Insights module moves beyond reporting into interpretation. It highlights what needs attention and why, turning financial data into actionable signals across 5 areas:
Liquidity
Efficiency
Profitability
Solvency
Alerts
Liquidity covers cash flow, runway, and working capital. Efficiency covers burn rate, payable cycles, and operating ratios. Profitability focuses on margins, net income, and EBITDA, while Solvency helps teams understand long-term stability and leverage.
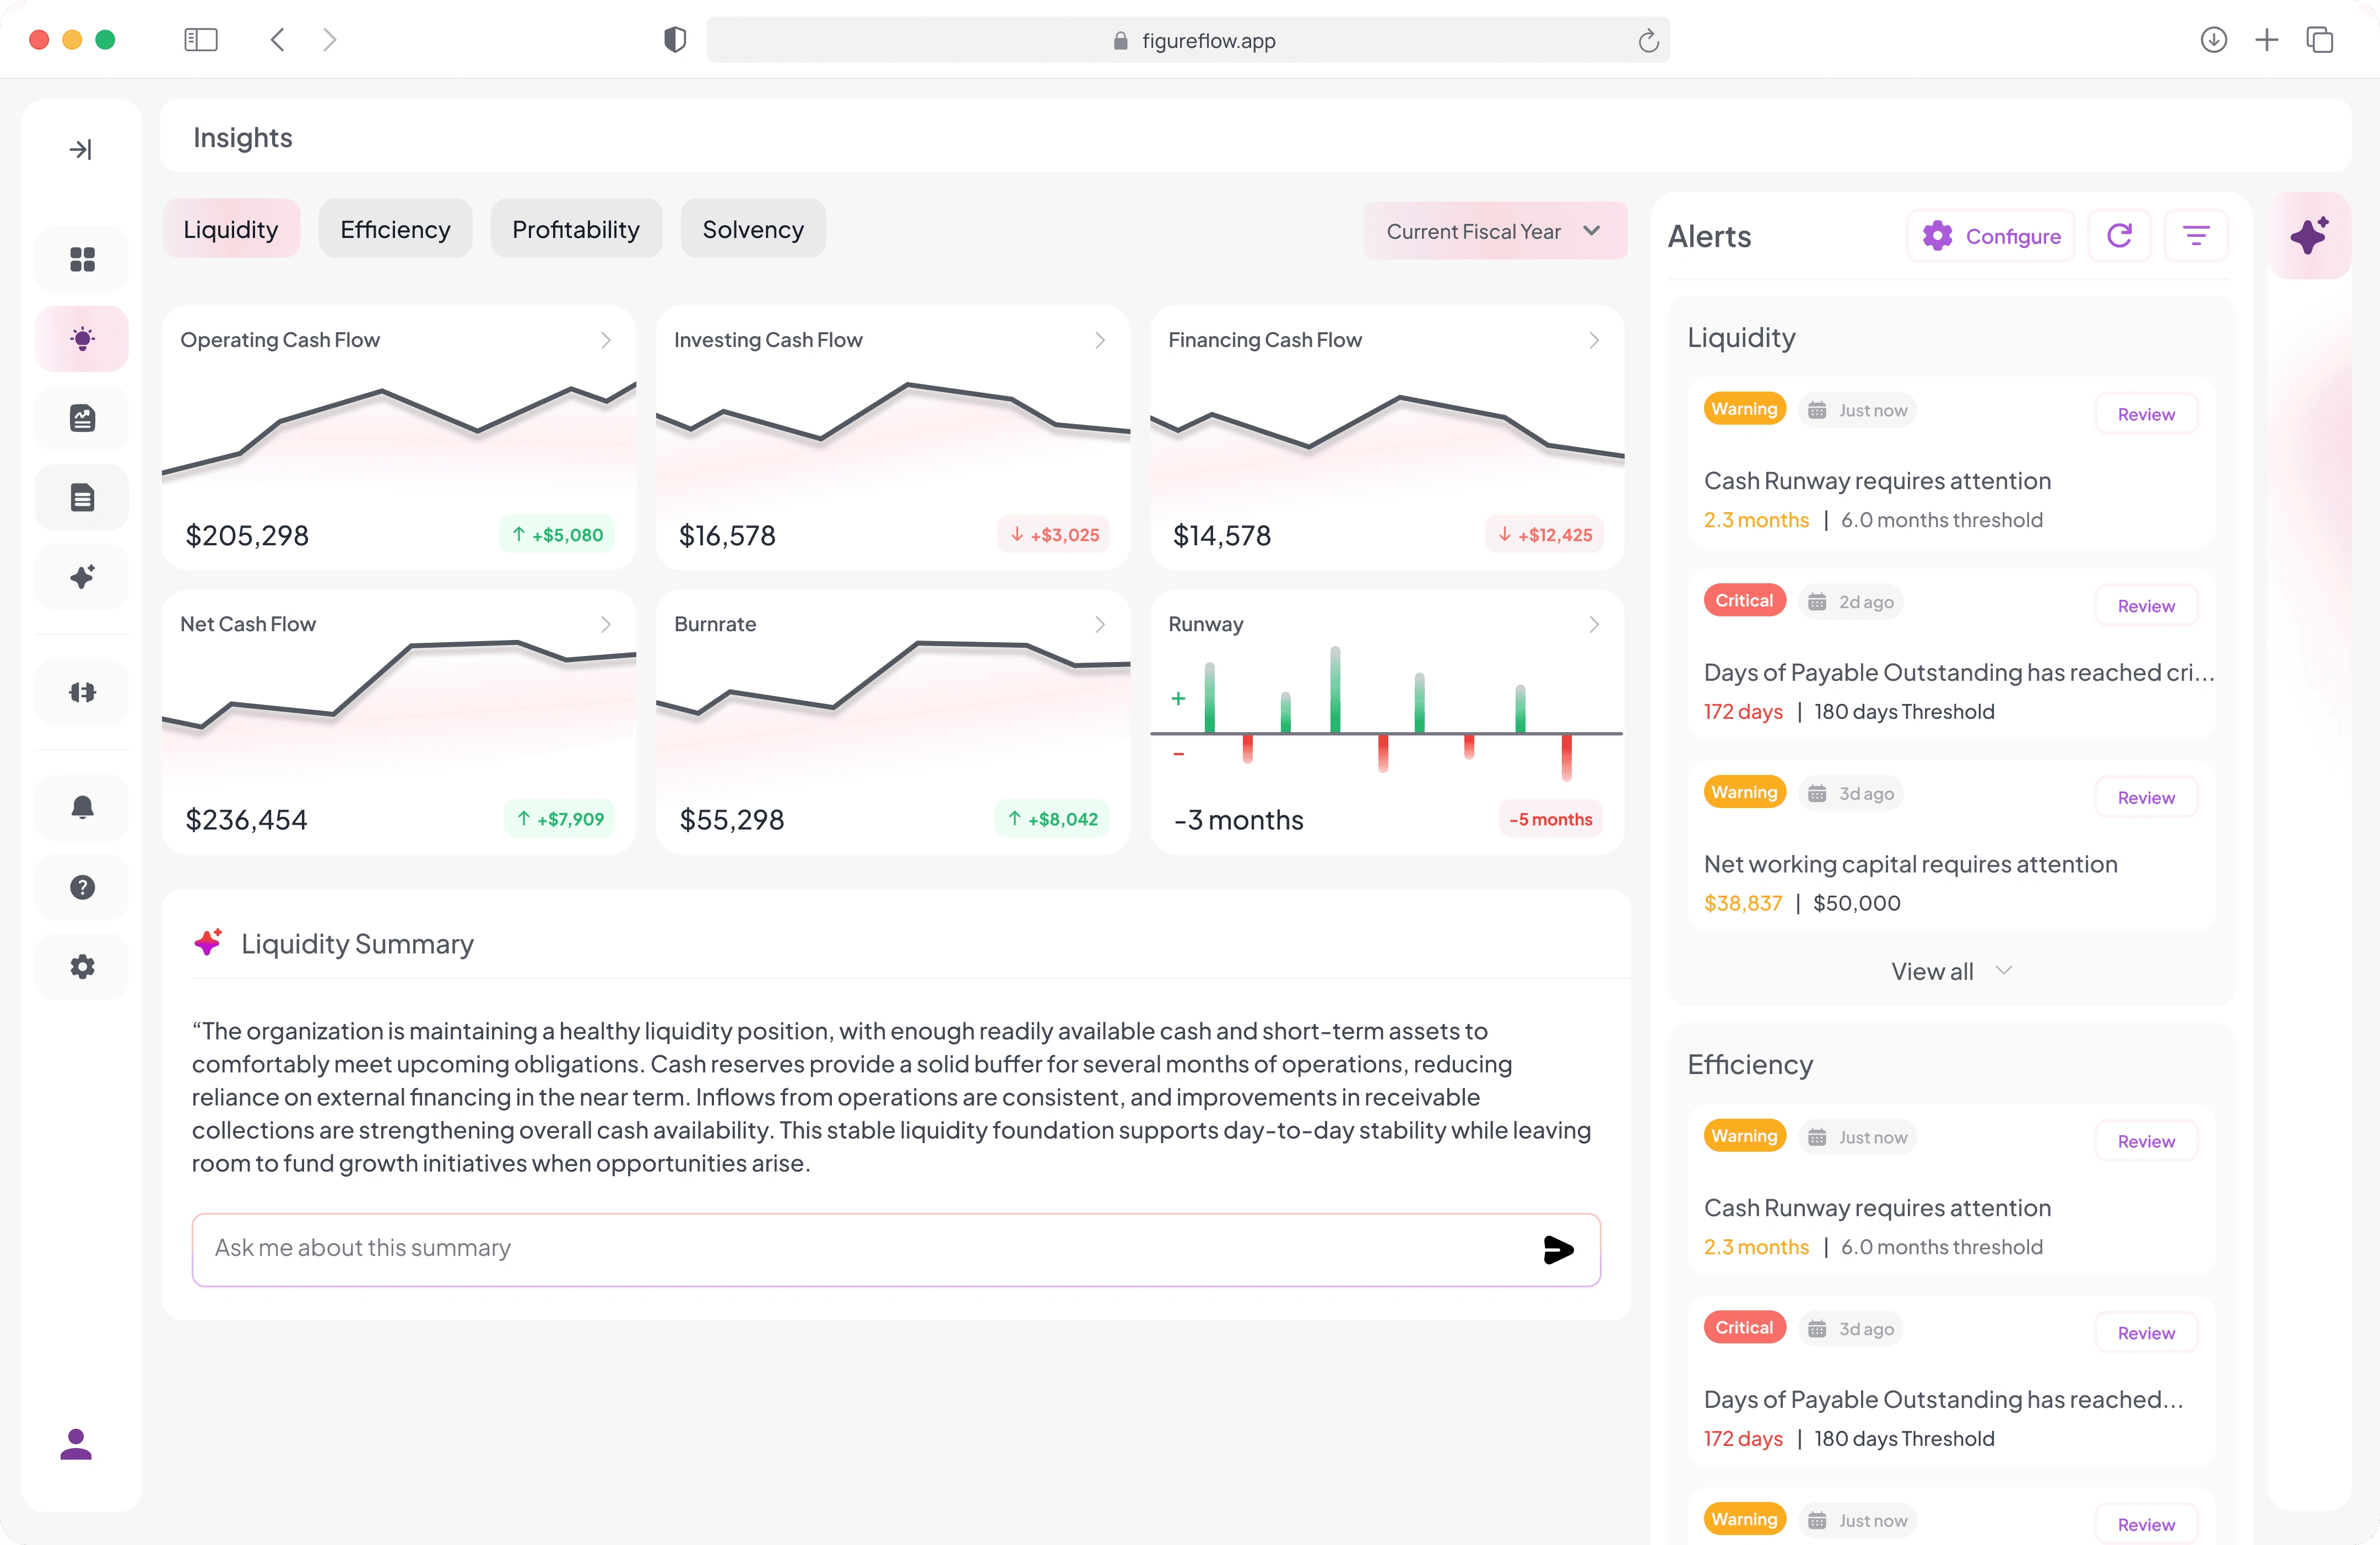
FigureFlow insights overview
Each KPI can open into a detailed view with an Overview and Data Table. The overview shows historical performance, projected values, and month-over-month variance. The data table gives finance teams a transparent monthly breakdown.
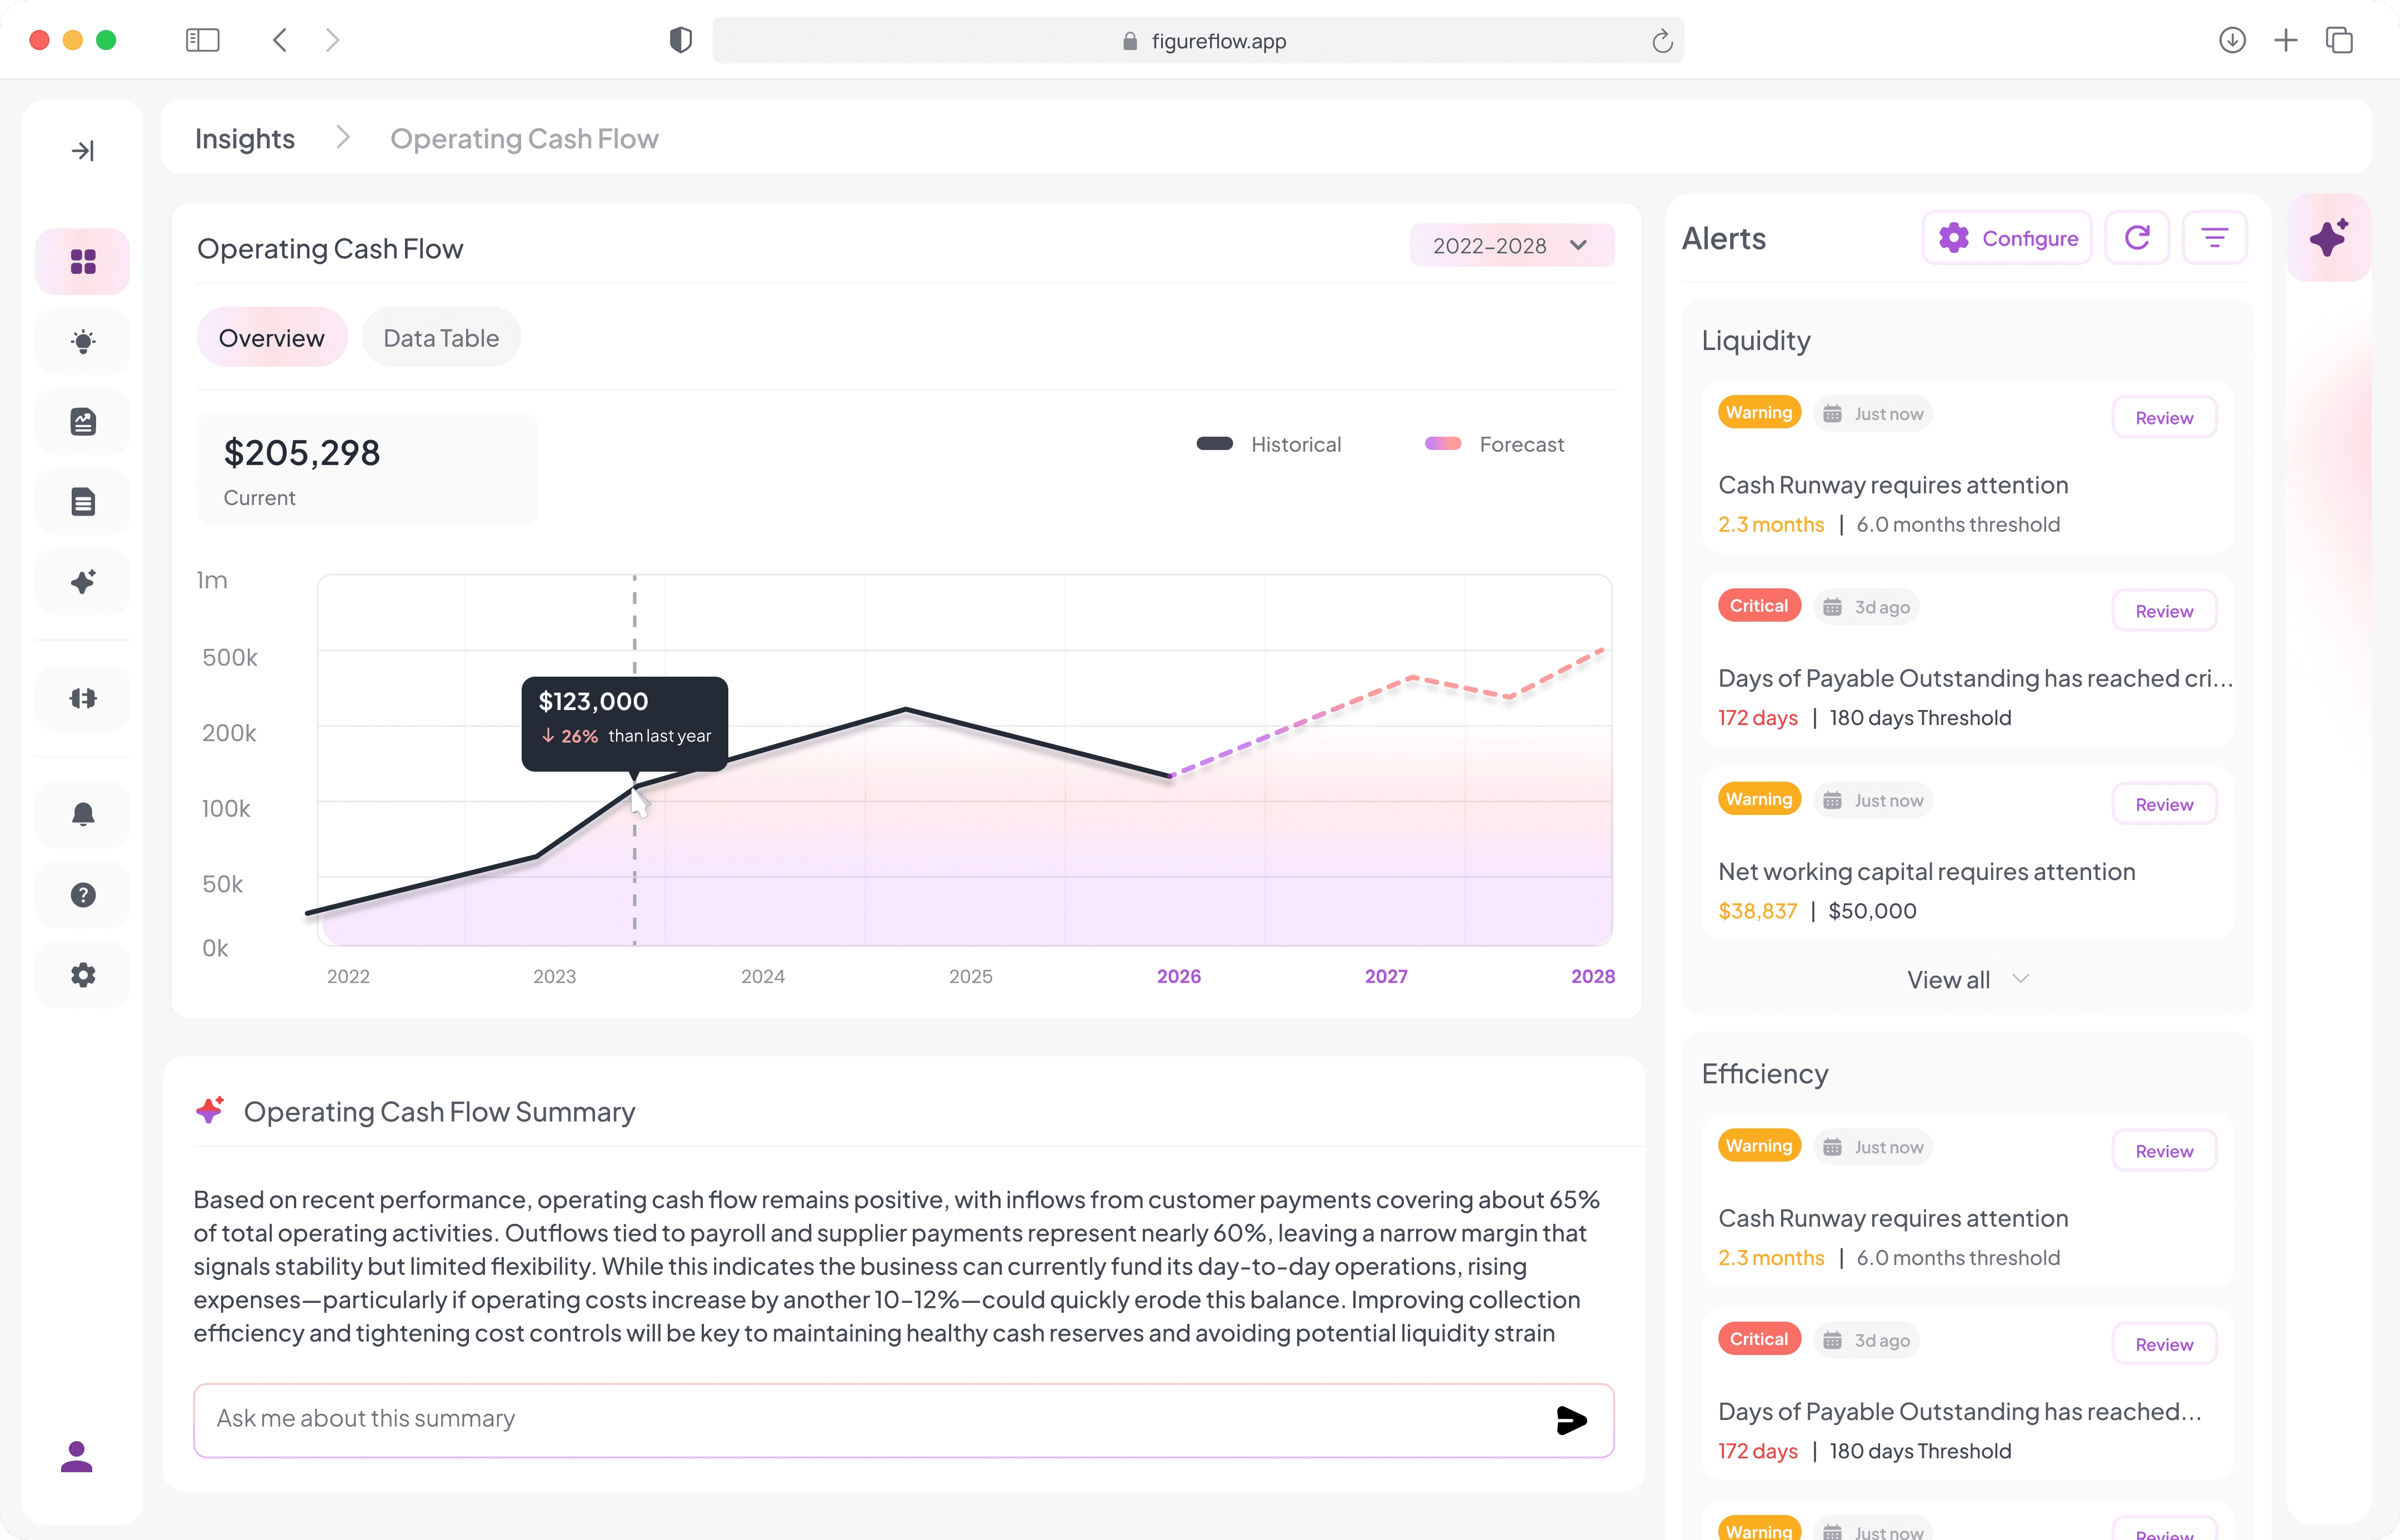
FigureFlow KPI overview
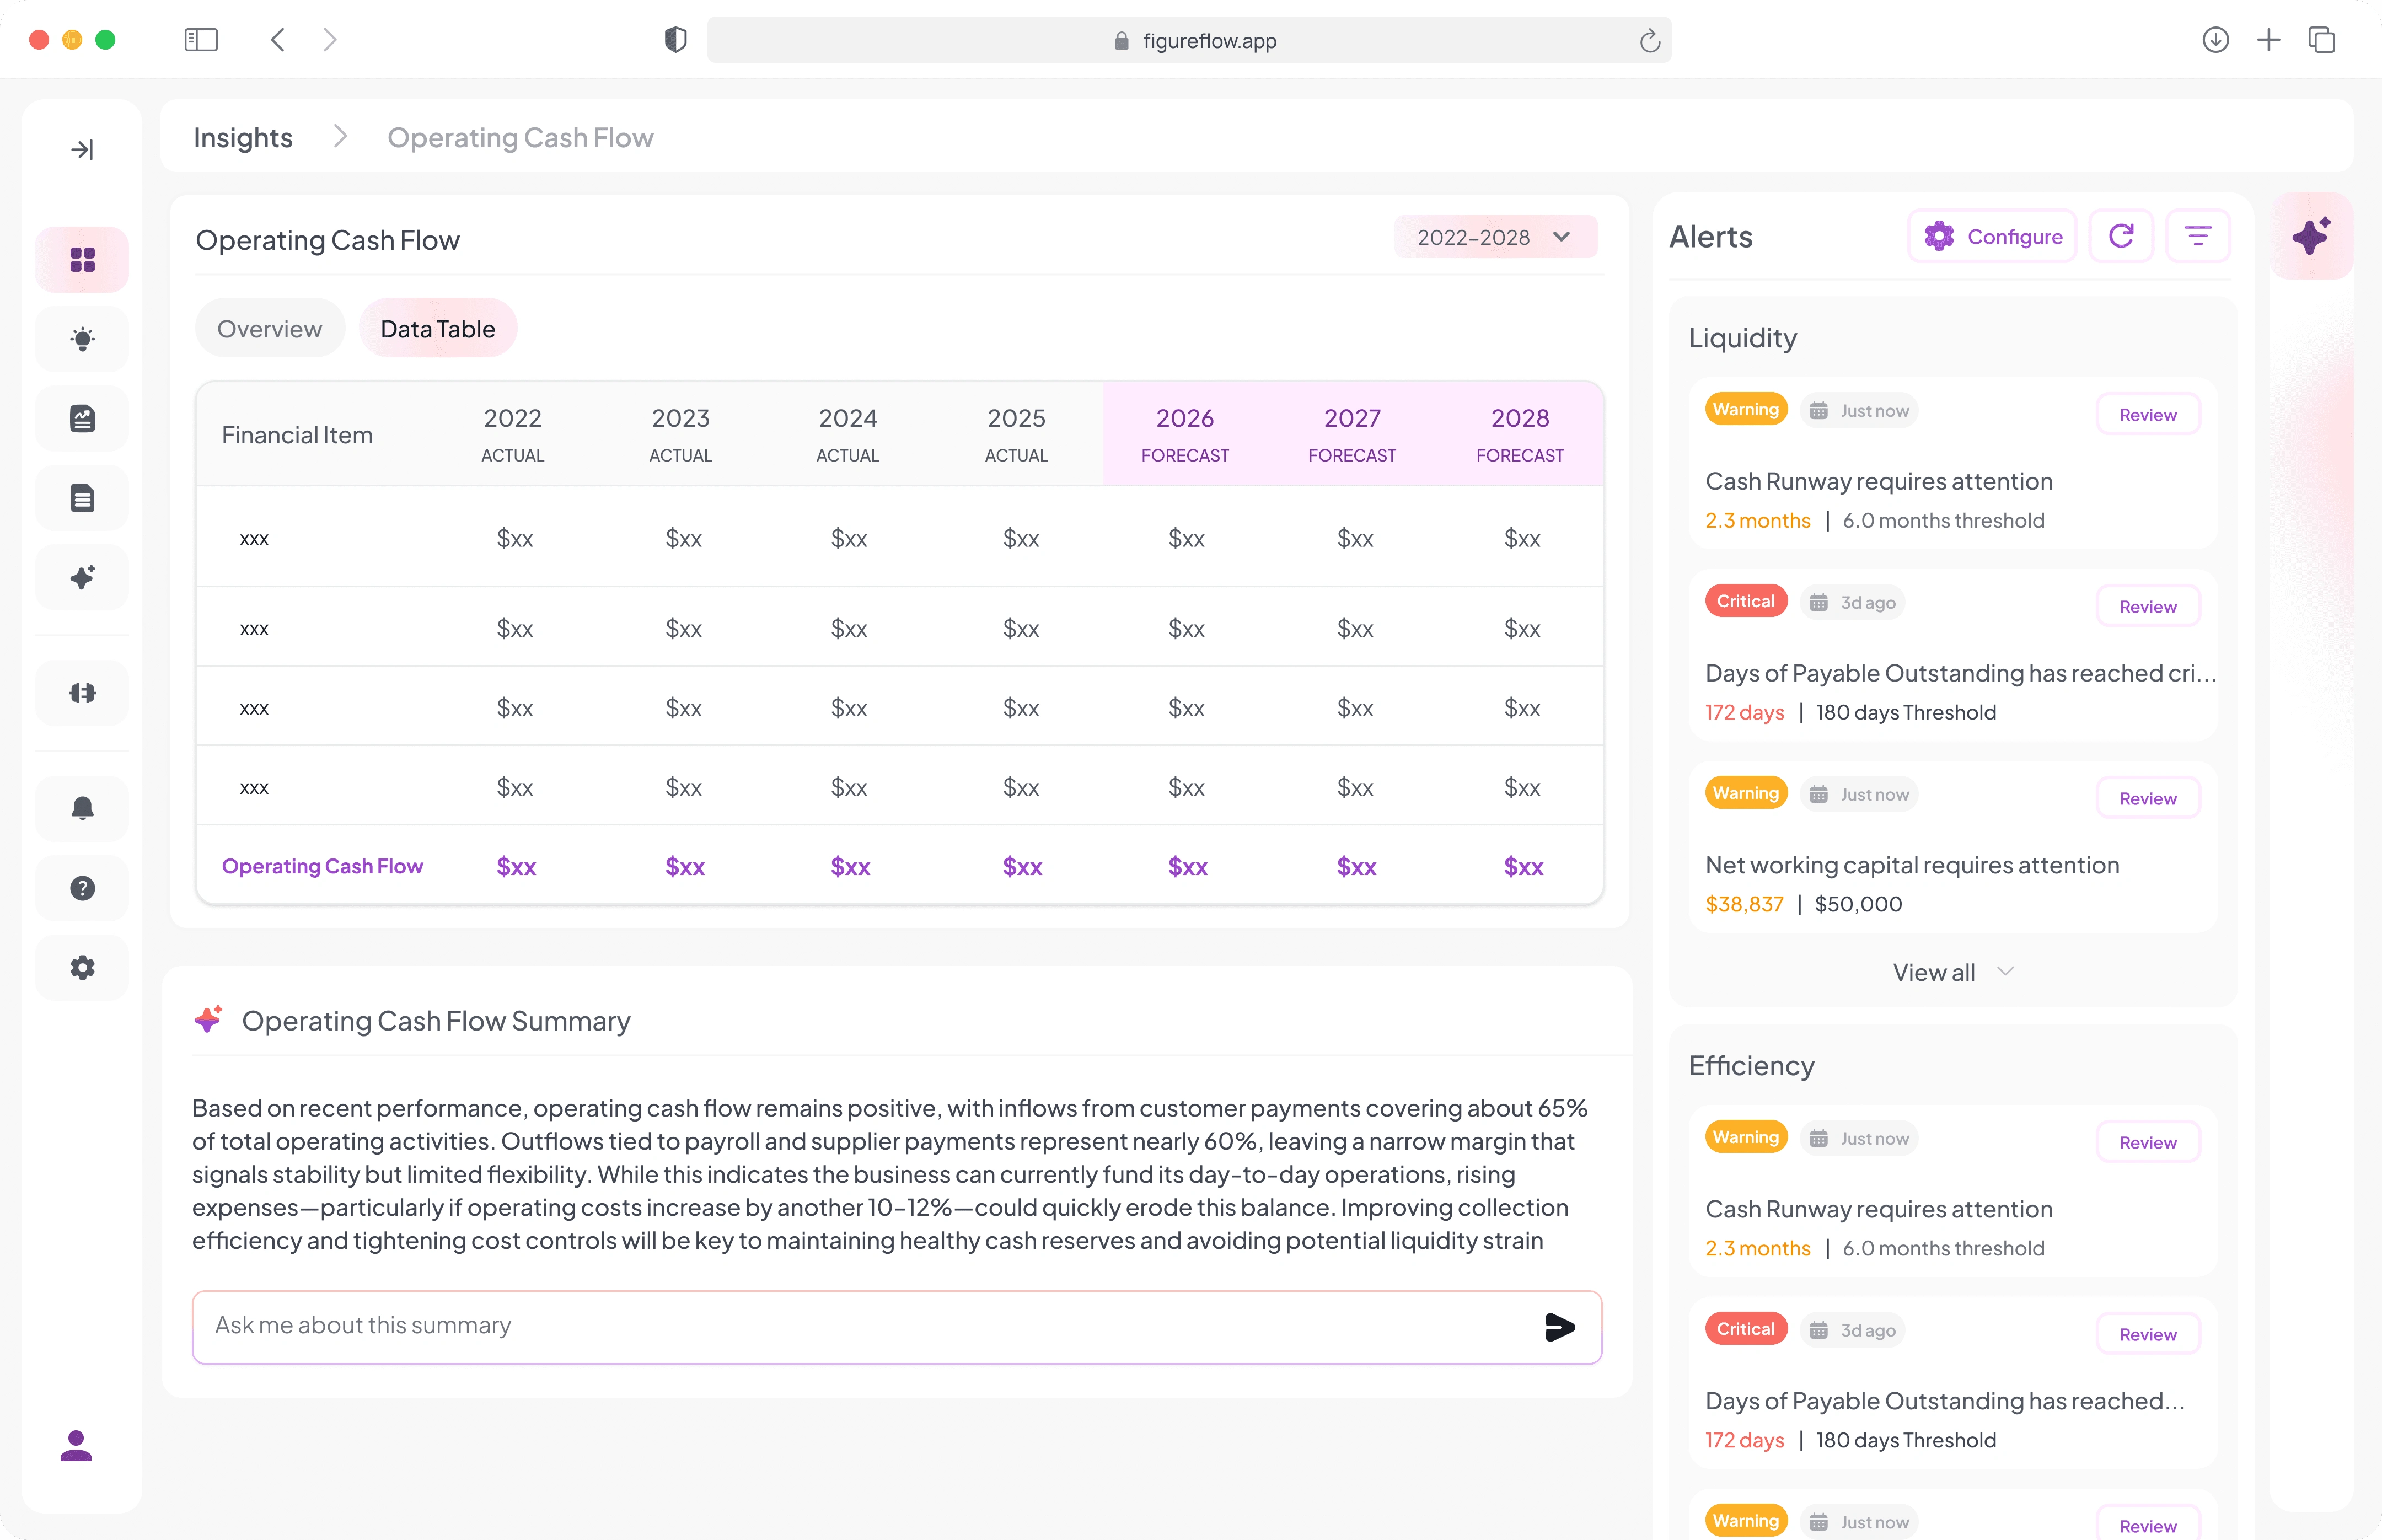
FigureFlow KPI data table
Alerts are grouped by financial category and show severity, threshold comparison, time context, and a direct review action. Teams can adjust alert limits, toggle warnings, and customise thresholds per metric, such as minimum cash runway, acceptable burn rate, or current-ratio targets.
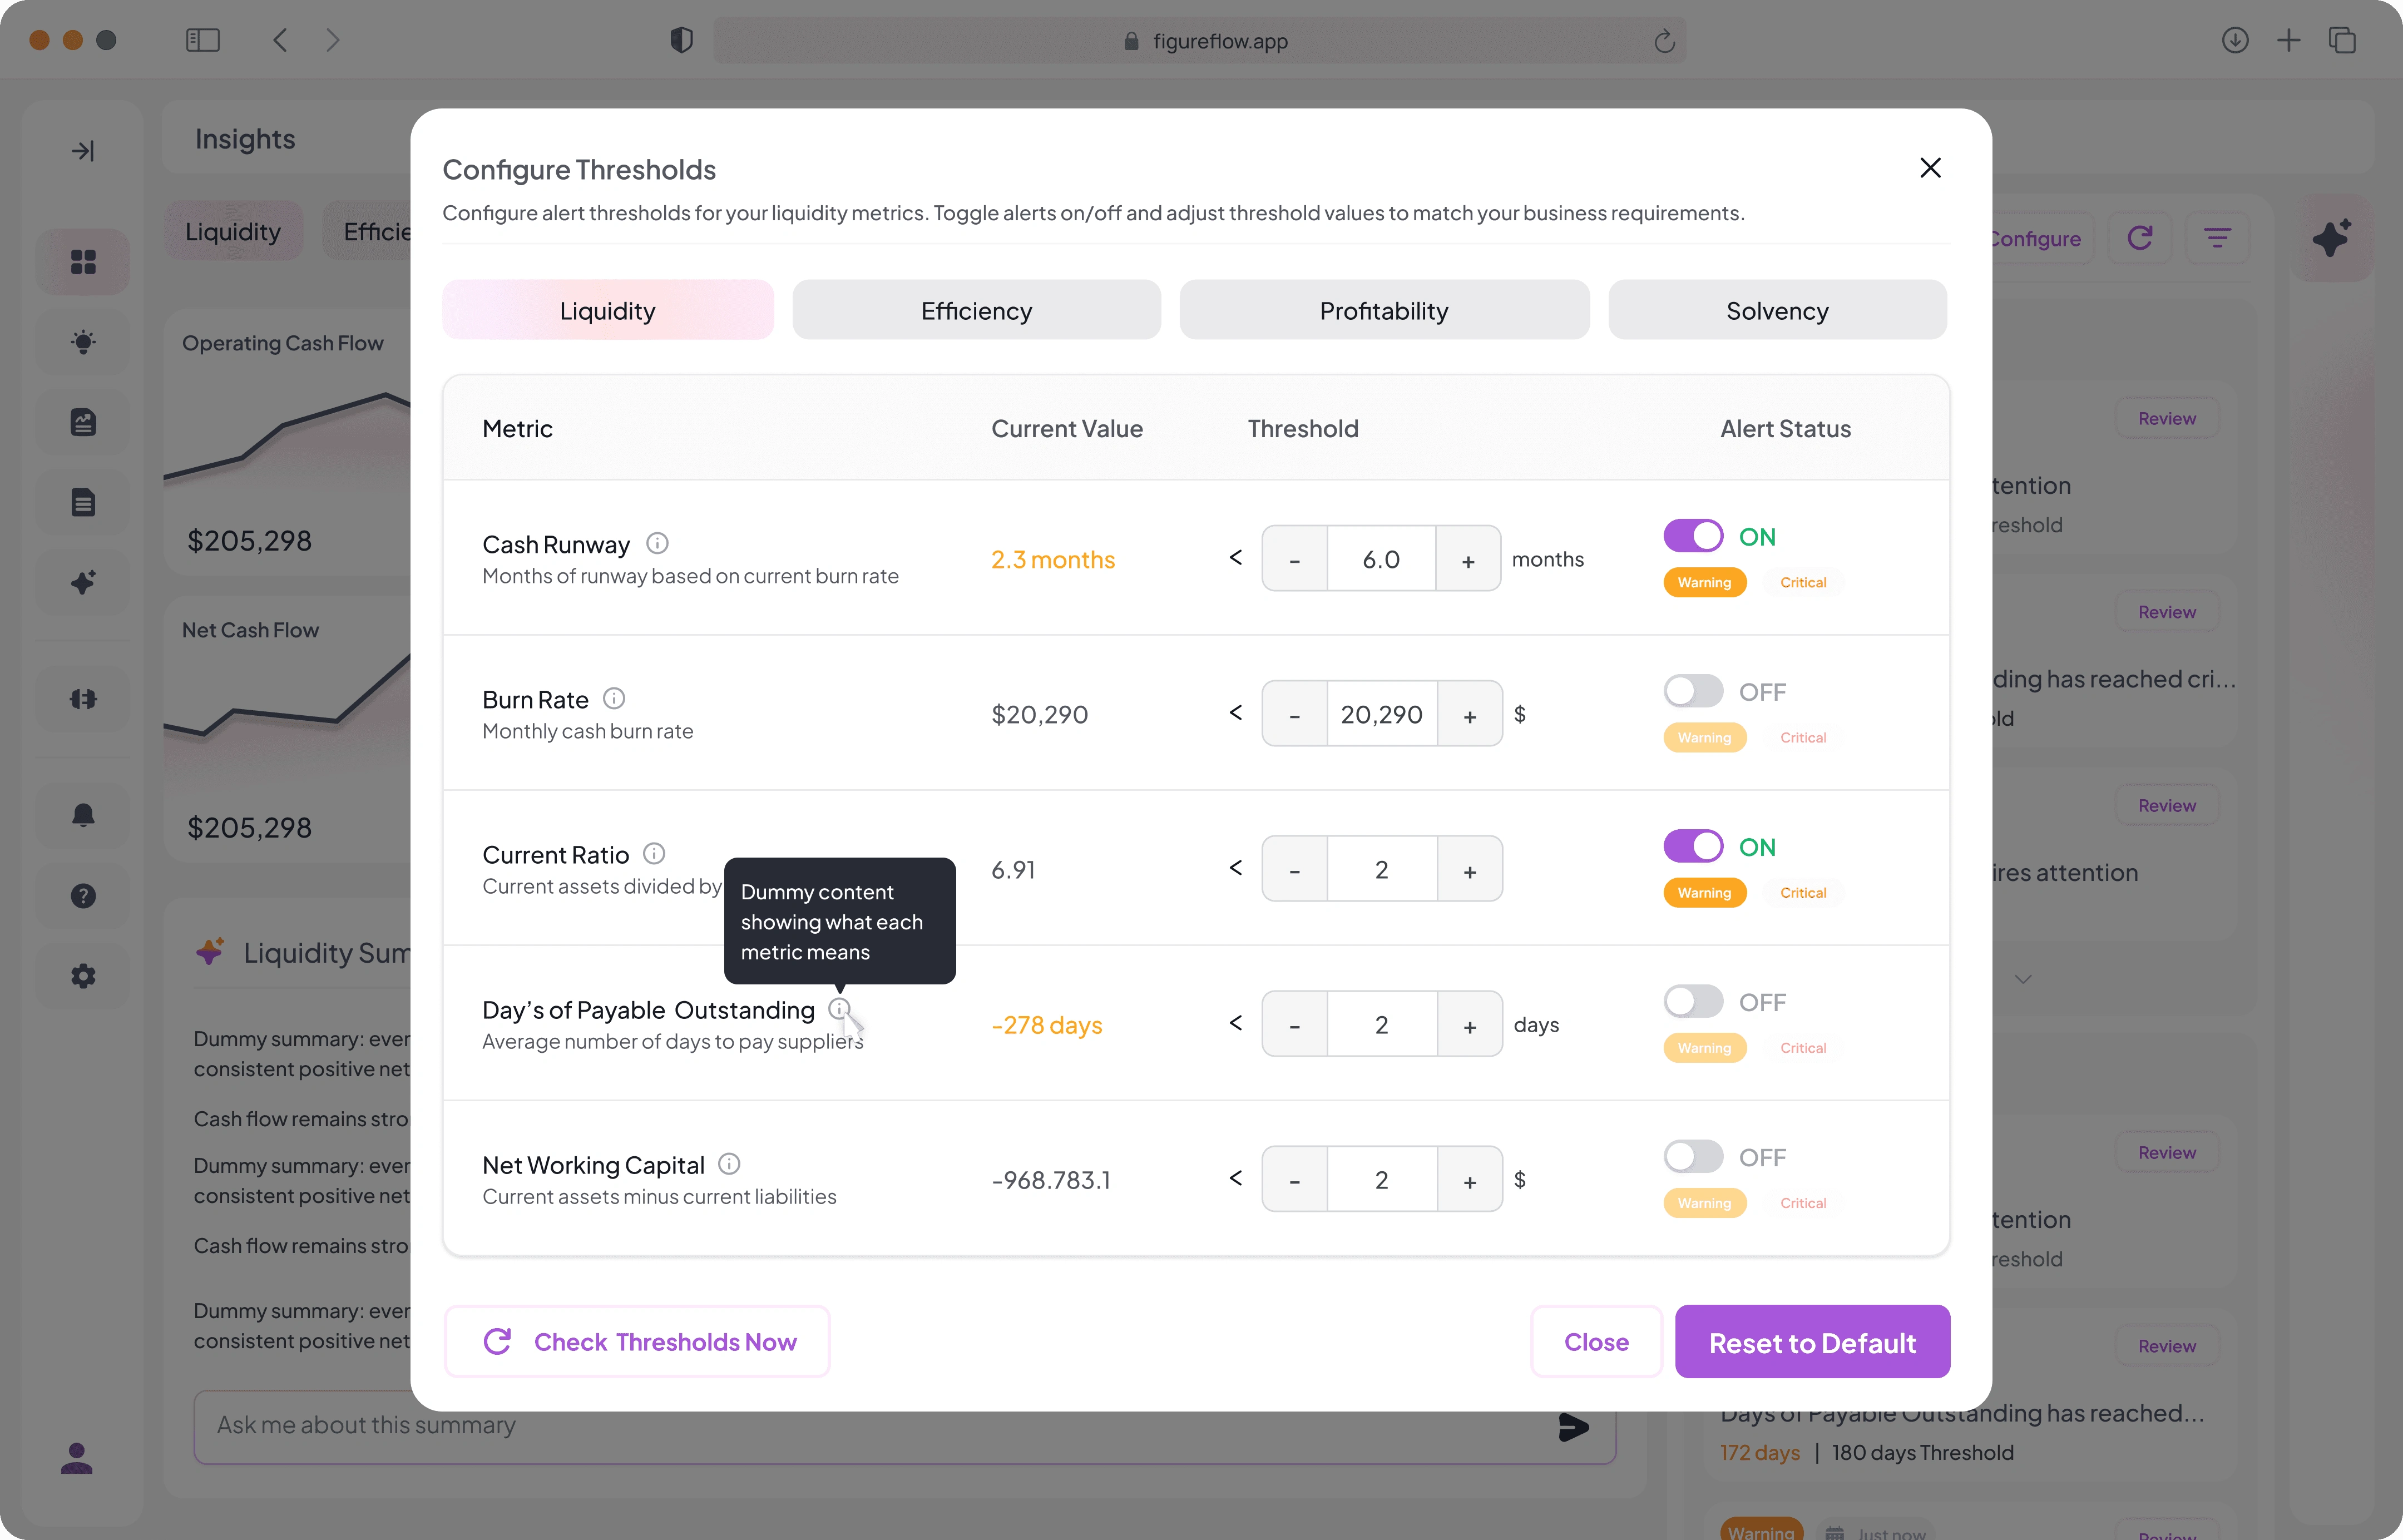
FigureFlow alert configuration
Opening an alert provides an executive summary, root causes, contributing factors, impact assessment, risk level and timeline, and recommended actions.
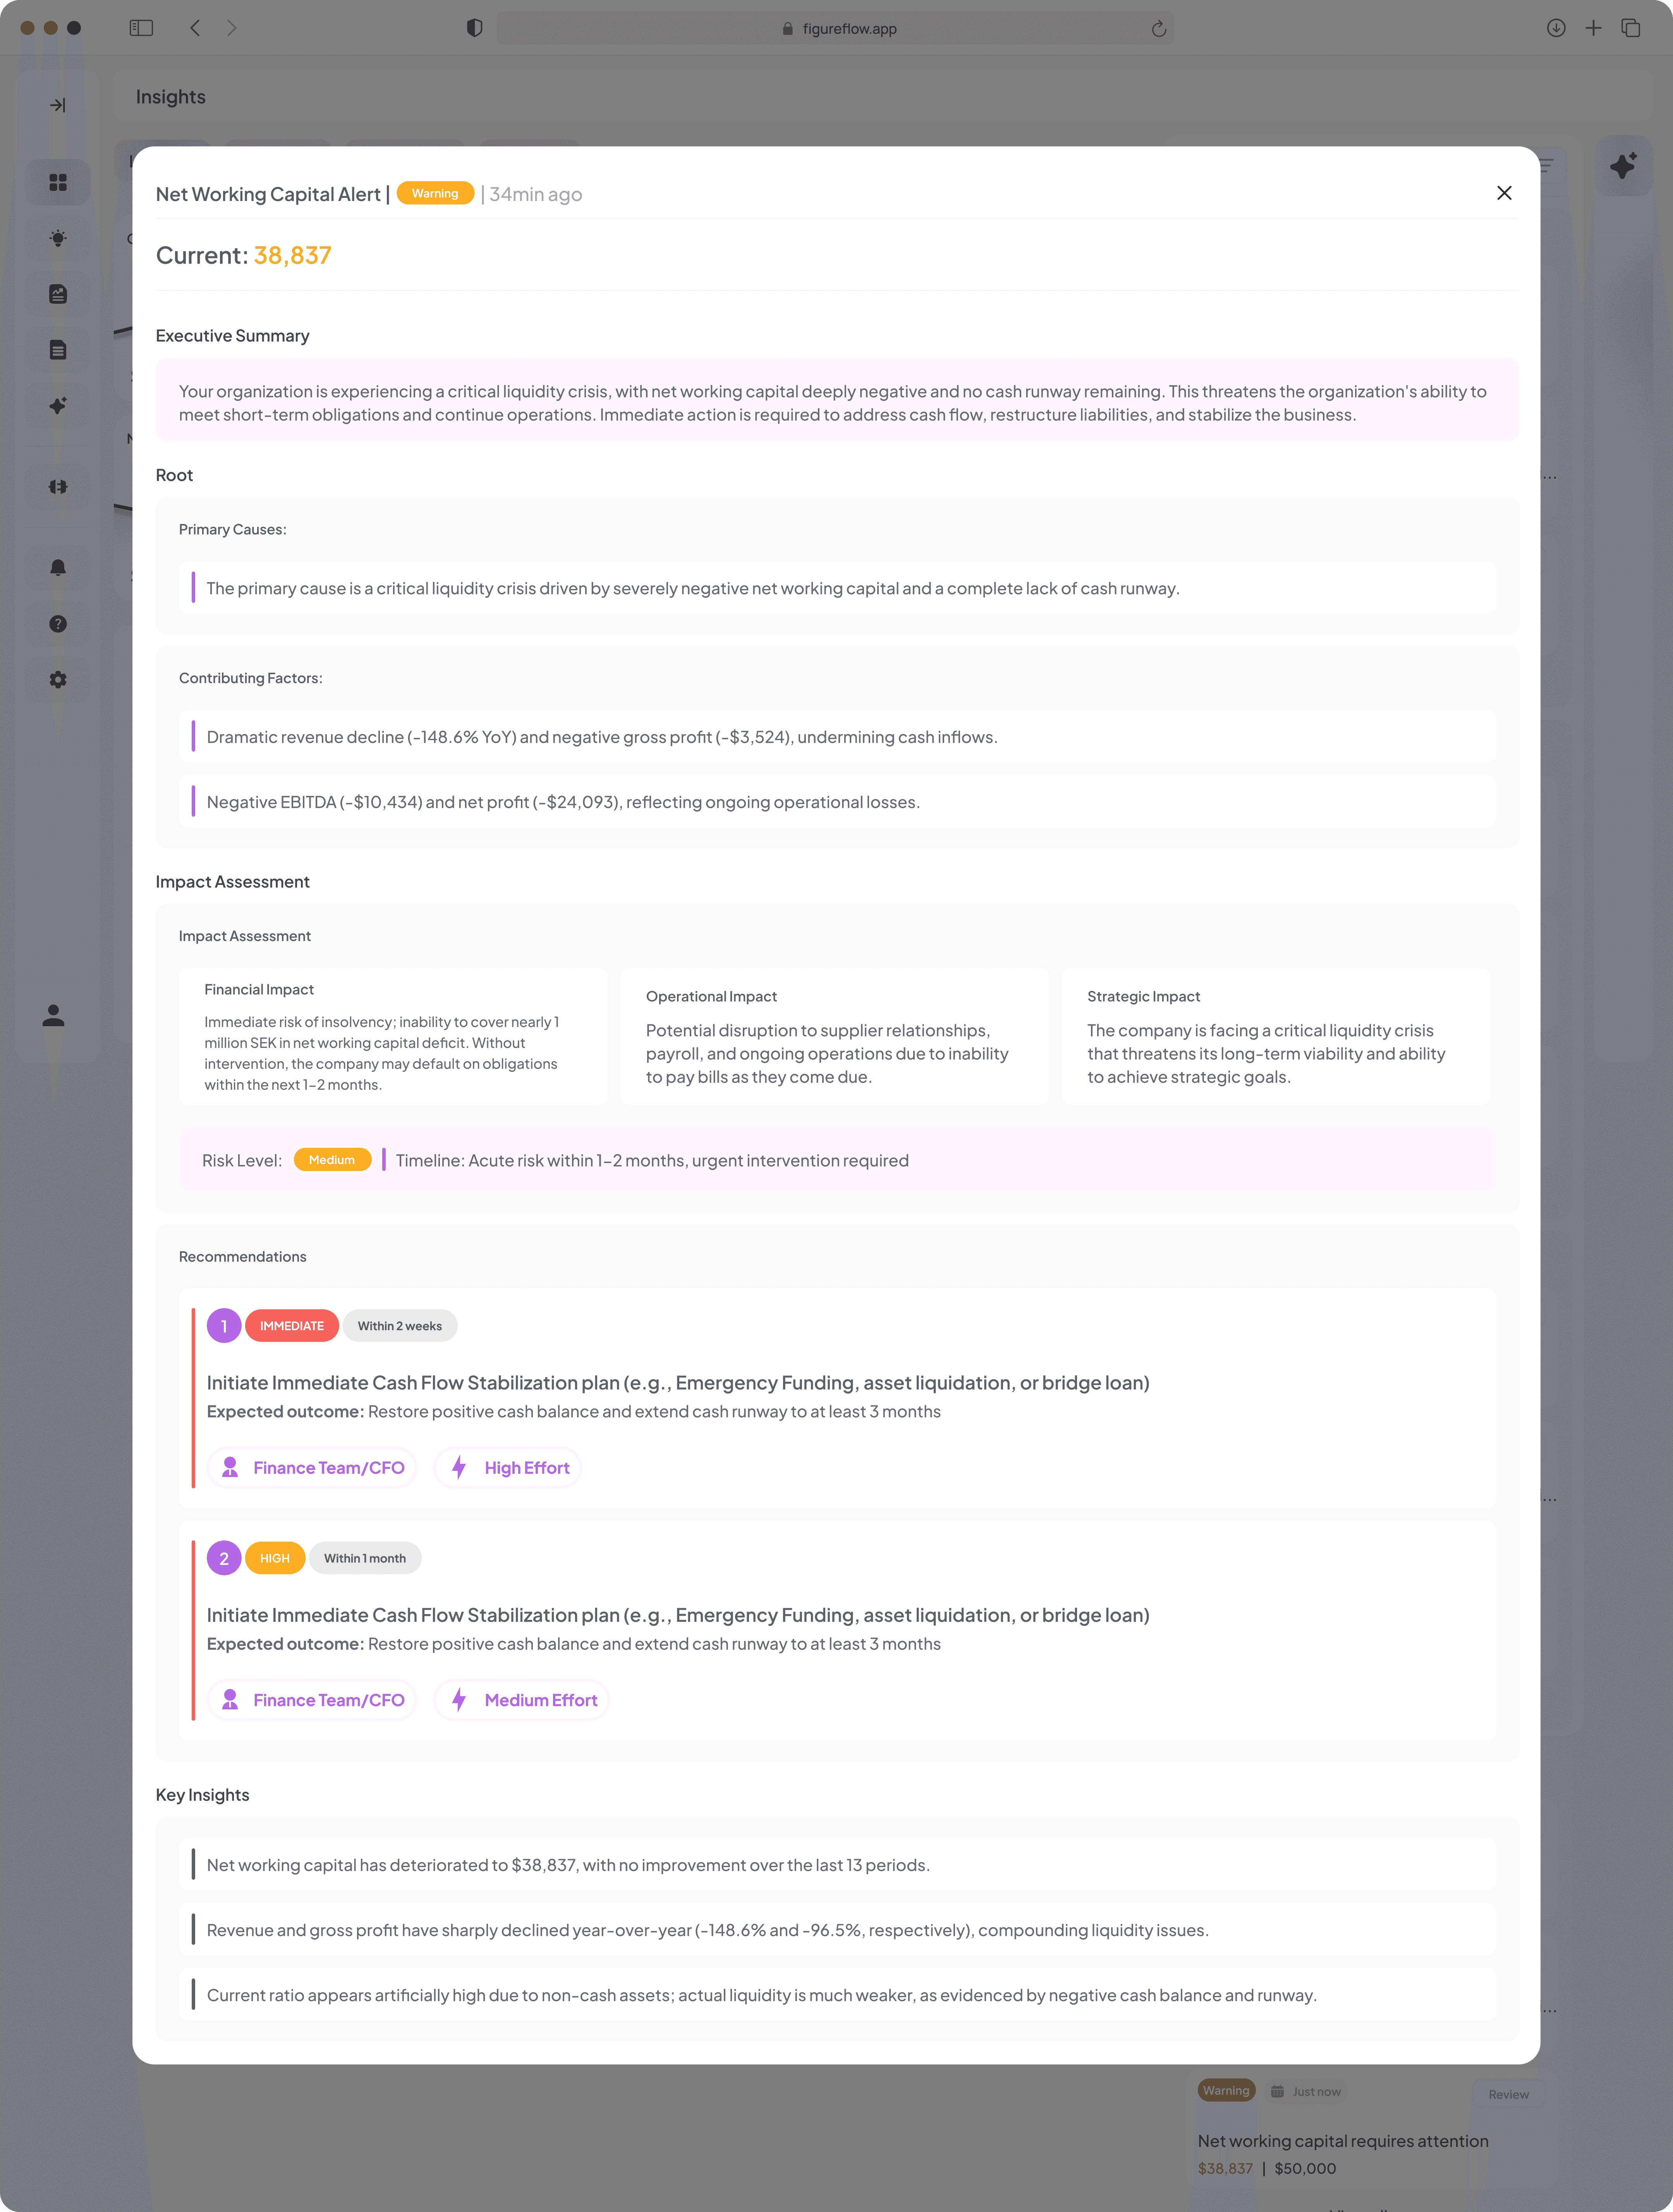
FigureFlow alert details
Forecasting
Forecasting lets users build financial models using connected data, without exporting to disconnected spreadsheets. The home screen shows models as versioned tabs, with one Master Model as the active forecast.
Users can isolate indicators such as revenue, inspect exact values and year-over-year change, and compare 2 models on one timeline. The AI then explains where the models diverge and why.
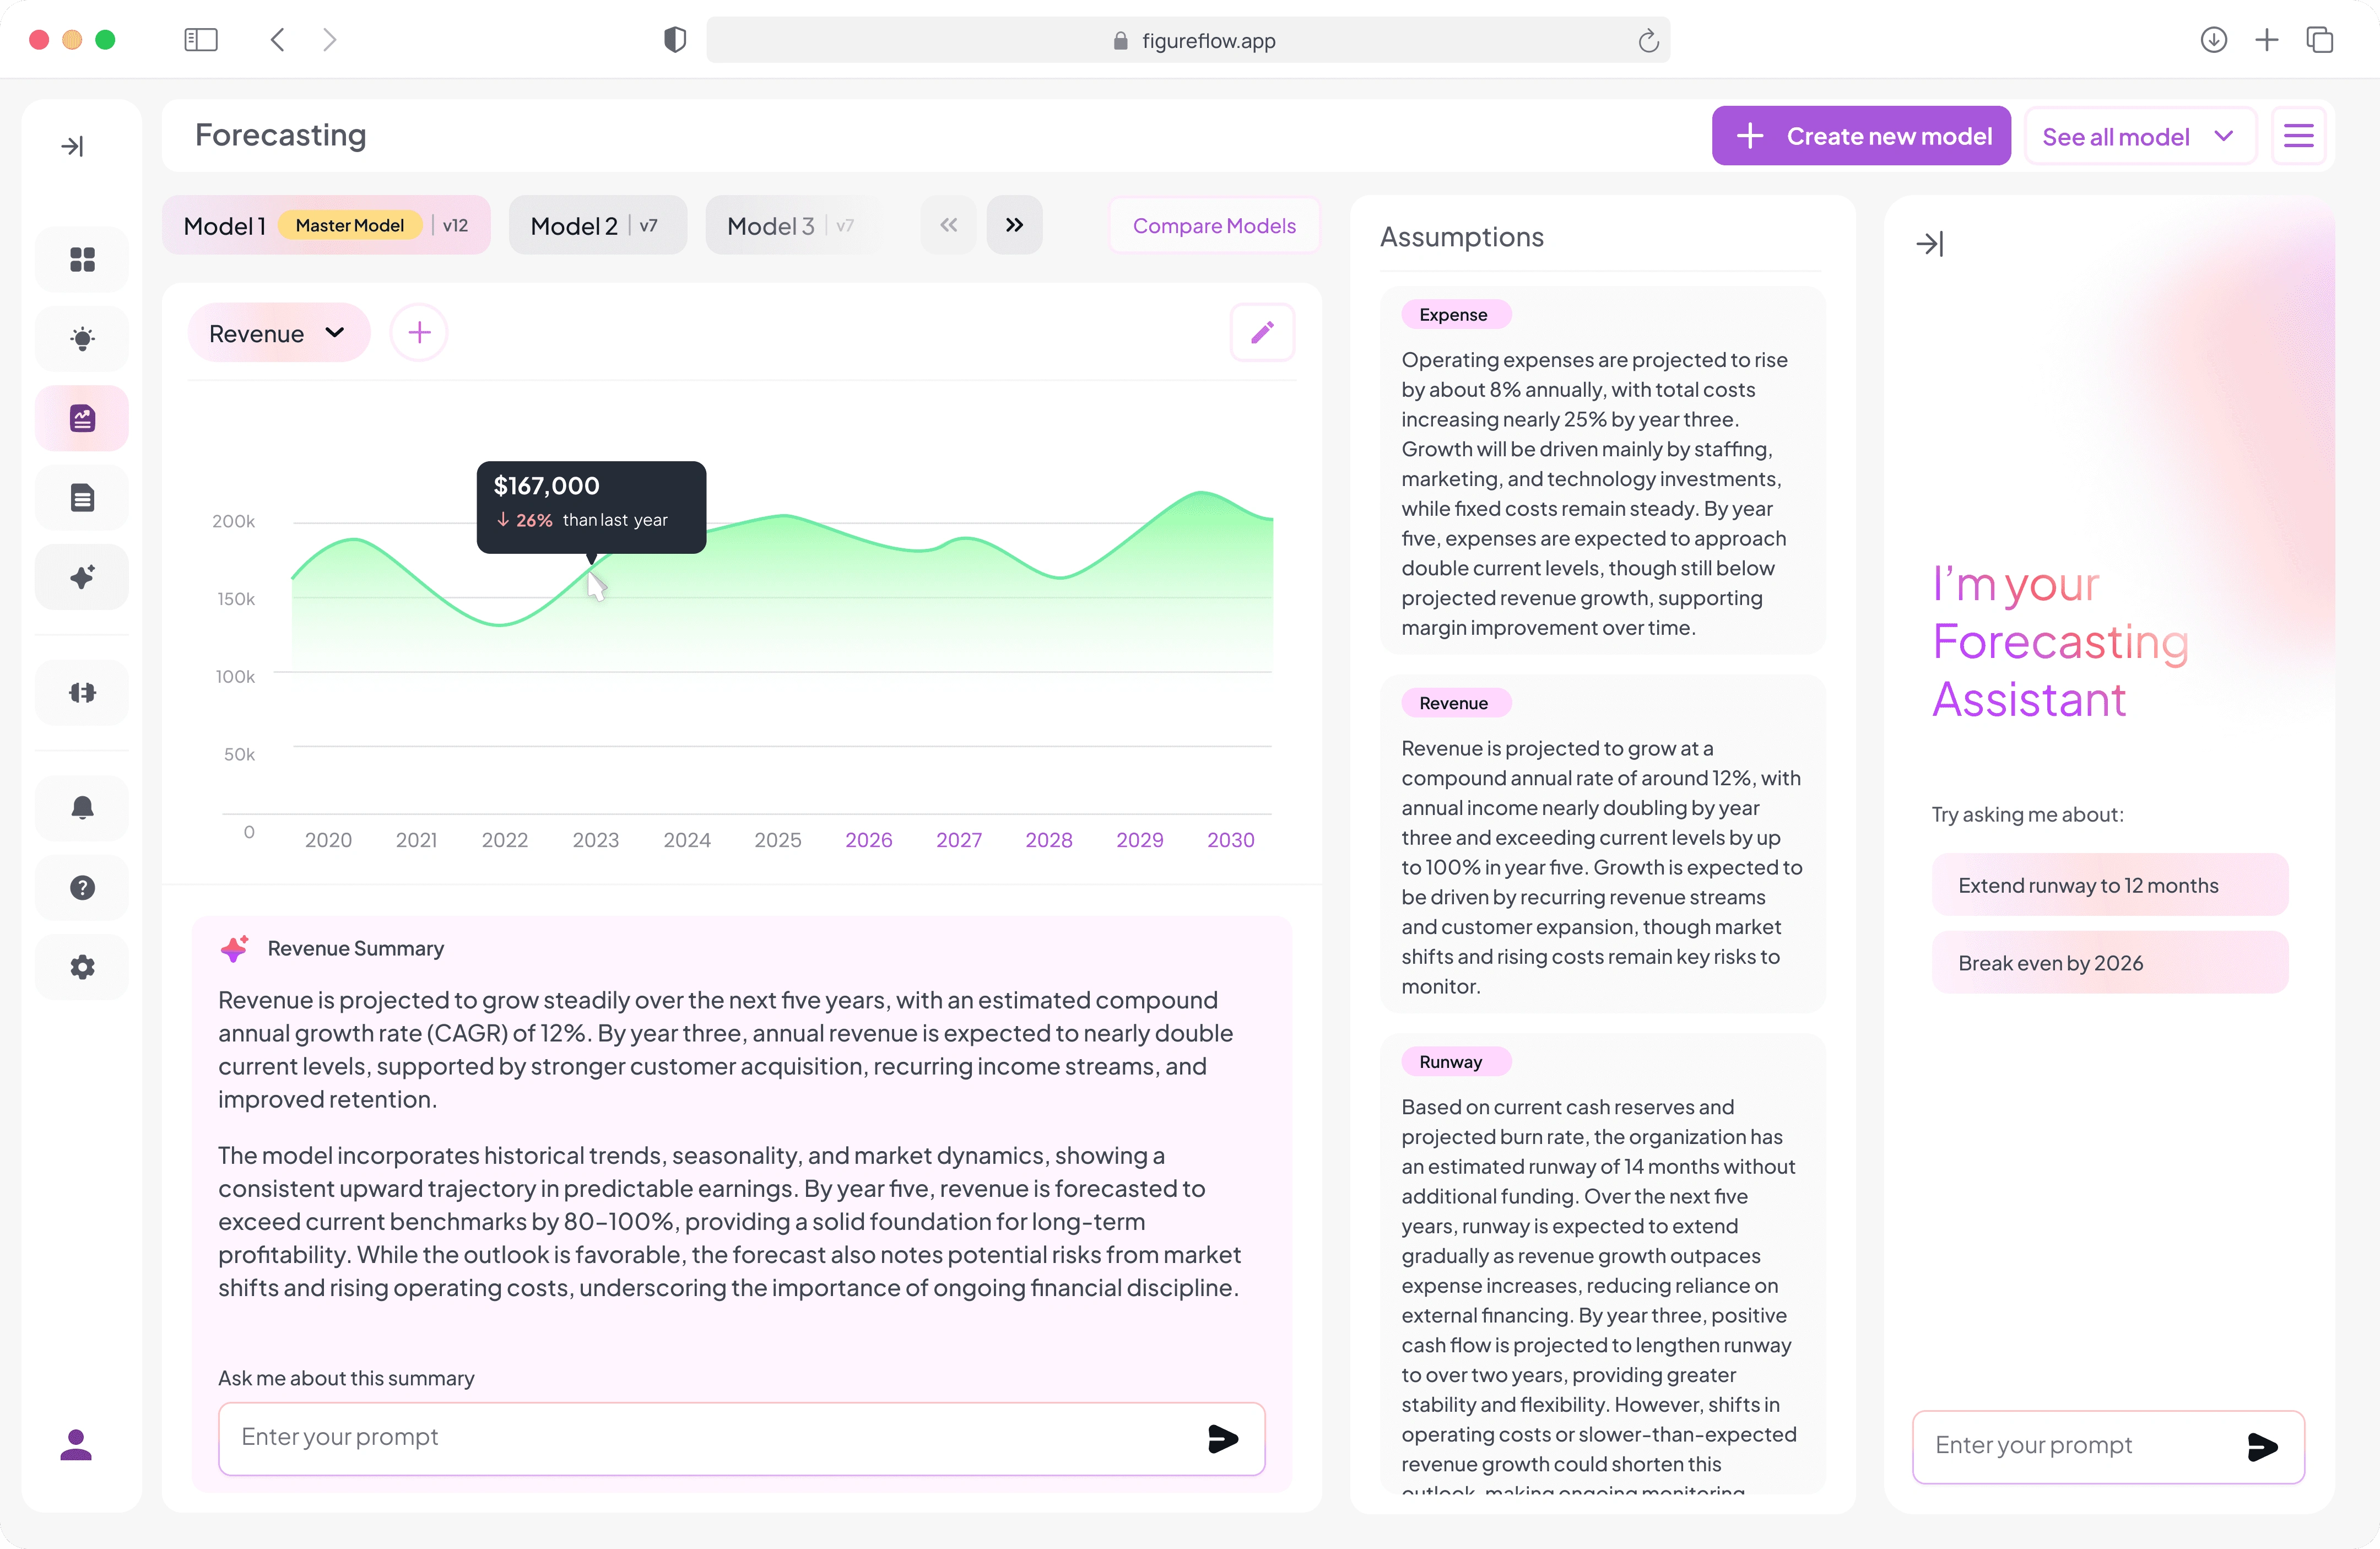
FigureFlow forecast overview
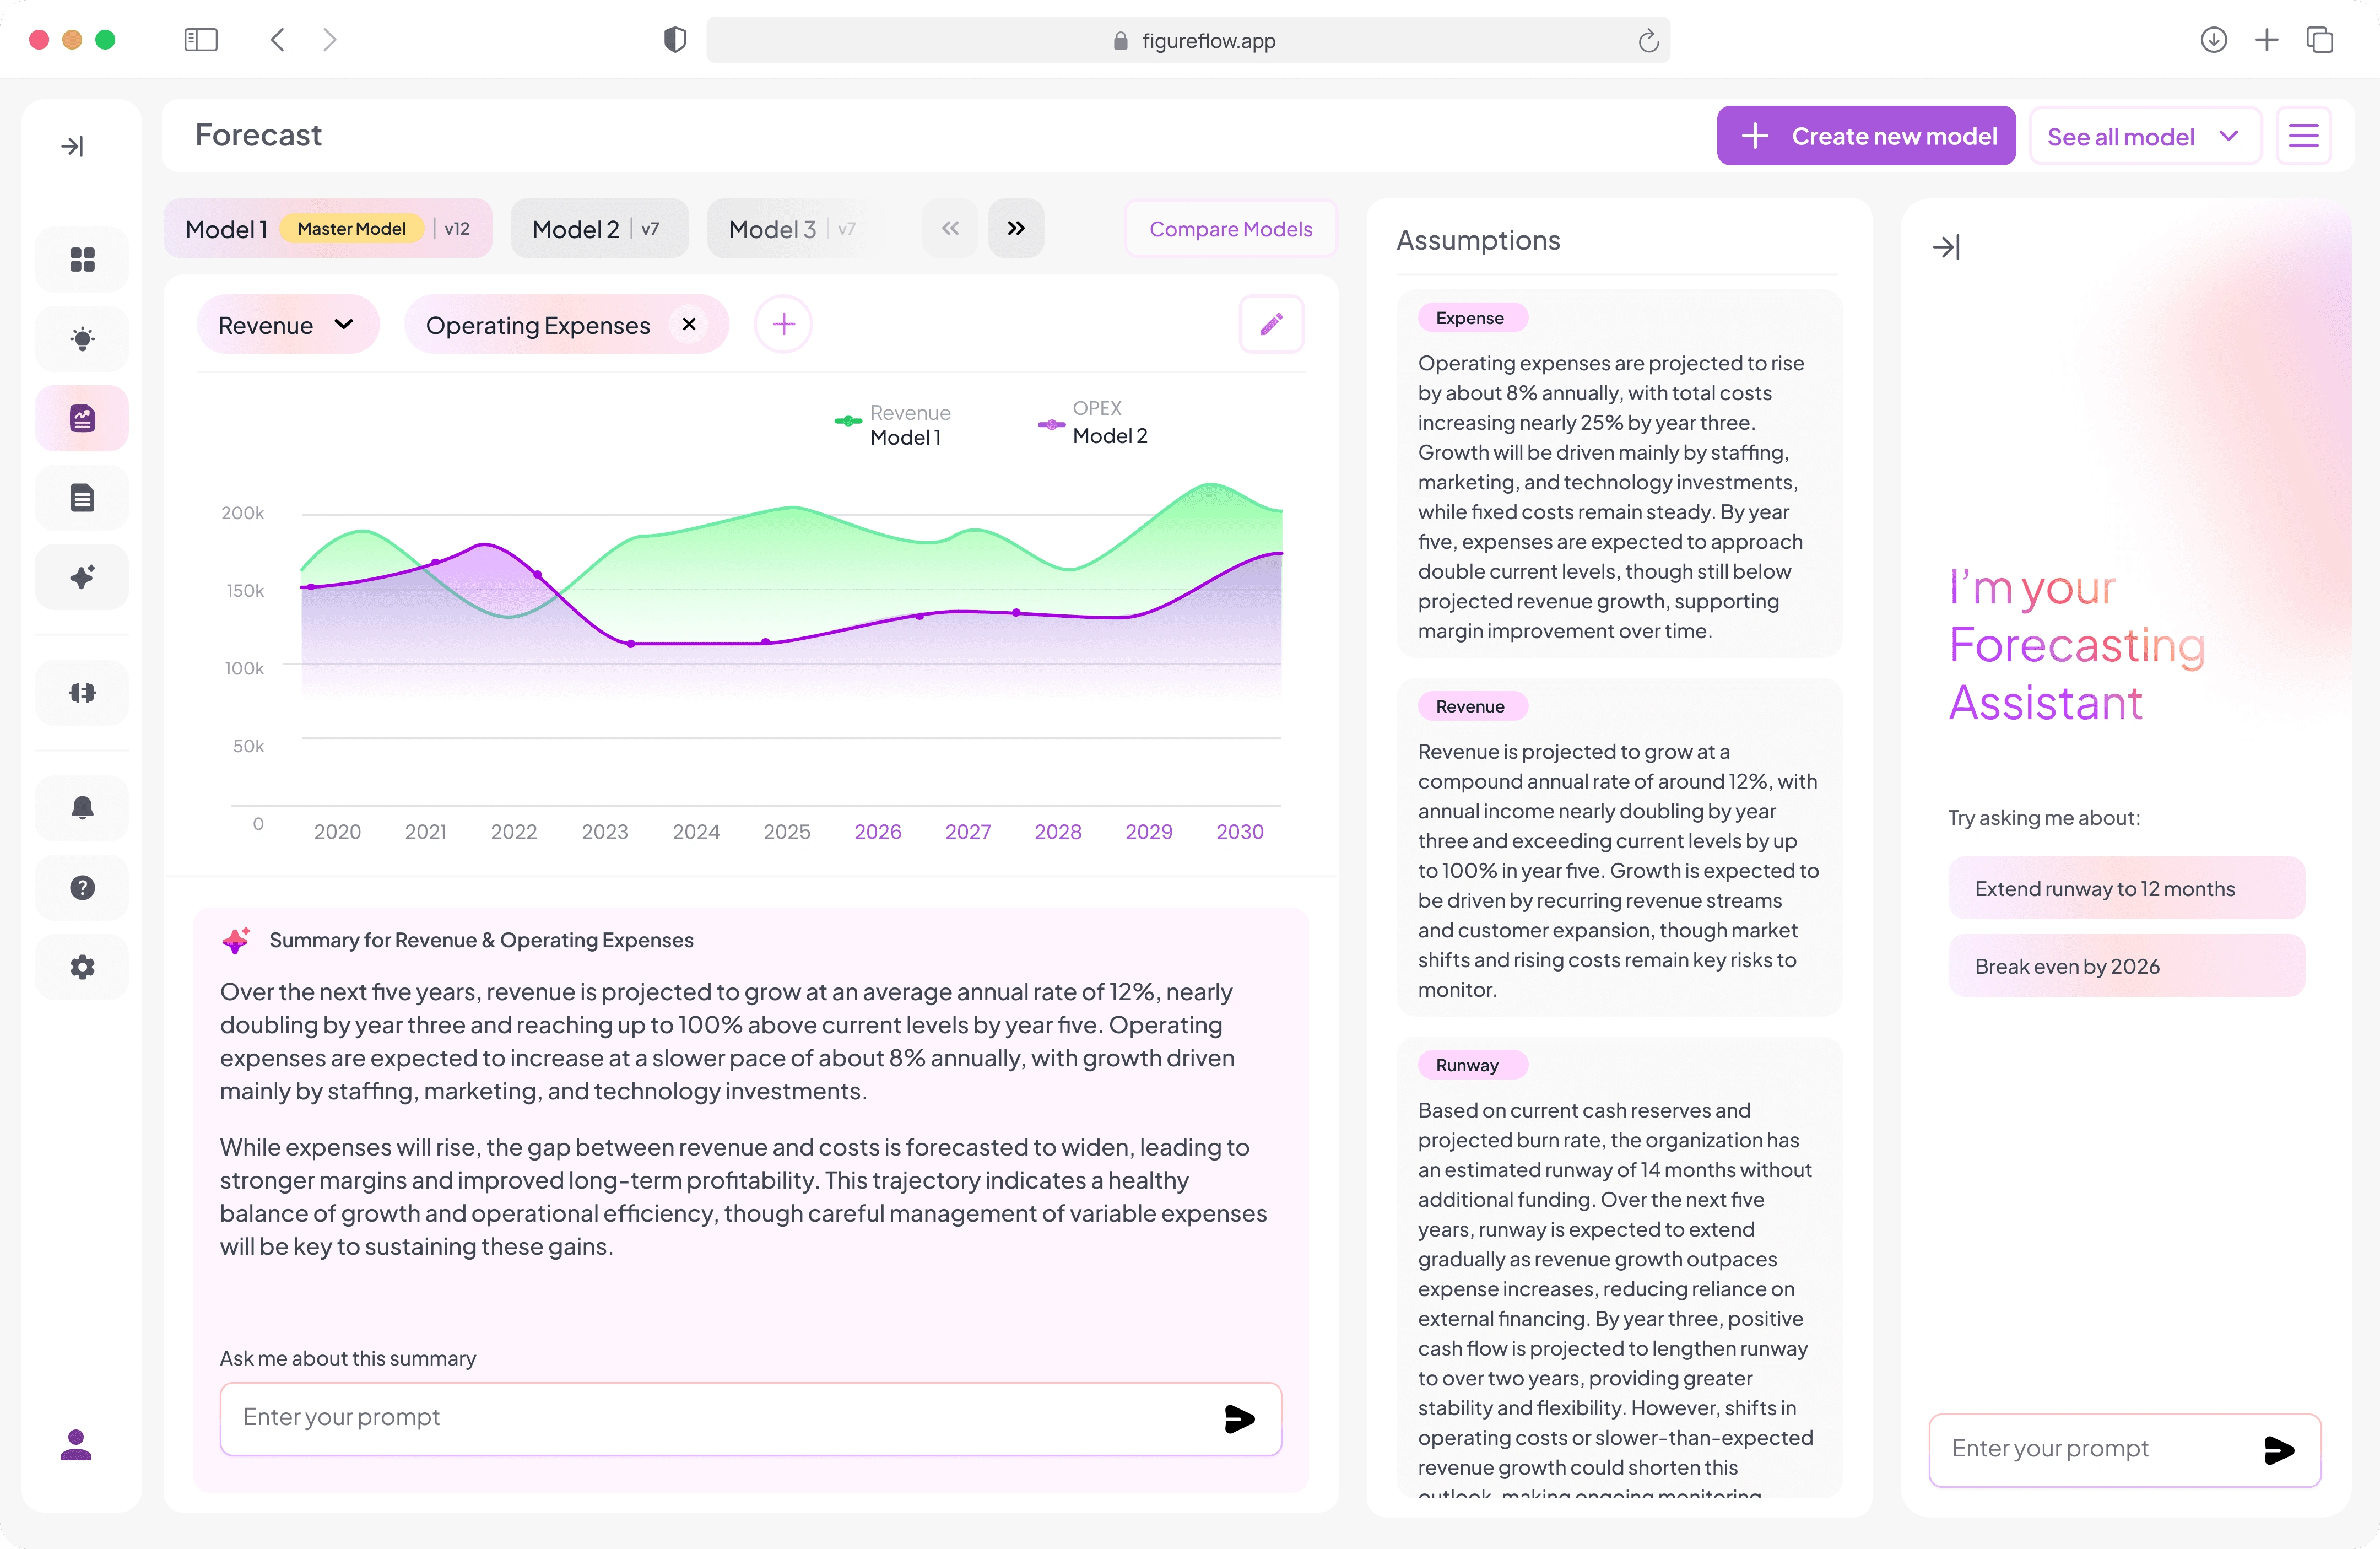
FigureFlow single metric forecast
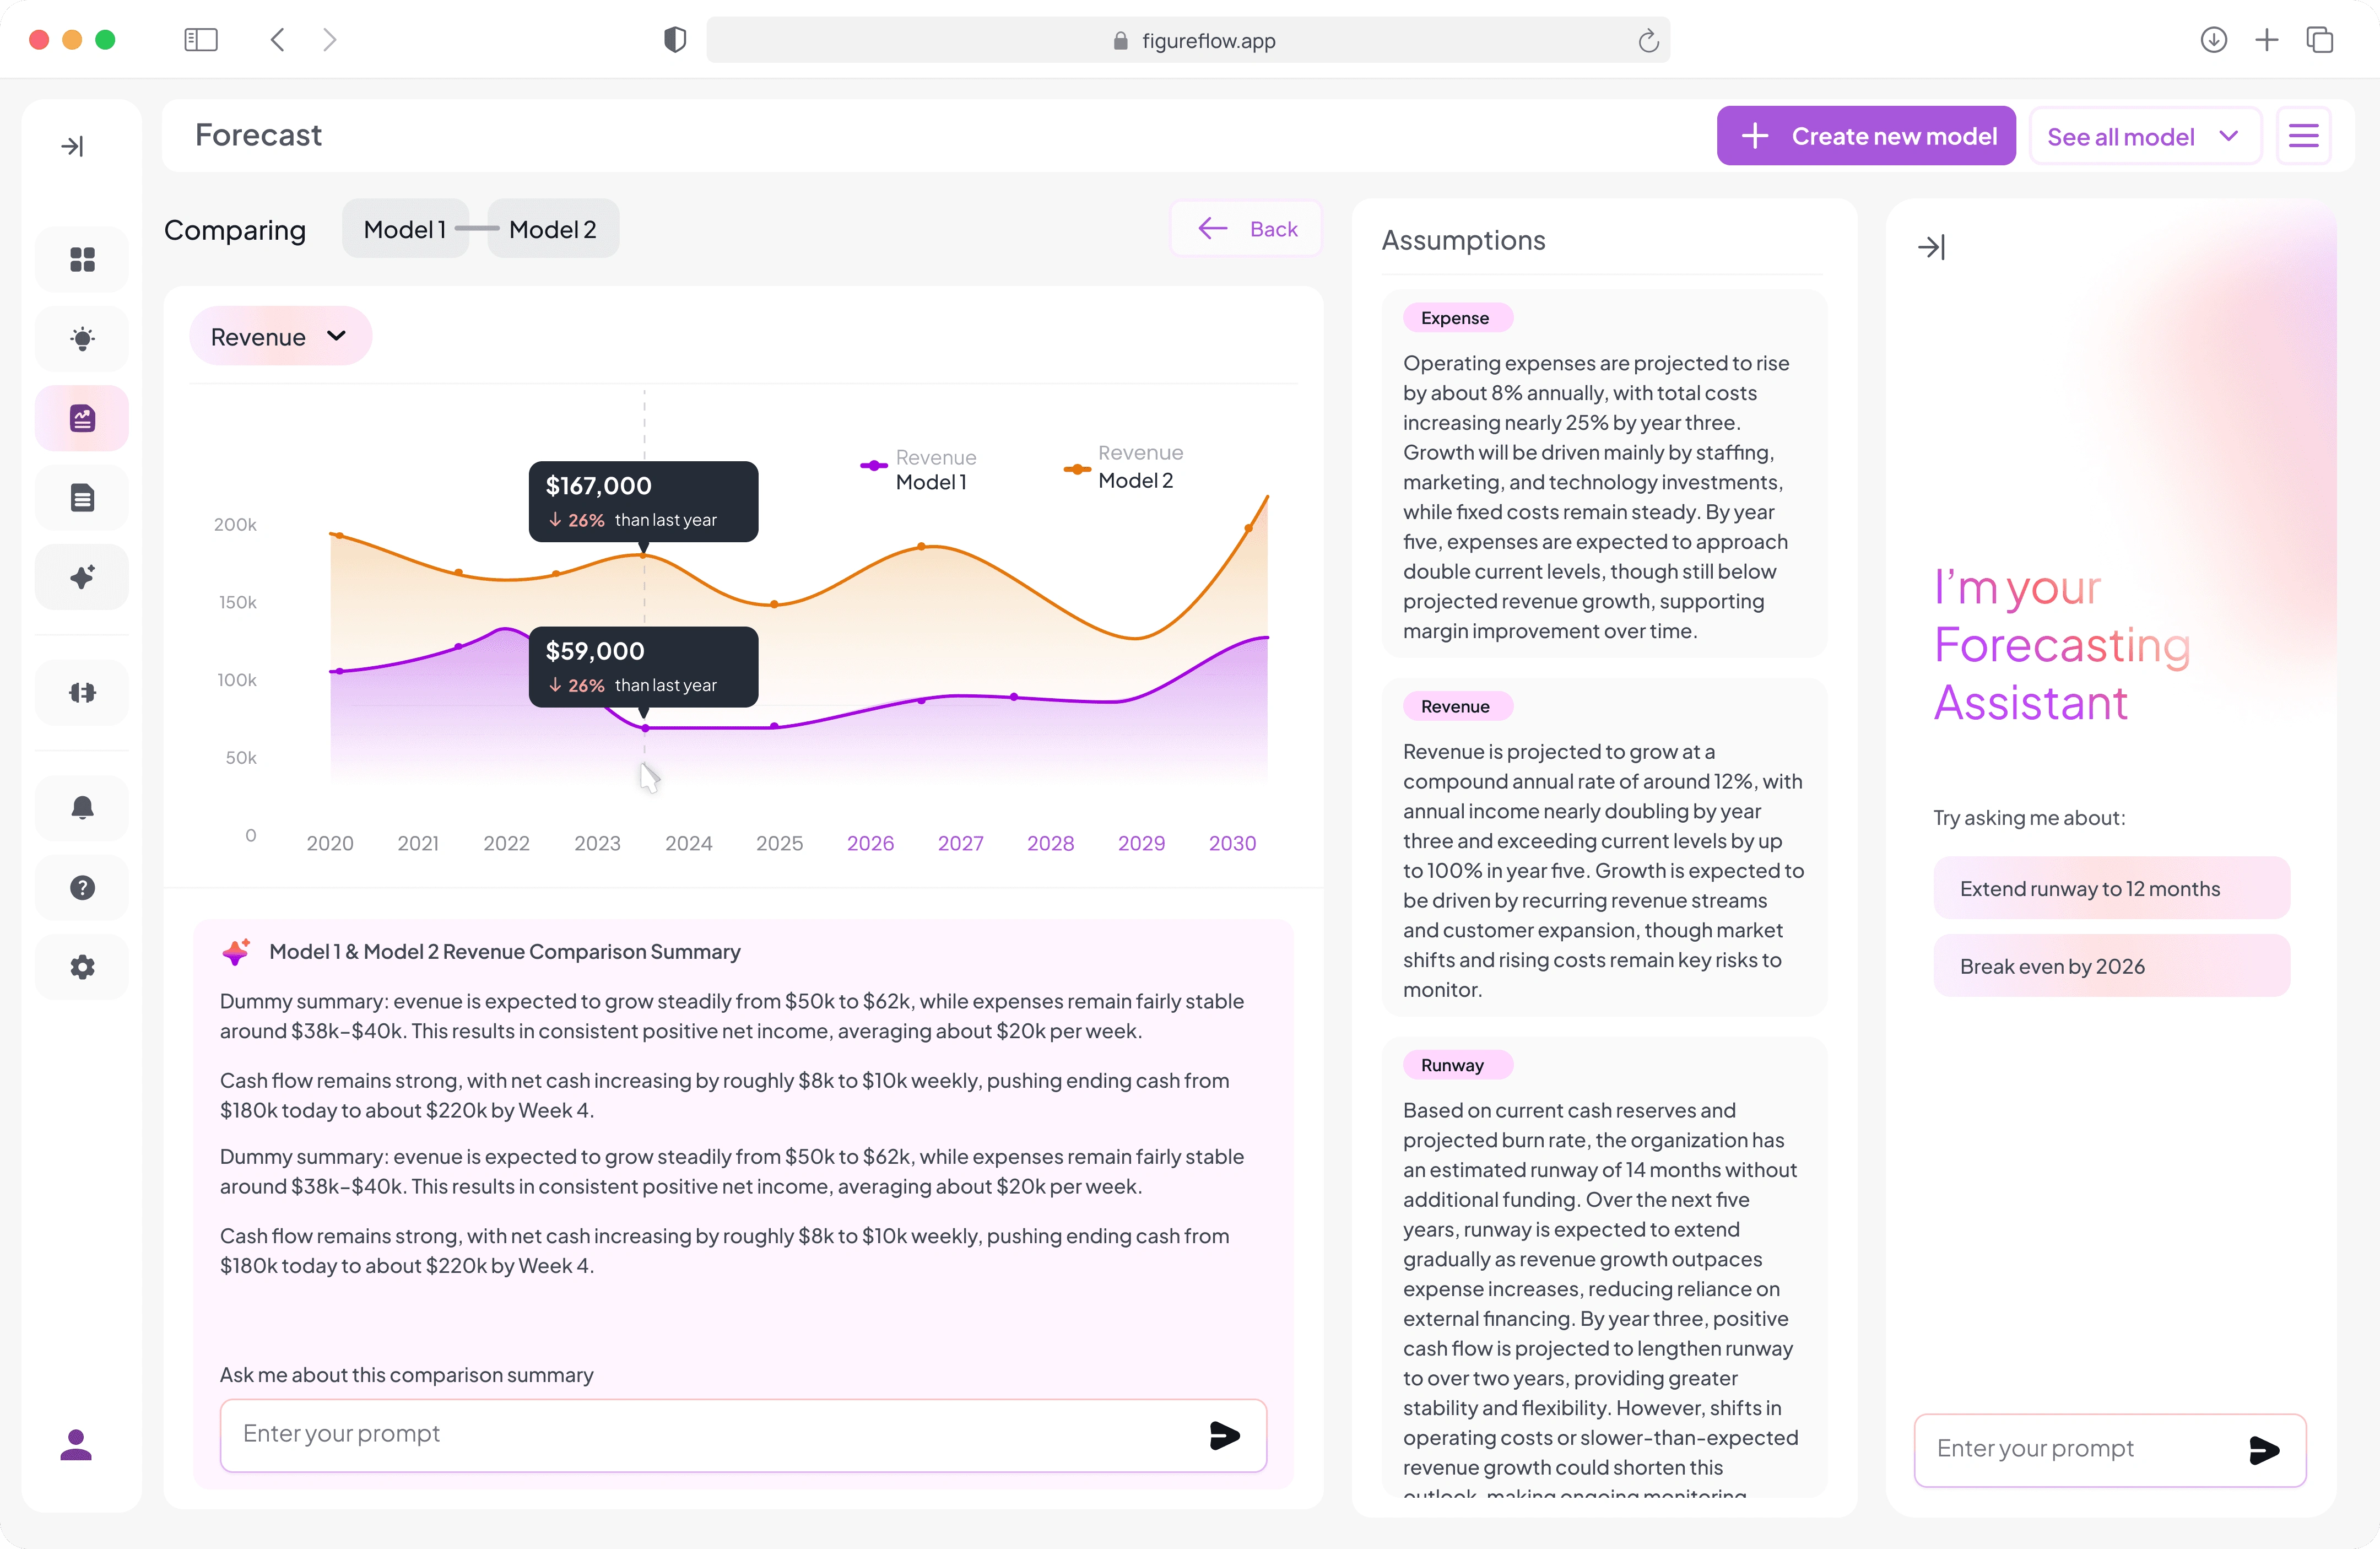
FigureFlow model comparison
The experience separates actuals from projections visually and pairs charts with plain-language AI summaries. The assumptions panel keeps key model drivers such as expense growth, revenue trajectory, and runway visible. A dedicated forecasting assistant supports goal-based prompts, including requests to extend runway or reach break-even.
The direct editor uses a spreadsheet-style interface organised by Income Statement, Balance Sheet, and Cash Flow Statement. Clear labels show what is being changed, while the Indicator Guide and Set Budget tools support decision-making.
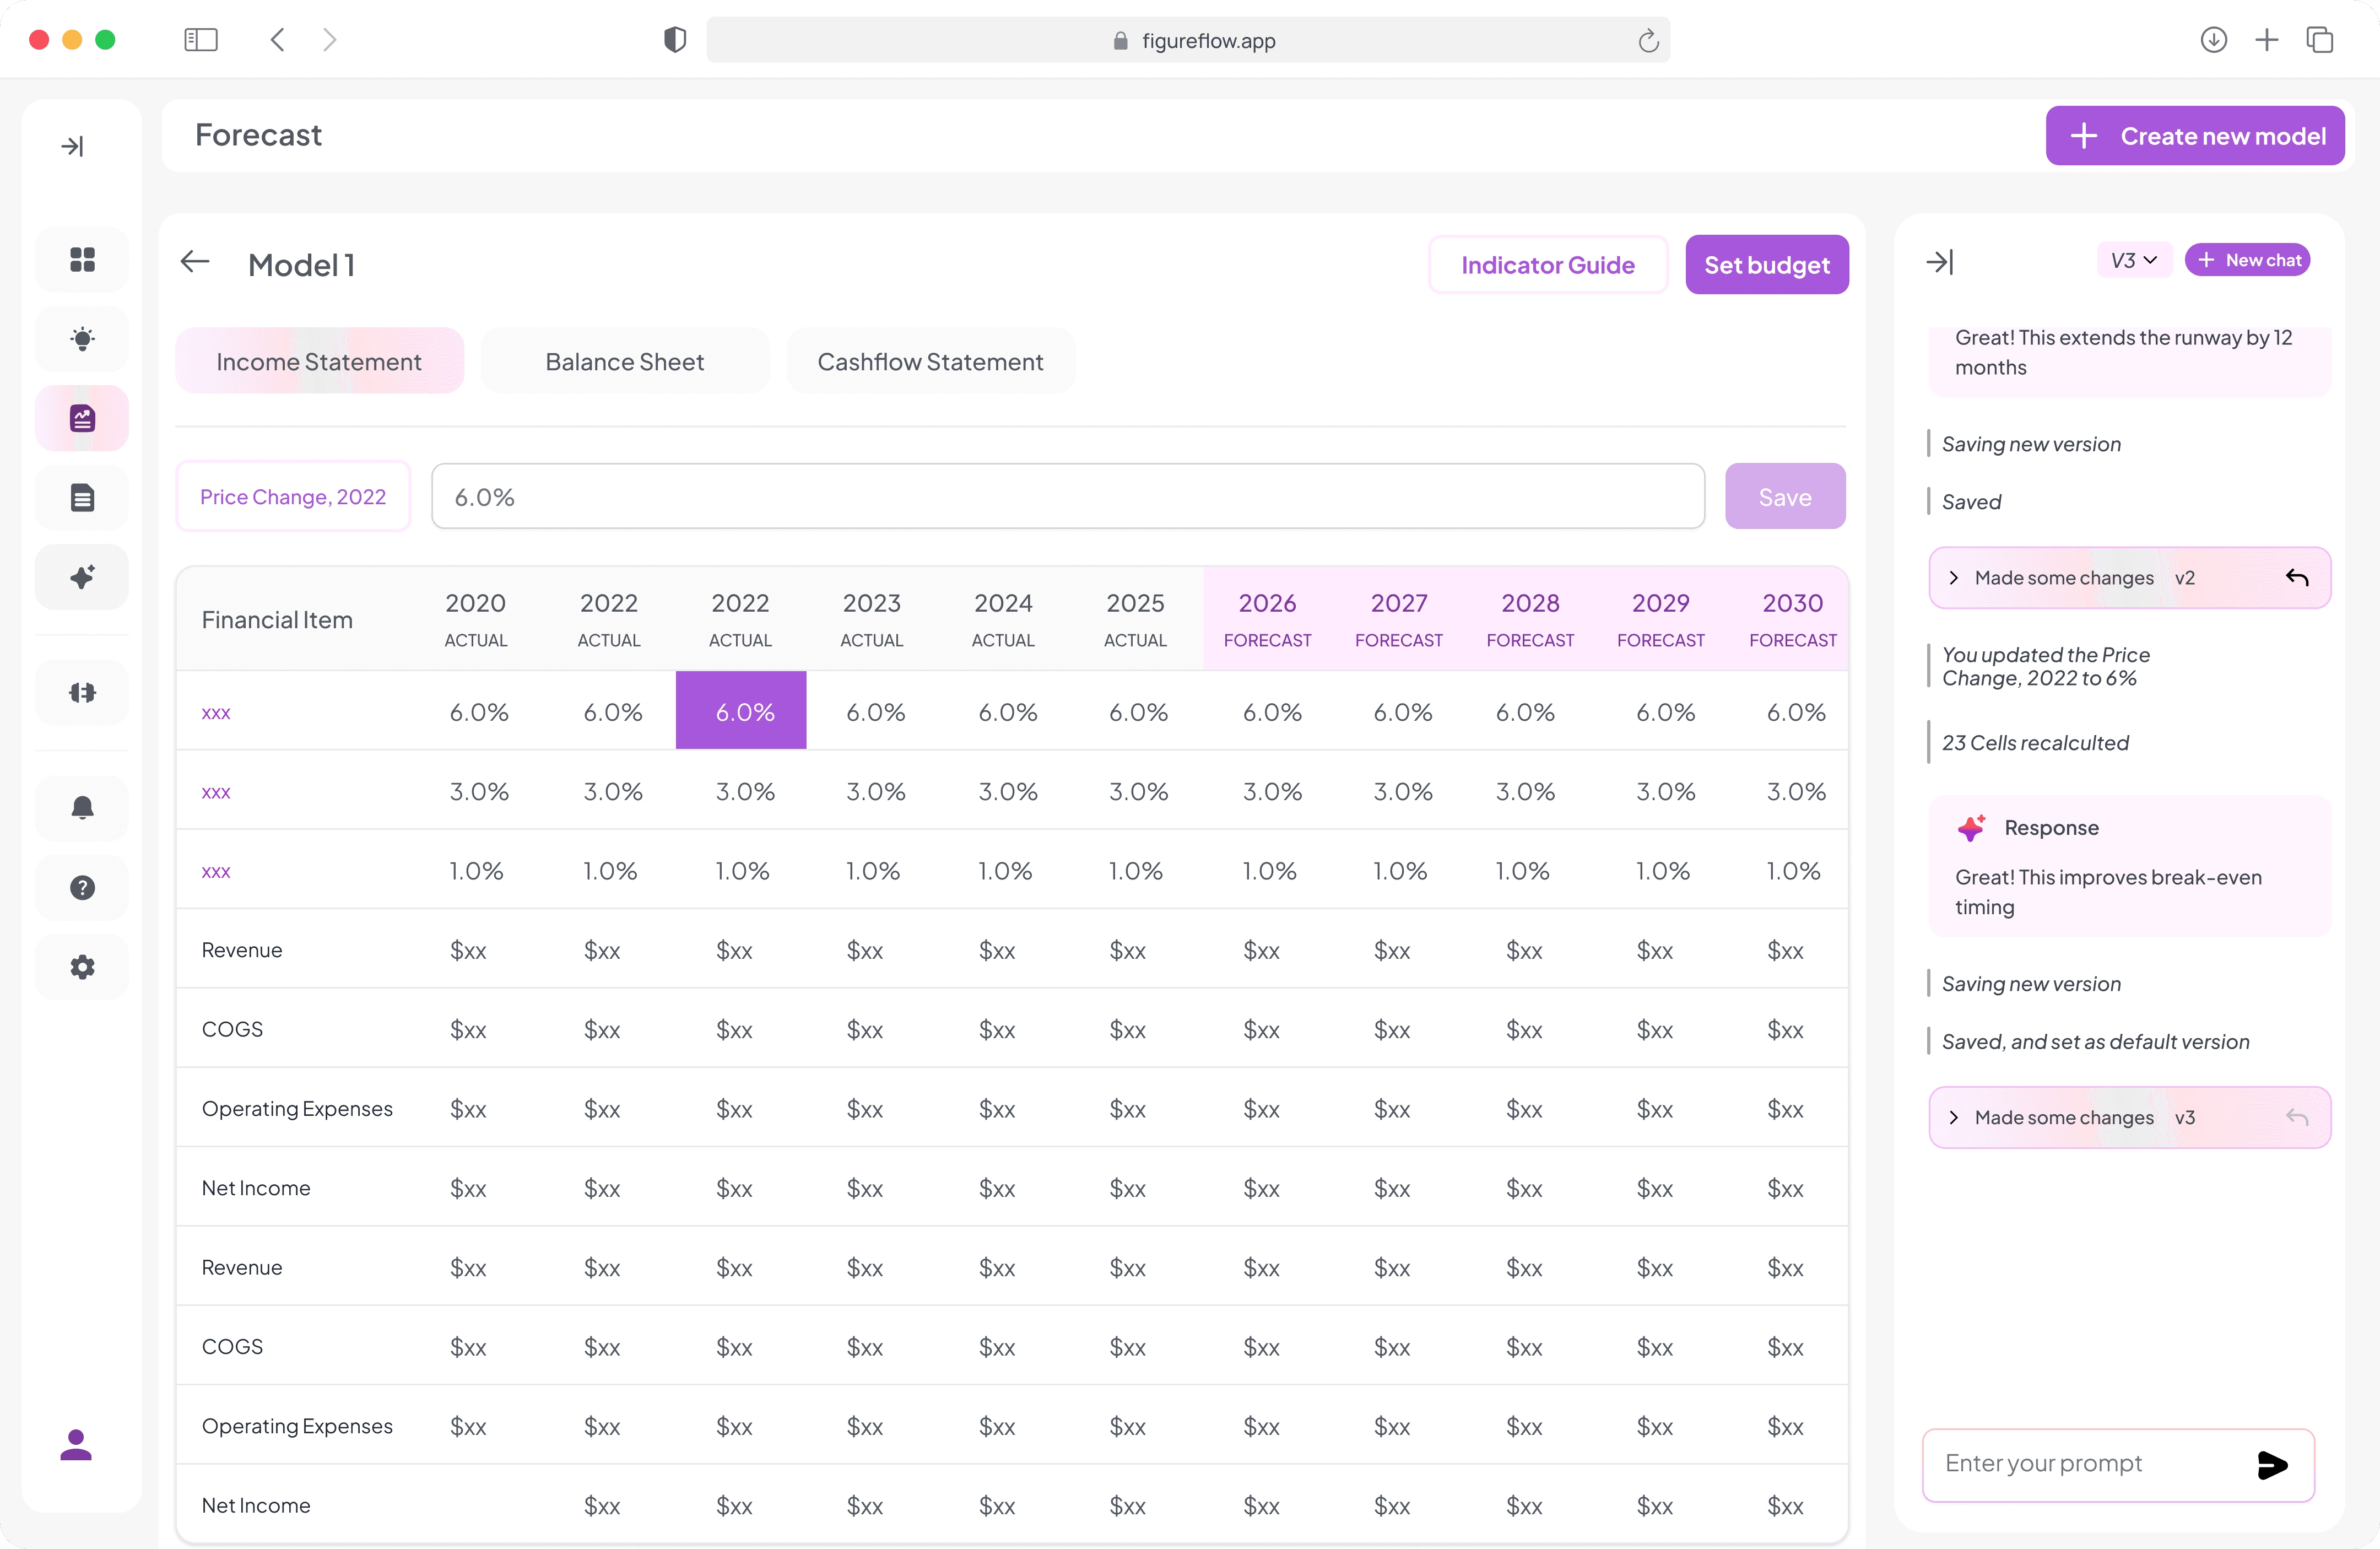
FigureFlow direct forecast editor
Each save creates a version and change log. After edits, the AI explains the potential effect on break-even, cash flow, or margins, and users can ask follow-up questions without working directly in cells.
Reports, data sources, and operations
Reports help users generate board-ready documents, including annual reports, investor updates, and board decks, using live platform data. Templates can be customised, shared, or exported securely.
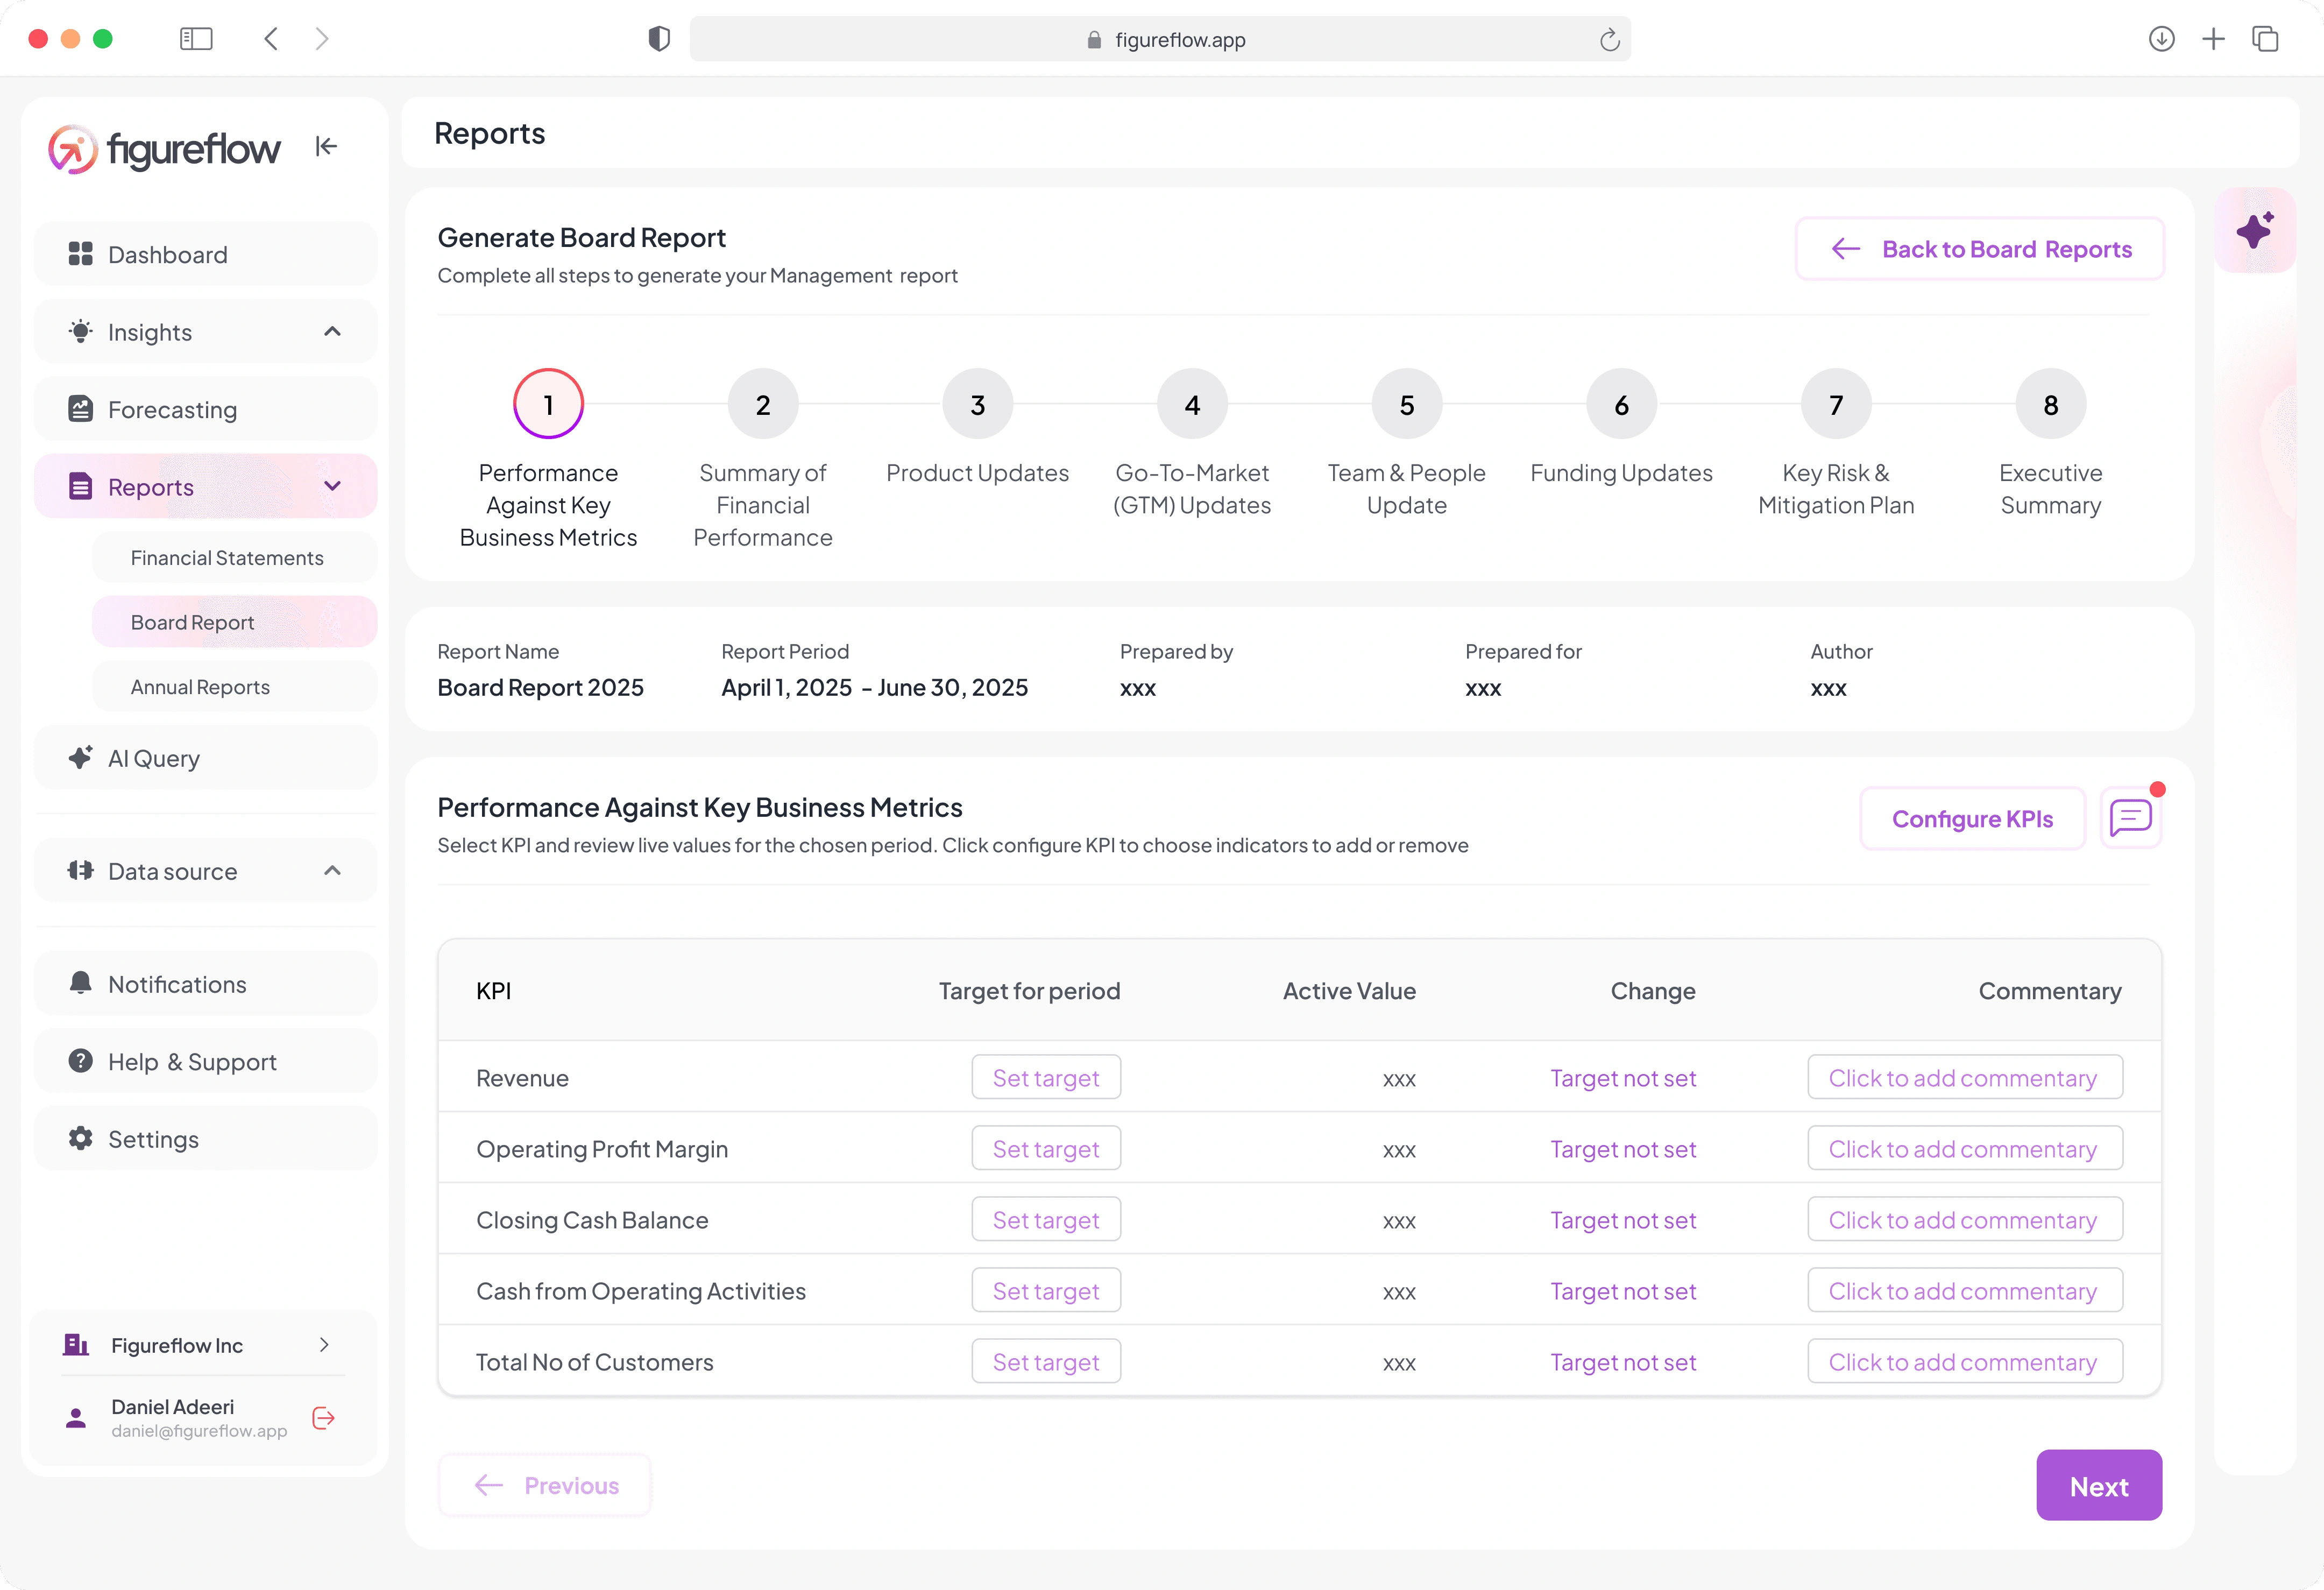
FigureFlow reports
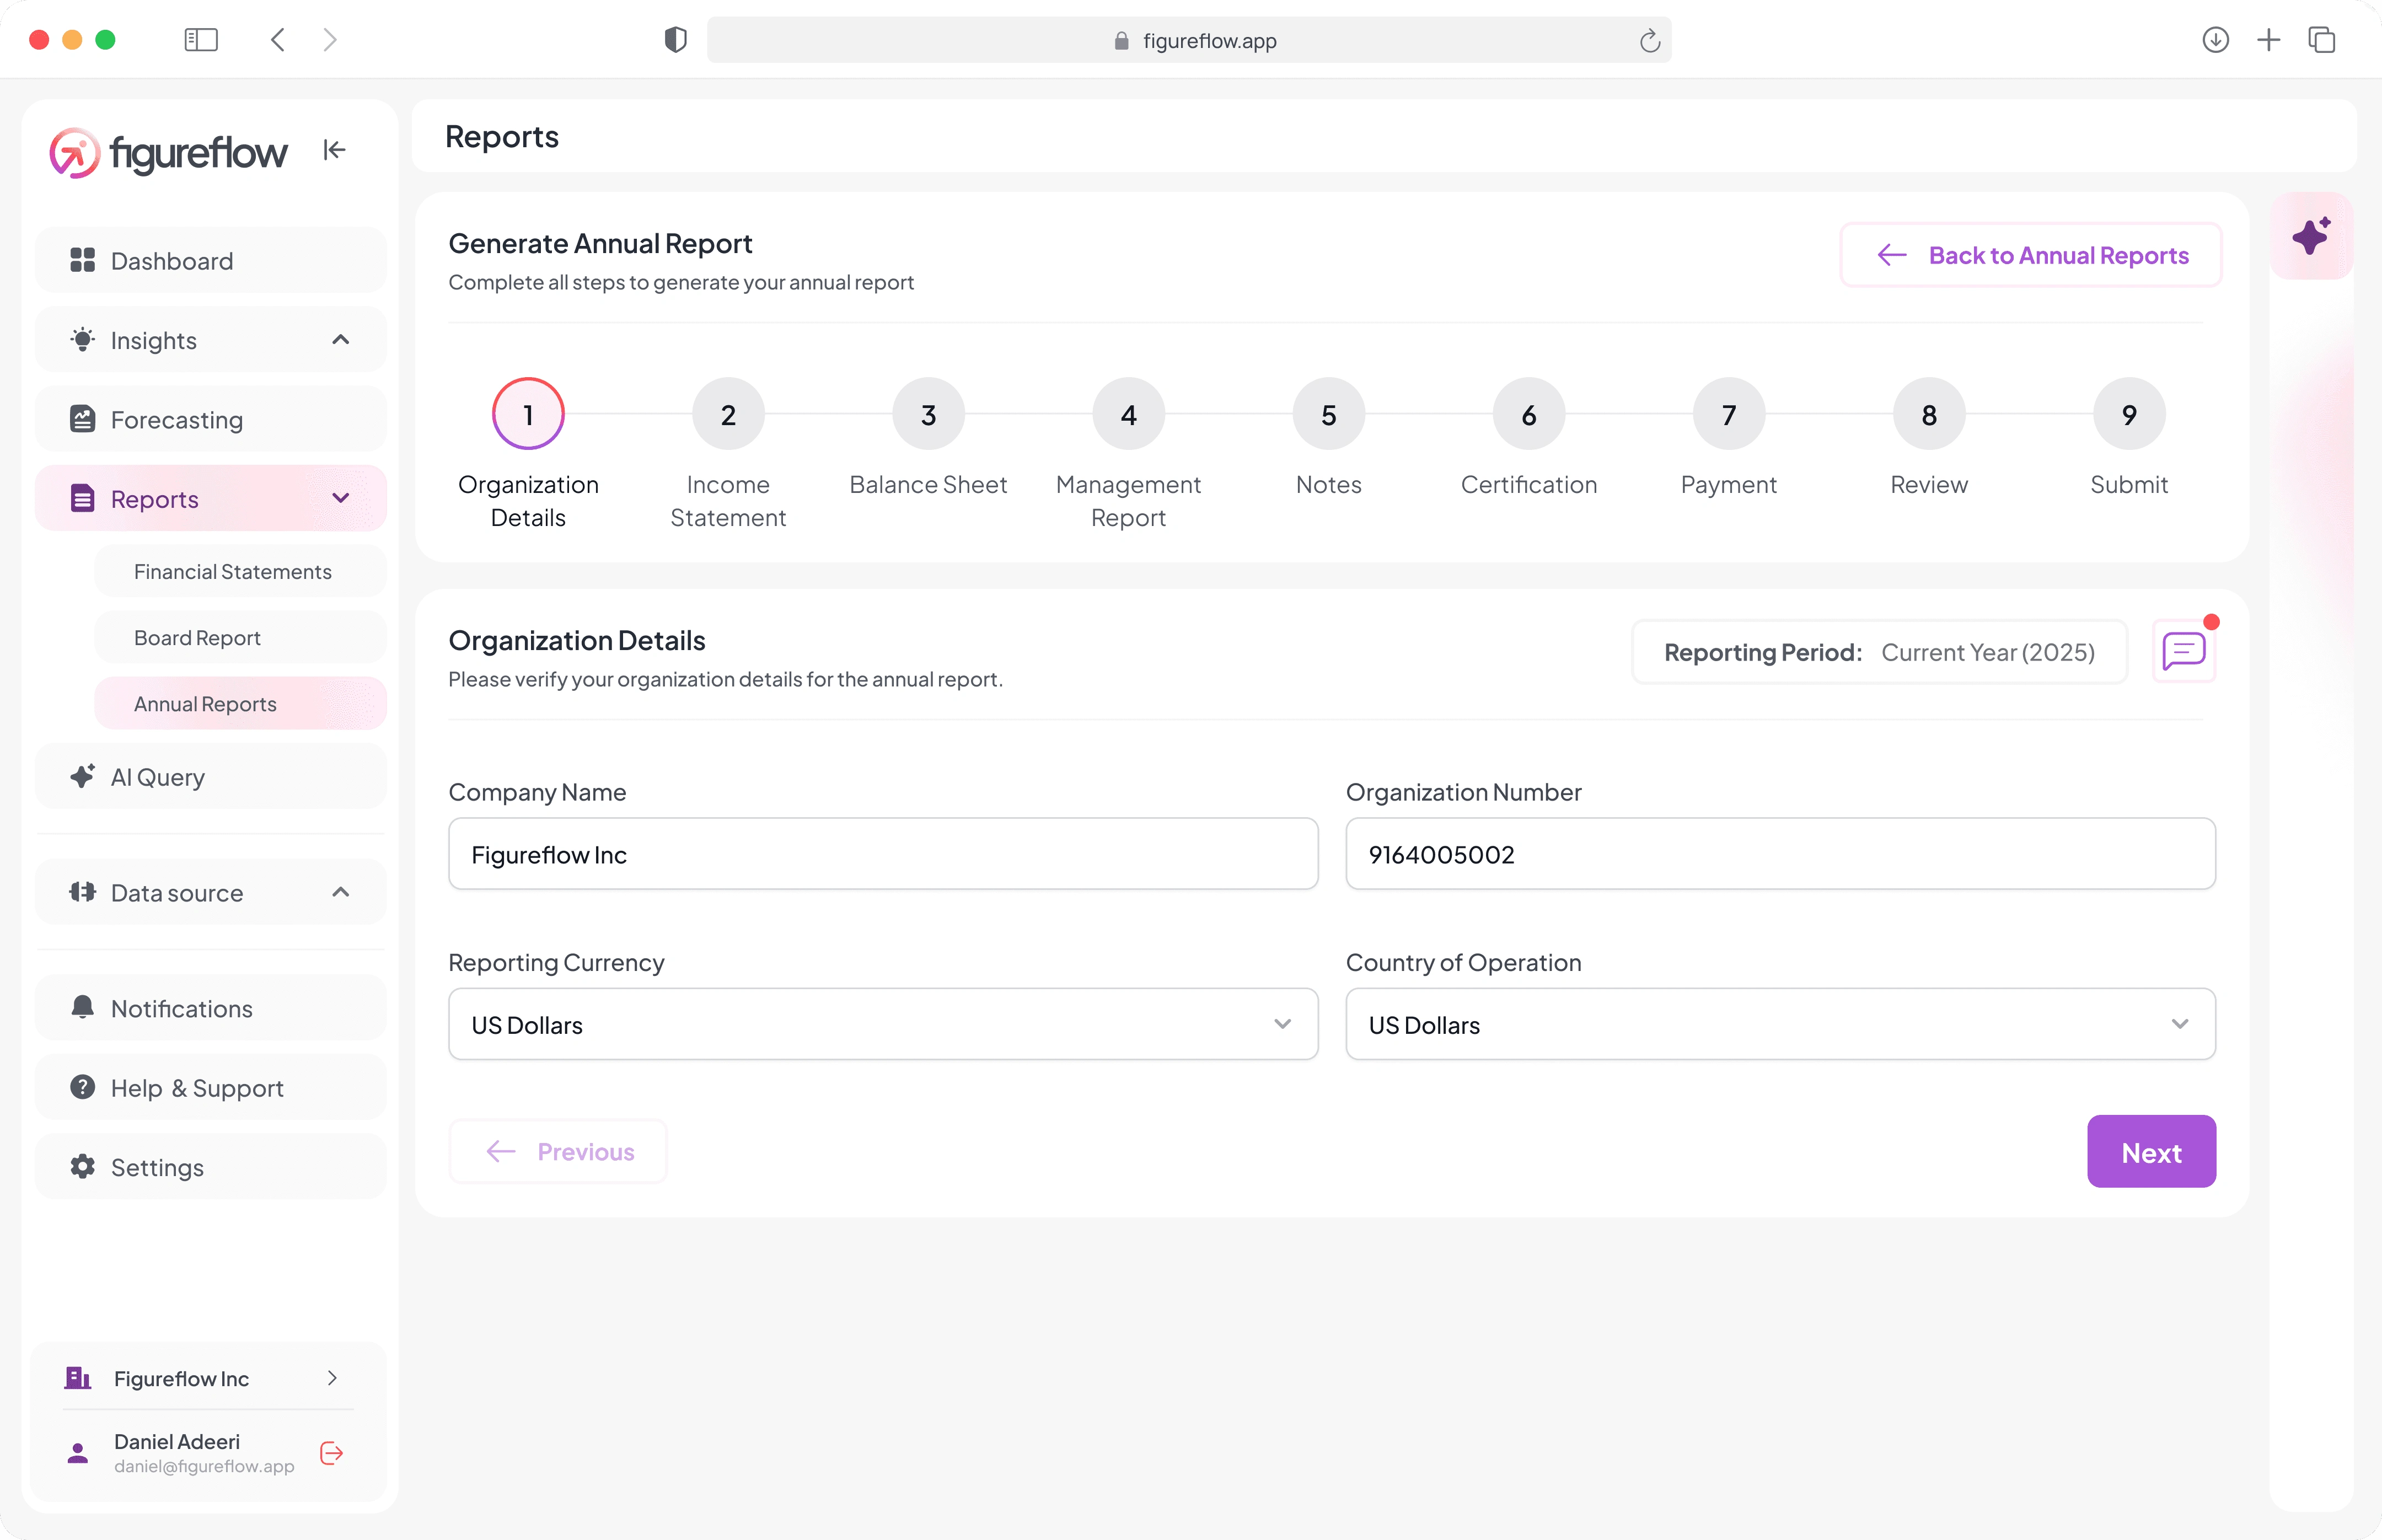
FigureFlow report editor
Data Sources is where users connect ERPs, banking platforms, accounting tools, or uploaded files. Once connected, data stays in sync so insights, forecasts, and reports are grounded in current information.
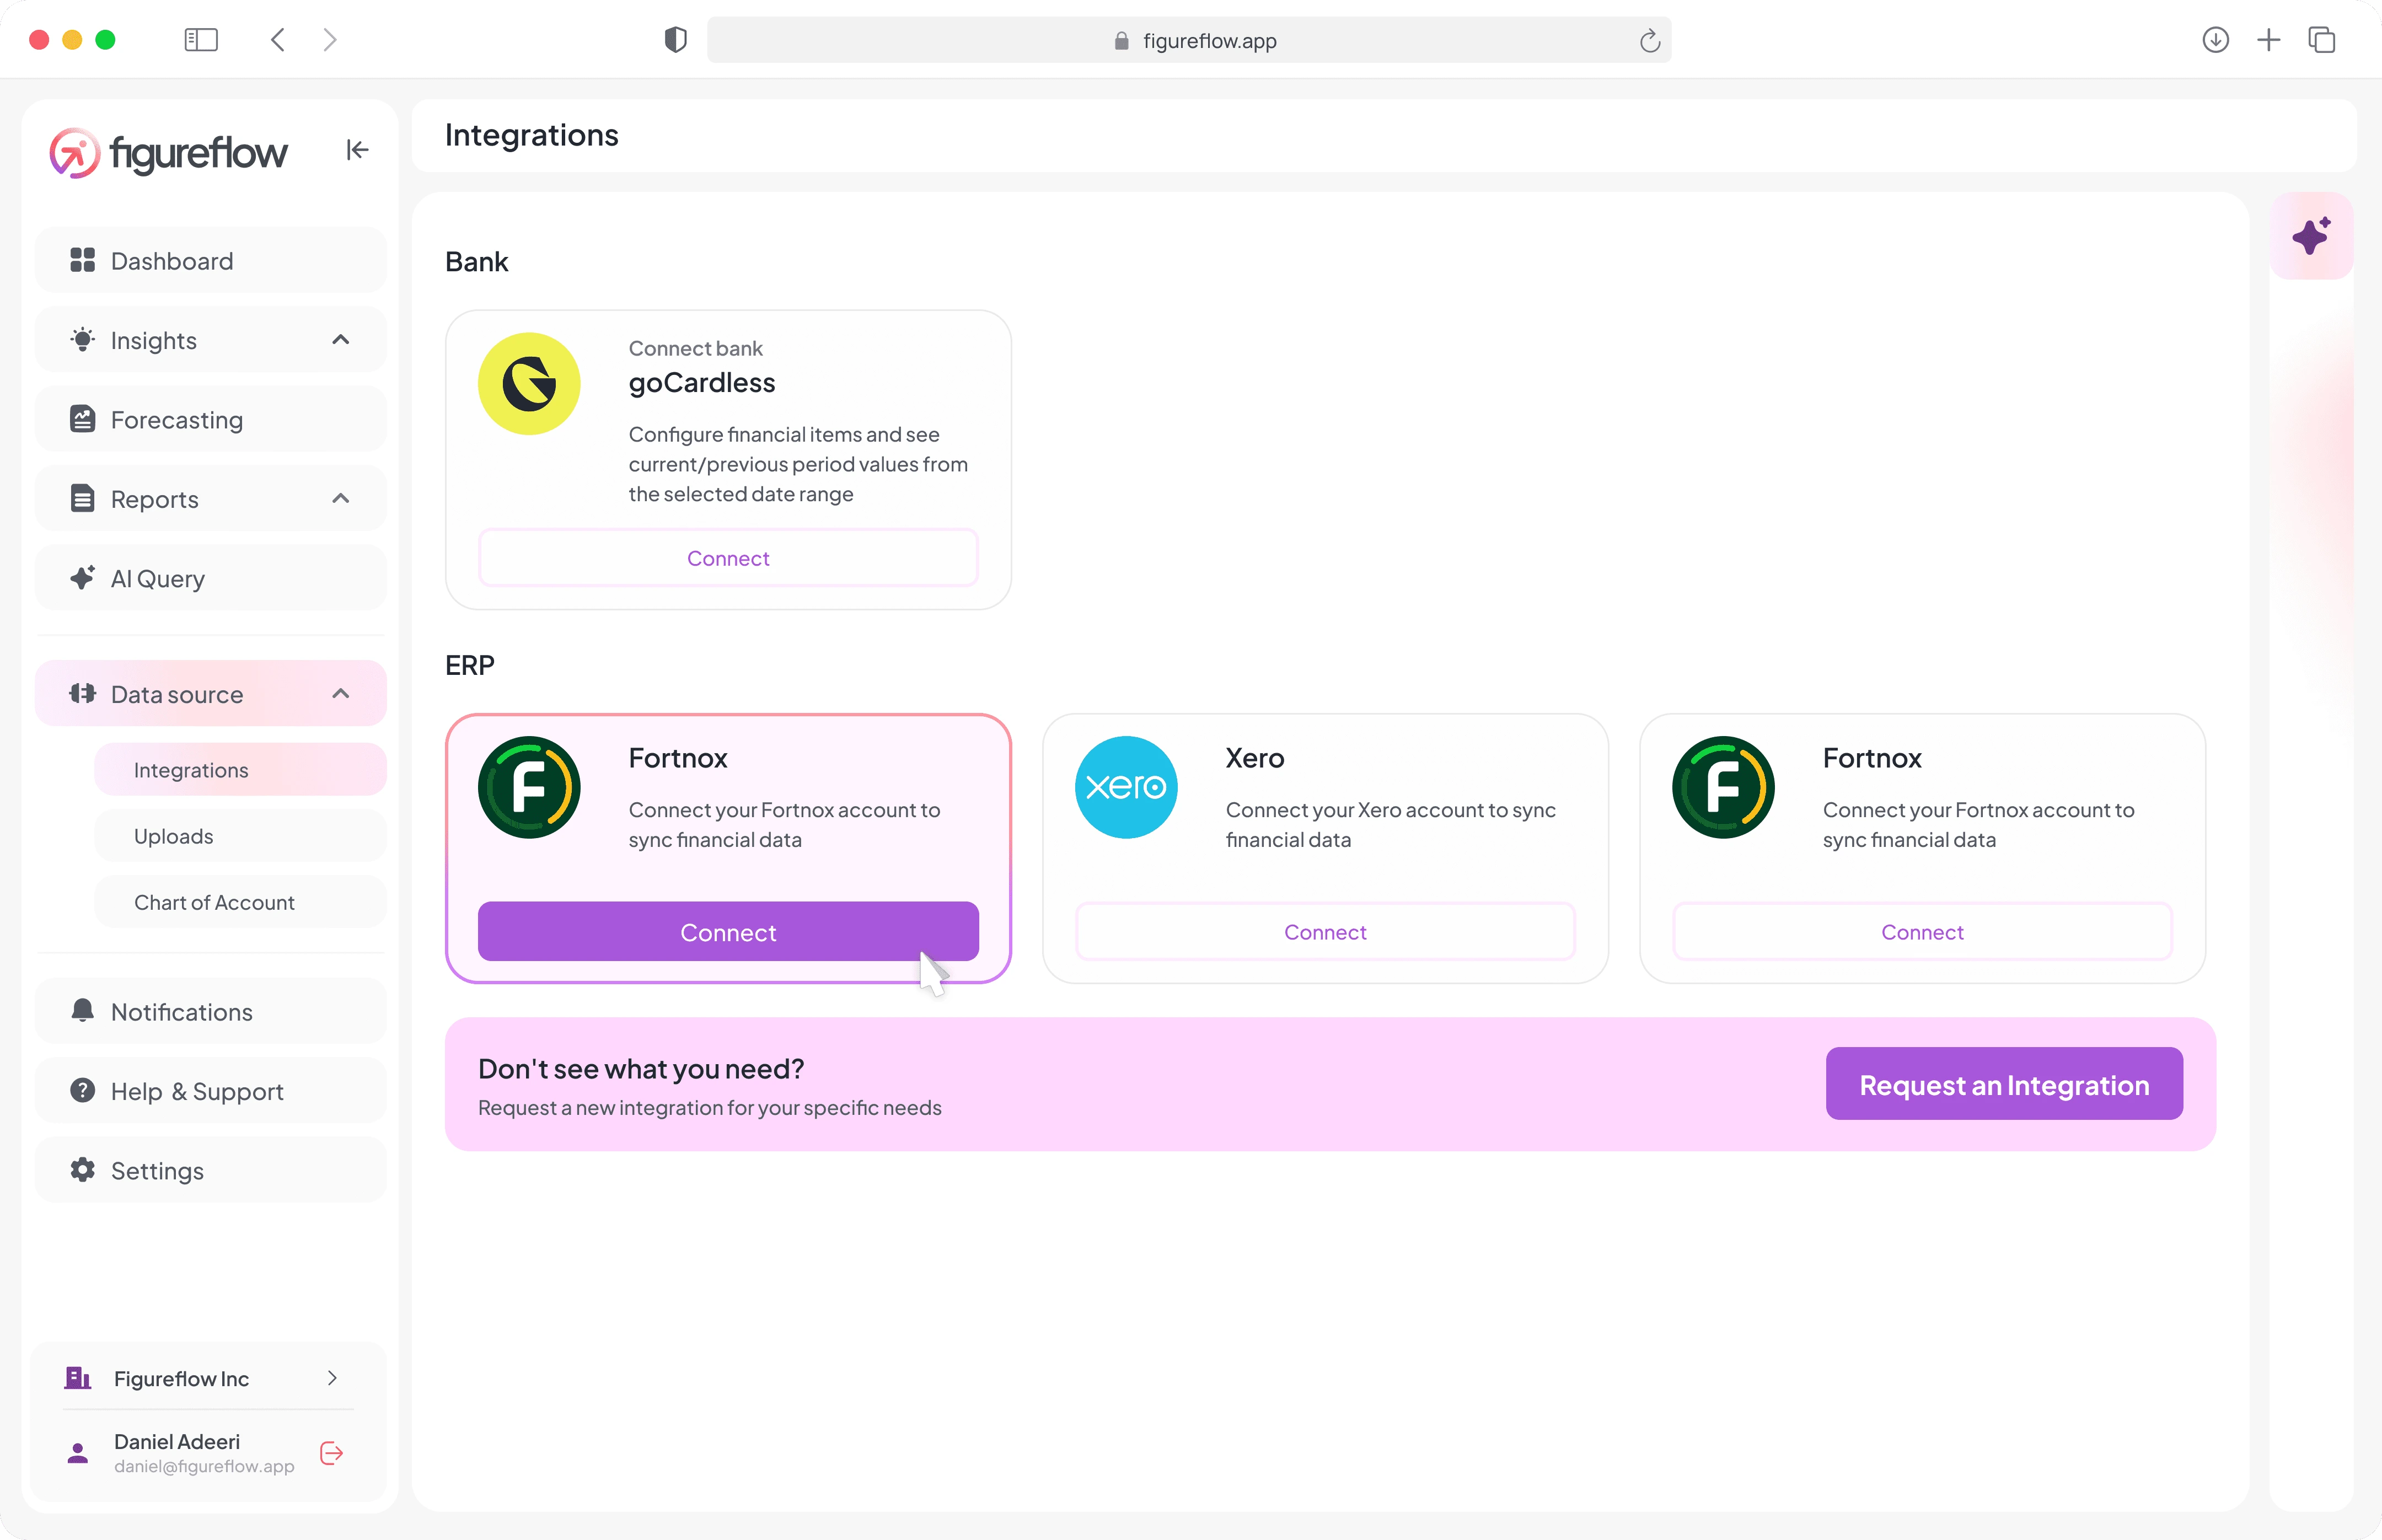
FigureFlow data sources
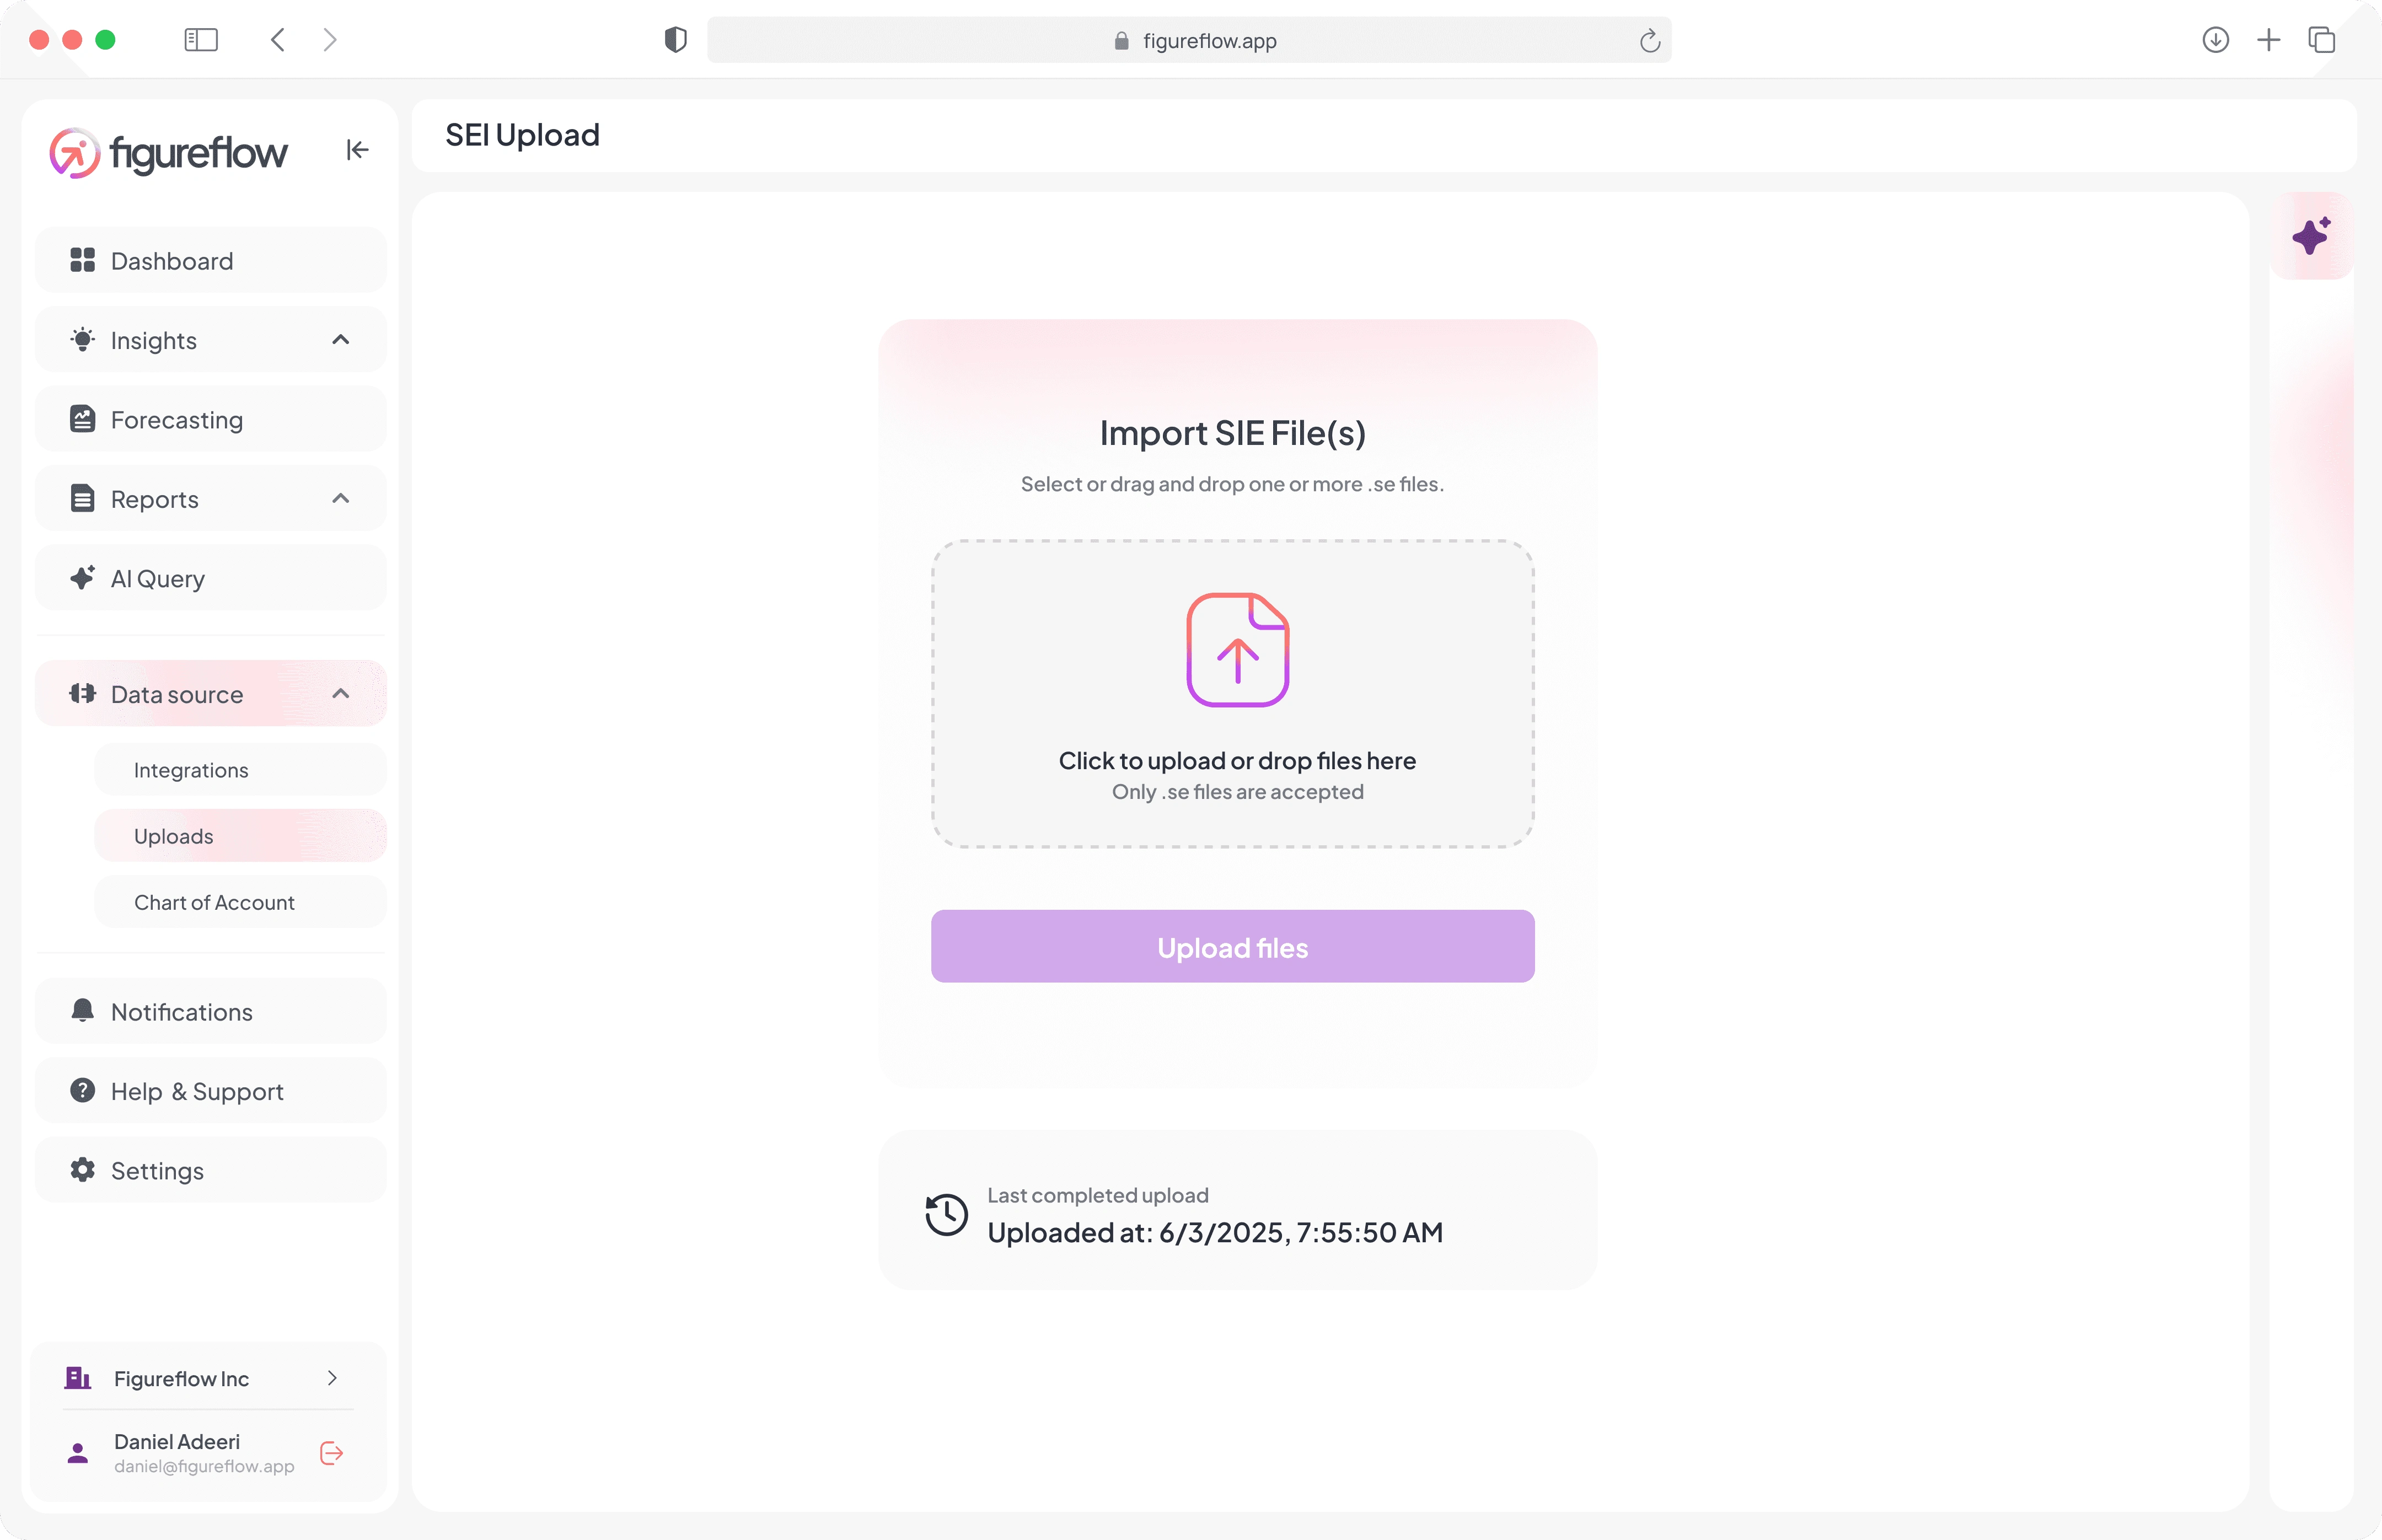
FigureFlow data connection flow
Notifications surface budget thresholds, forecast changes, report completions, and other events that need attention without overwhelming the user.
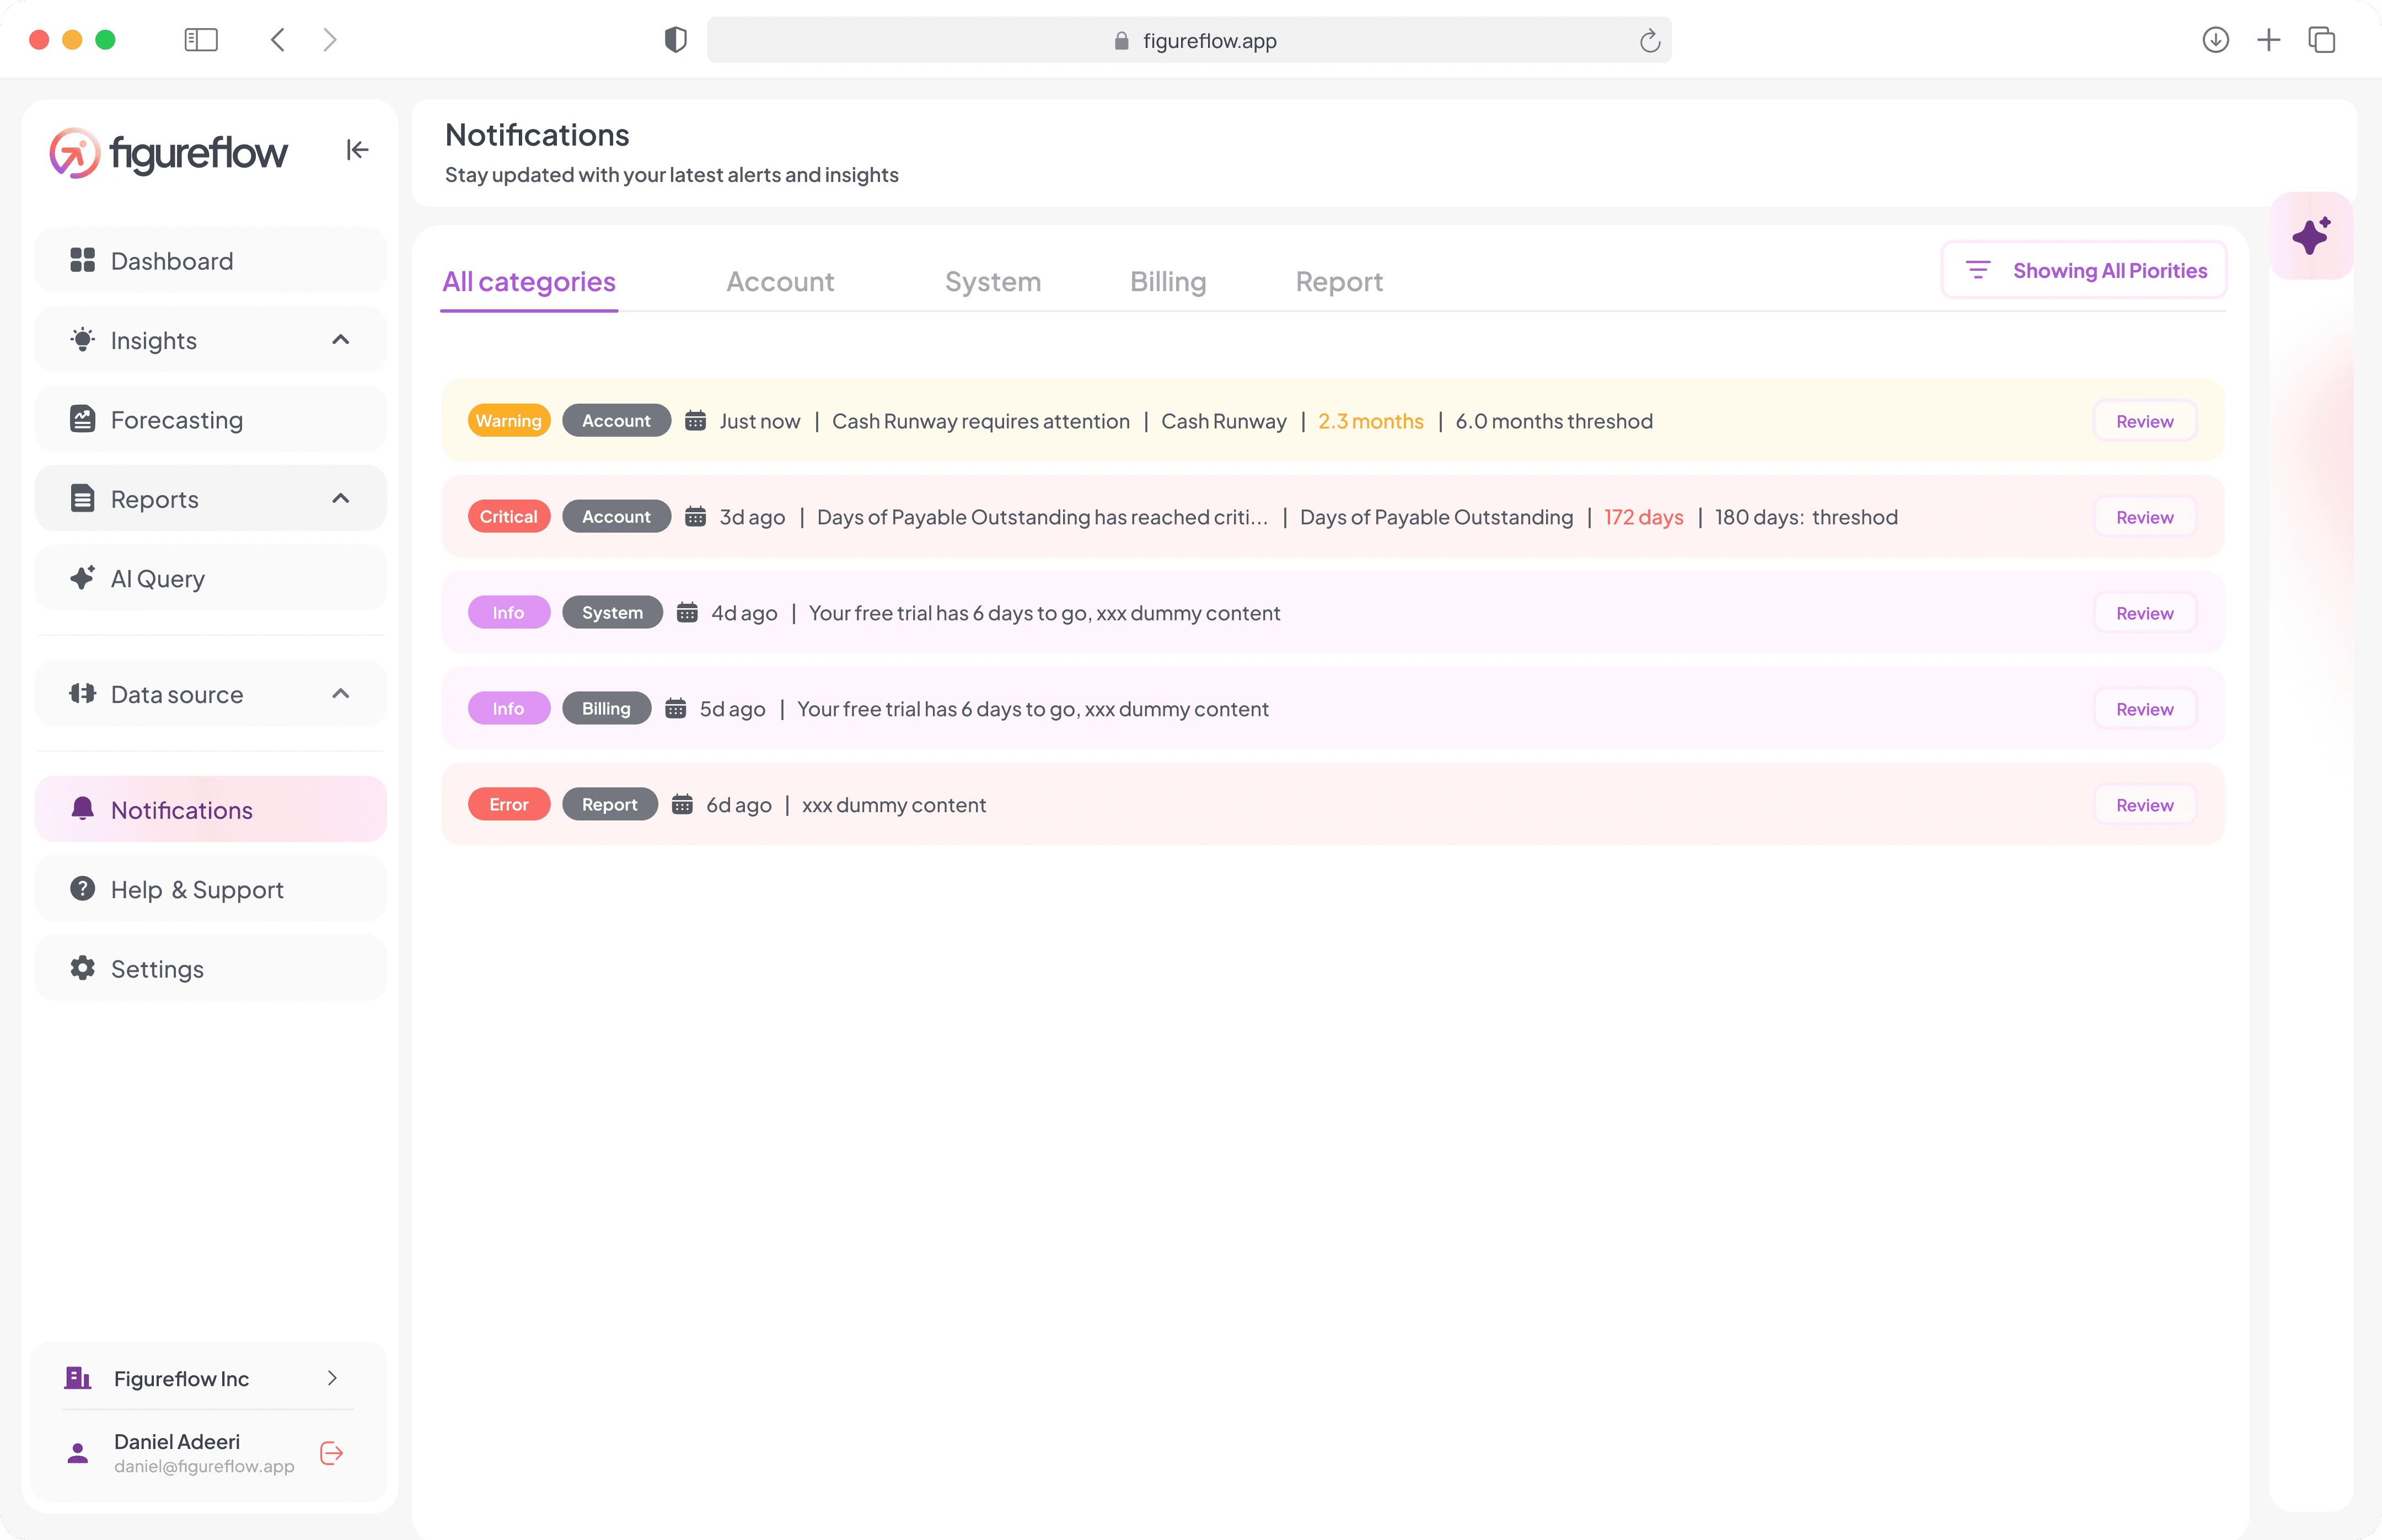
FigureFlow notifications
Settings manages profile details, team access, permissions, and billing. Help and Support provides FAQs, how-to videos, and direct access to support.
Marketing design: Static graphics

FigureFlow marketing graphic 1

FigureFlow marketing graphic 2

FigureFlow marketing graphic 3

FigureFlow marketing graphic 4

FigureFlow marketing graphic 5
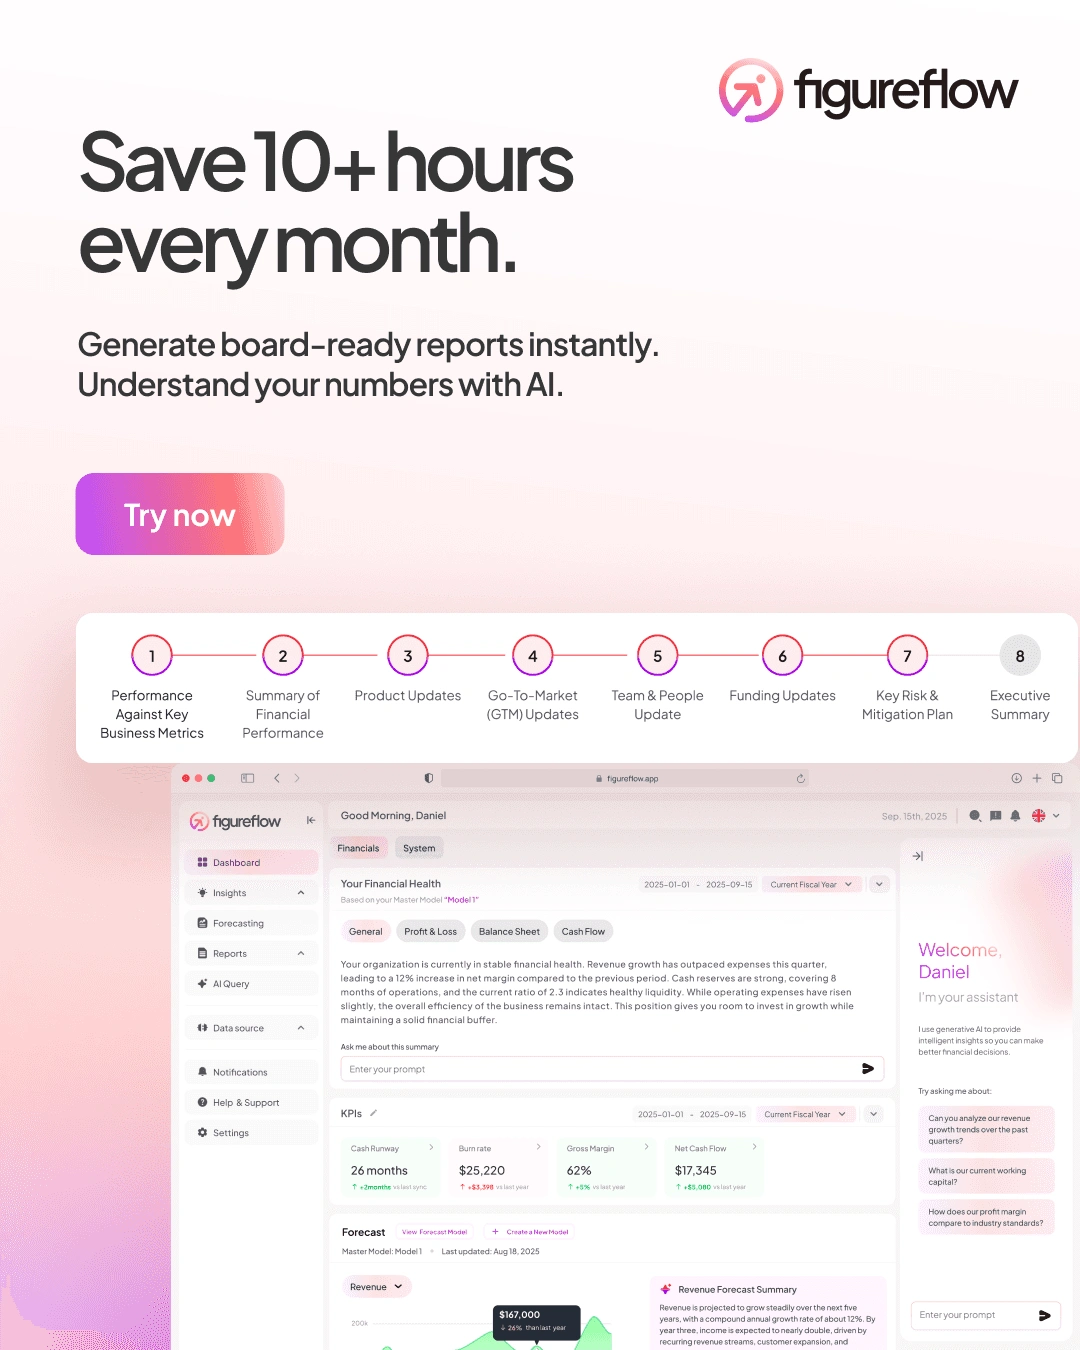
FigureFlow marketing graphic 6
Related FigureFlow work
Like this project
Posted Aug 14, 2026
Product design and marketing visuals for FigureFlow, an AI-powered financial intelligence platform that turns complex data into clear, actionable insights.
Likes
0
Views
21
Timeline
Aug 14, 2025 - Oct 4, 2025
Clients
FigureFlow