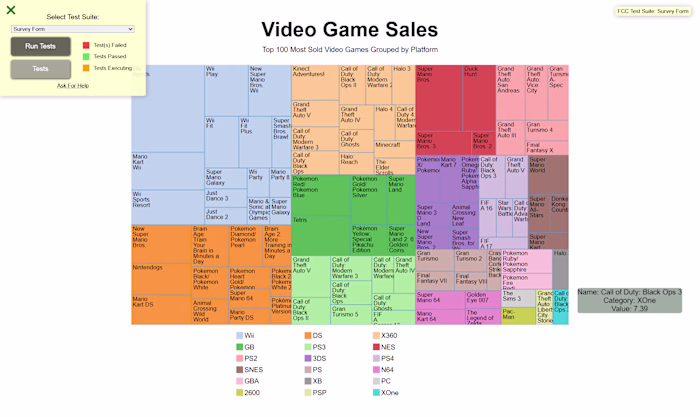
Tableau - E-Commerce Insights Dashboard
Devowise .
Overview
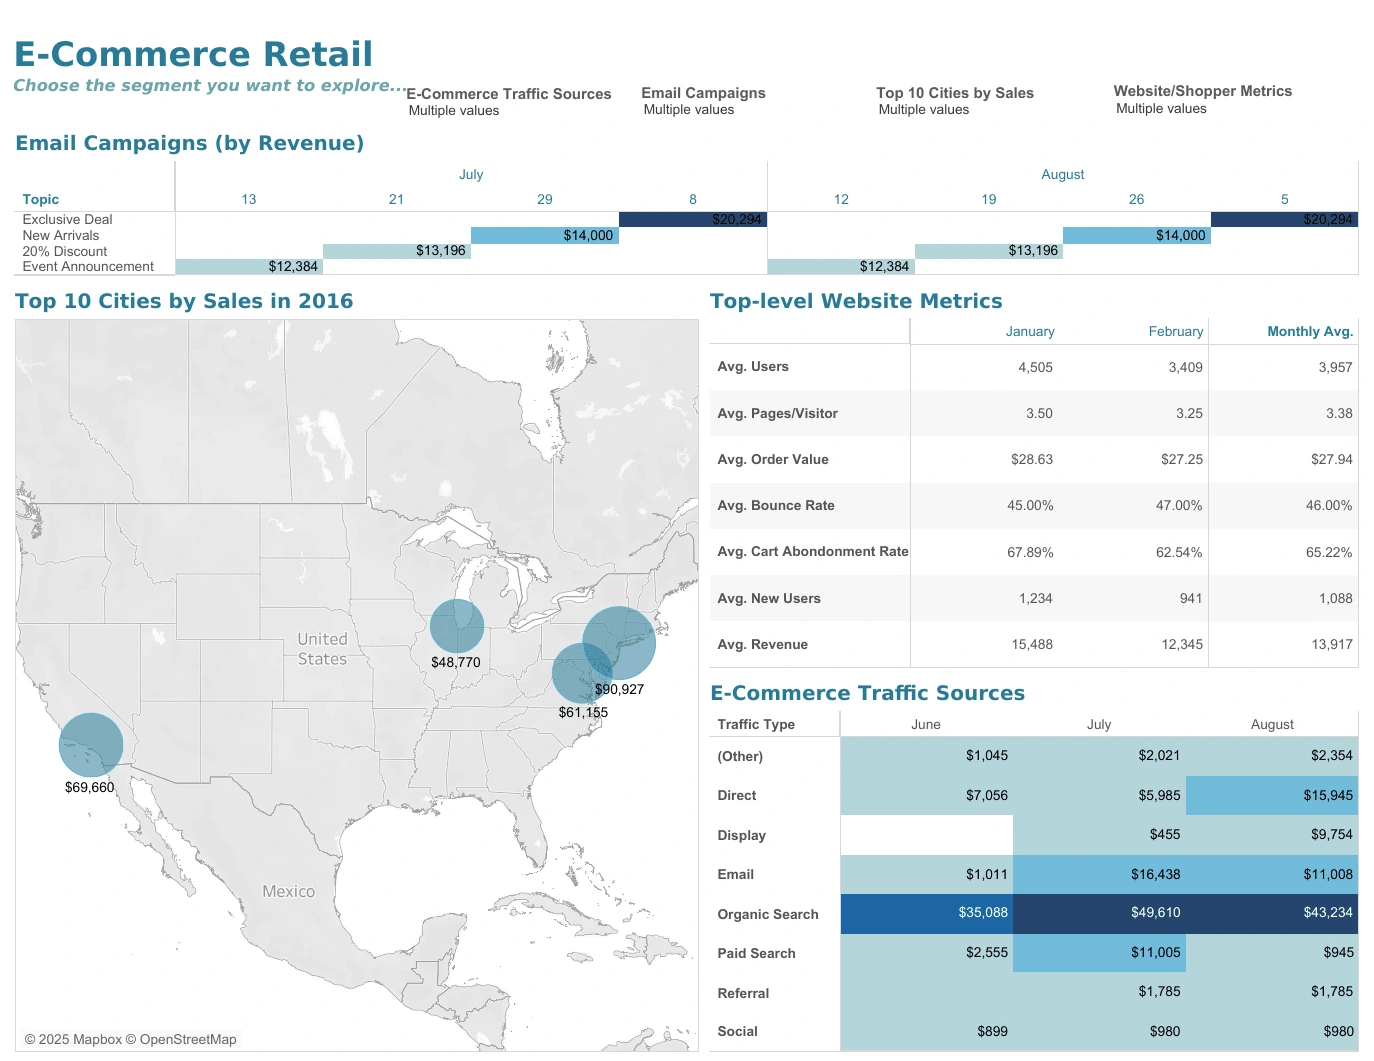
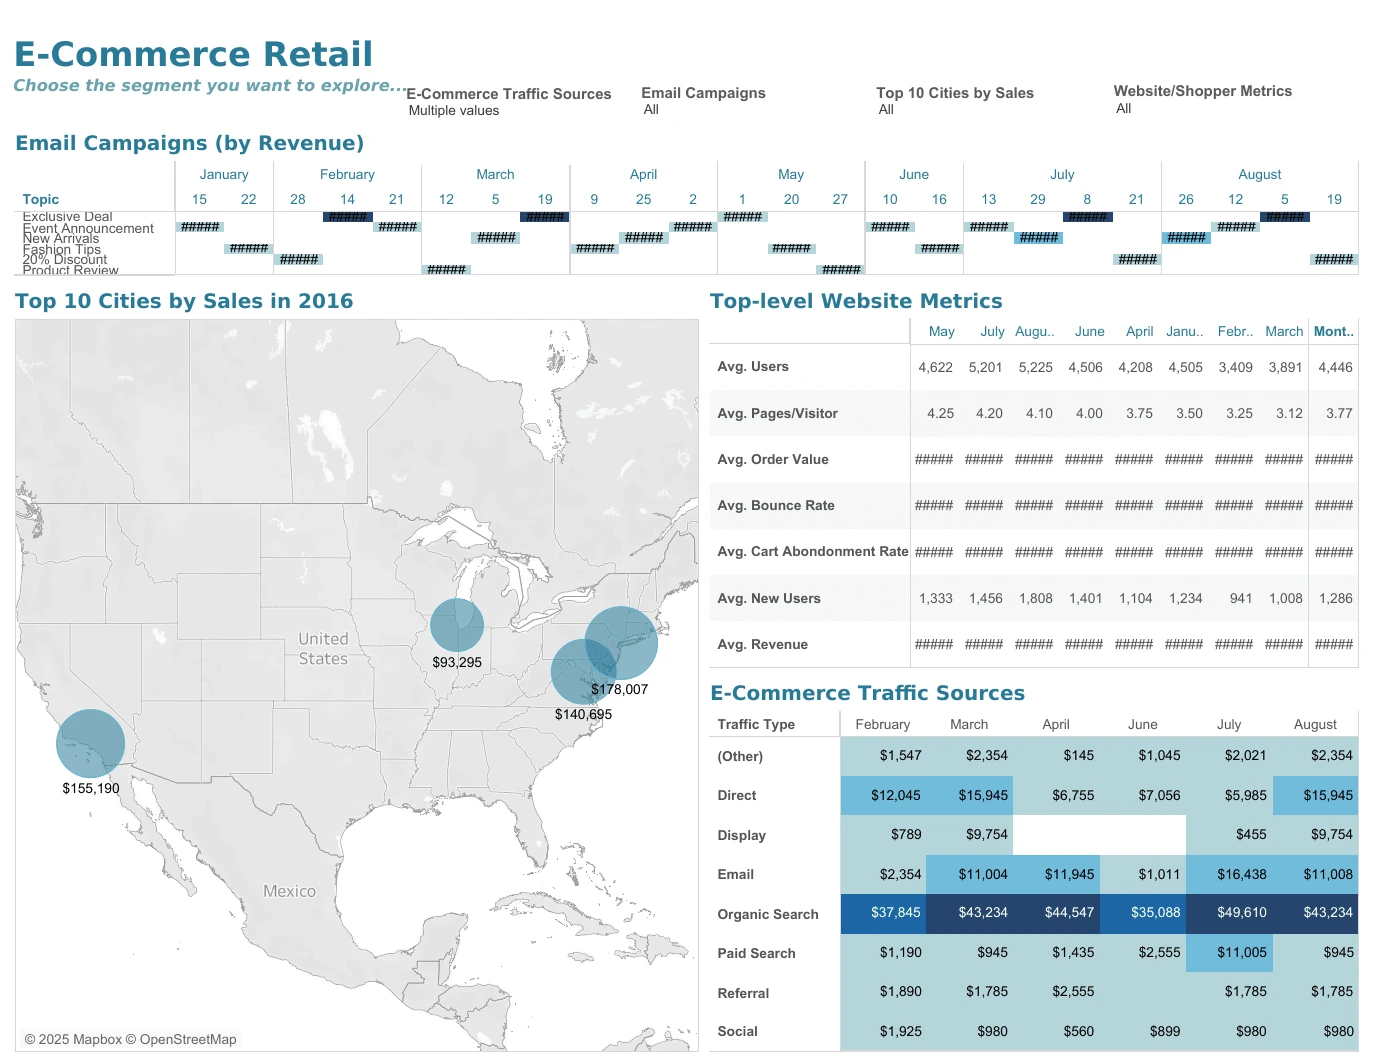
This E-Commerce Retail Dashboard provides a comprehensive look at key metrics influencing online sales, customer engagement, and traffic sources. Designed for data-driven decision-making, this interactive dashboard allows businesses to monitor their email campaign performance, top-selling cities, website traffic, and shopper behavior at a glance.
Insights
🔹 Email Campaign Performance: Tracks revenue generated from email campaigns over time, helping marketers understand which promotions drive the most sales.
🔹 Top Cities by Sales: A geographic visualization of the highest-performing locations, identifying key markets for targeted marketing strategies.
🔹 Website Metrics: Essential performance indicators such as average users, pages per visitor, order value, bounce rate, cart abandonment rate, and revenue, enabling businesses to optimize the customer journey.
🔹 Traffic Sources: Breakdown of revenue by channels such as organic search, paid search, email, social media, and direct traffic, helping businesses allocate marketing budgets effectively.
Technology Stack
🟢 Tableau – For data visualization and interactive dashboards.
🟢 SQL / Data Warehouse – To aggregate and structure e-commerce data.
🟢 Google Analytics – Capturing real-time website traffic insights.
🟢 ETL Tools (Alteryx, Python, or Power Query) – Preprocessing and transforming raw data into meaningful insights.
Like this project
Posted Mar 12, 2025
This Tableau dashboard offers real-time e-commerce insights, tracking sale, email campaign, web engagement, and traffic sources for smarter marketing decisions.
Likes
0
Views
16