Sympathy For Data Product Design
Erik Wiktor Bogren
Sympathy for Data is a tool used to structure difficult amount of machine data into valuable insights. It's a node-builder user interface that needed to cover a lot of features.
A challenge with Sympathy were to keep a lot of their original user experience while building a more beautiful user interface. Sympathy serve big companies & did not want to lose the experience & trust they already built.
Landing Pages
A big part of Sympathy upgrade were to introduce landing pages. Pages that a user can look around & save their progress before creating a new file. This also needed to include things such as templates & tutorials
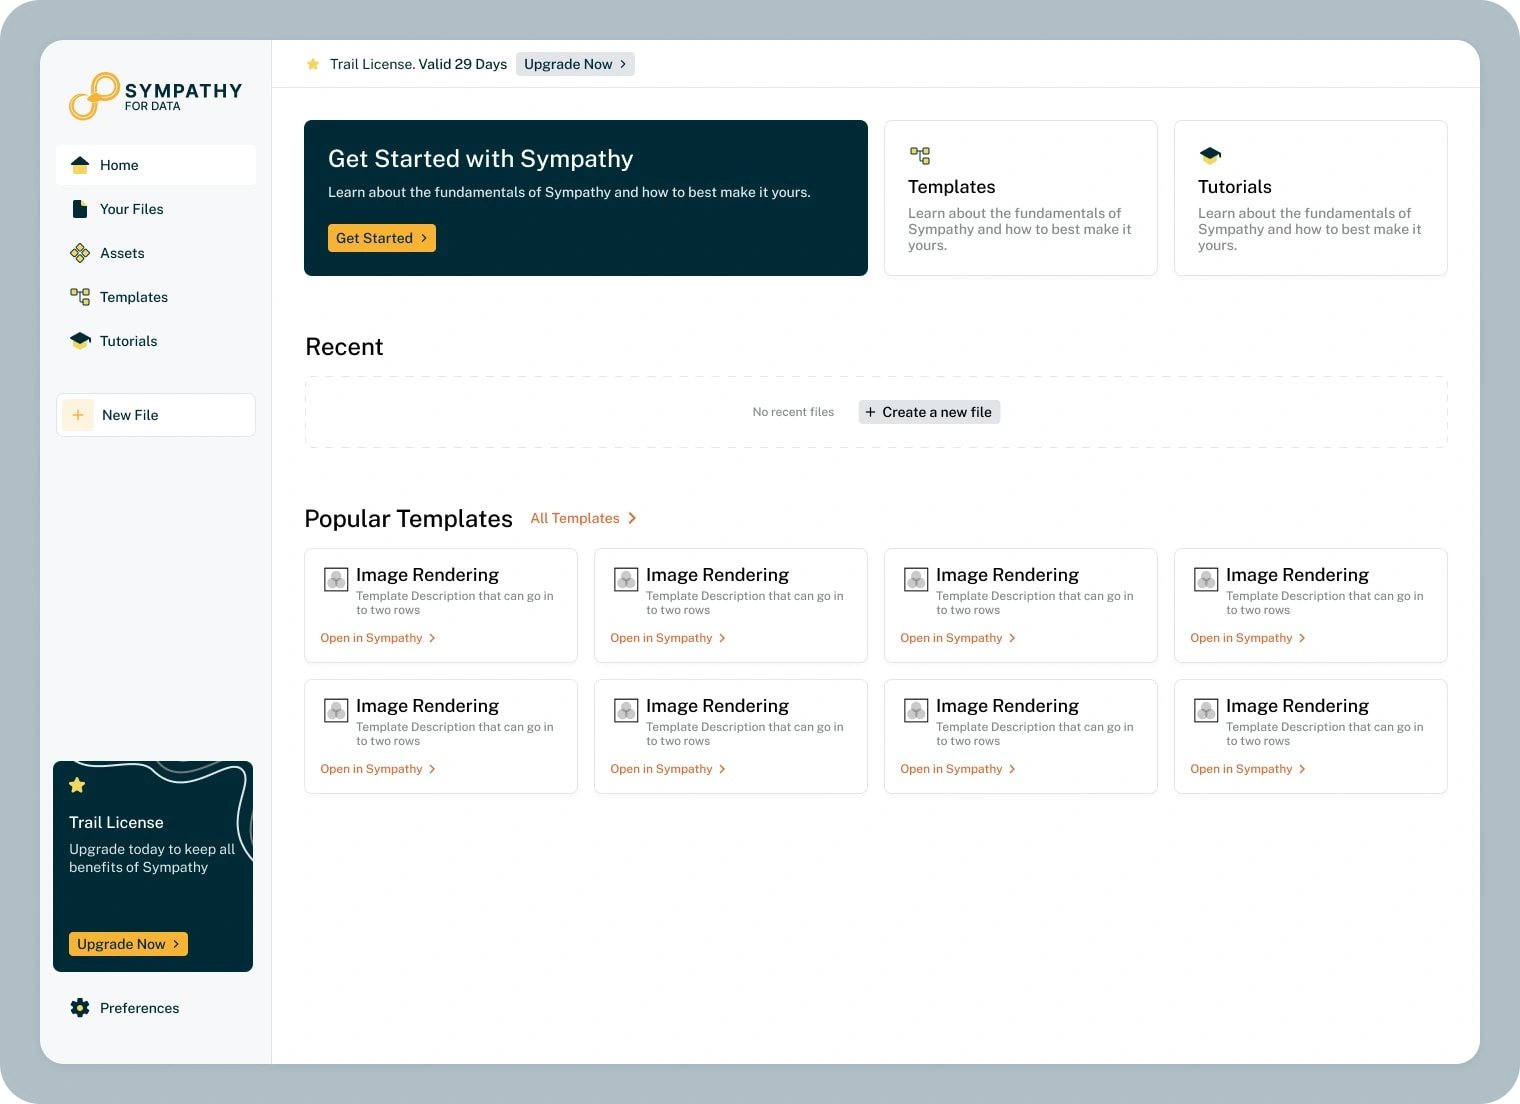
Home Page
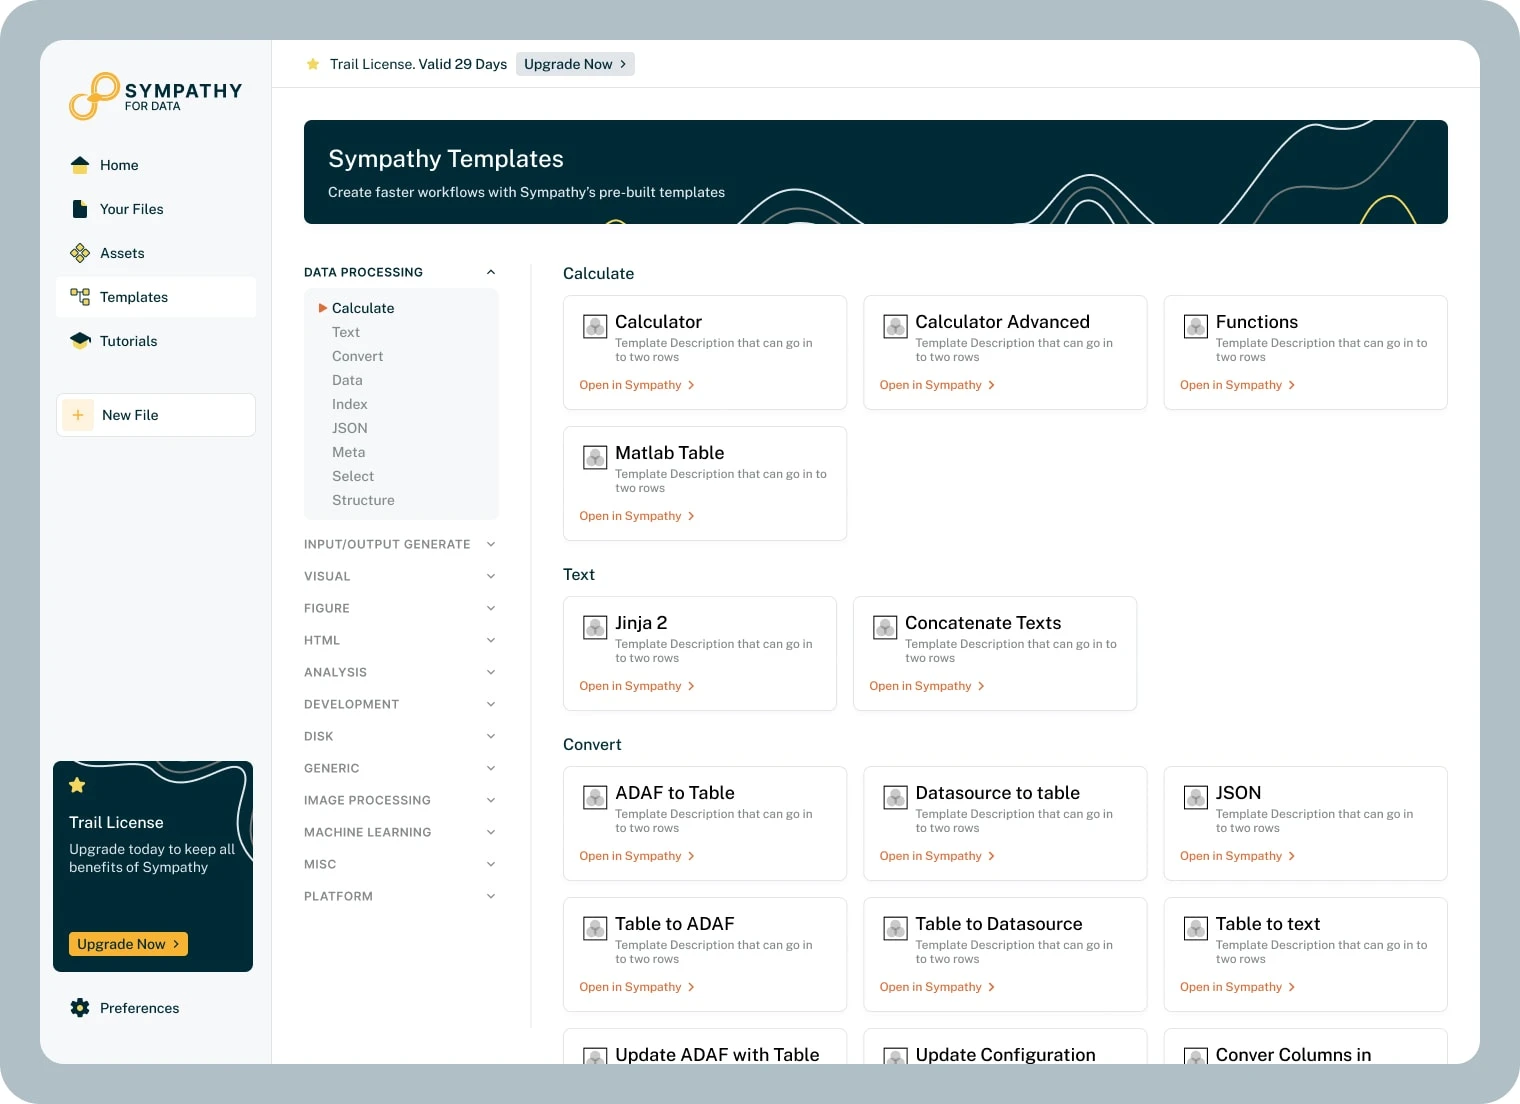
Templates
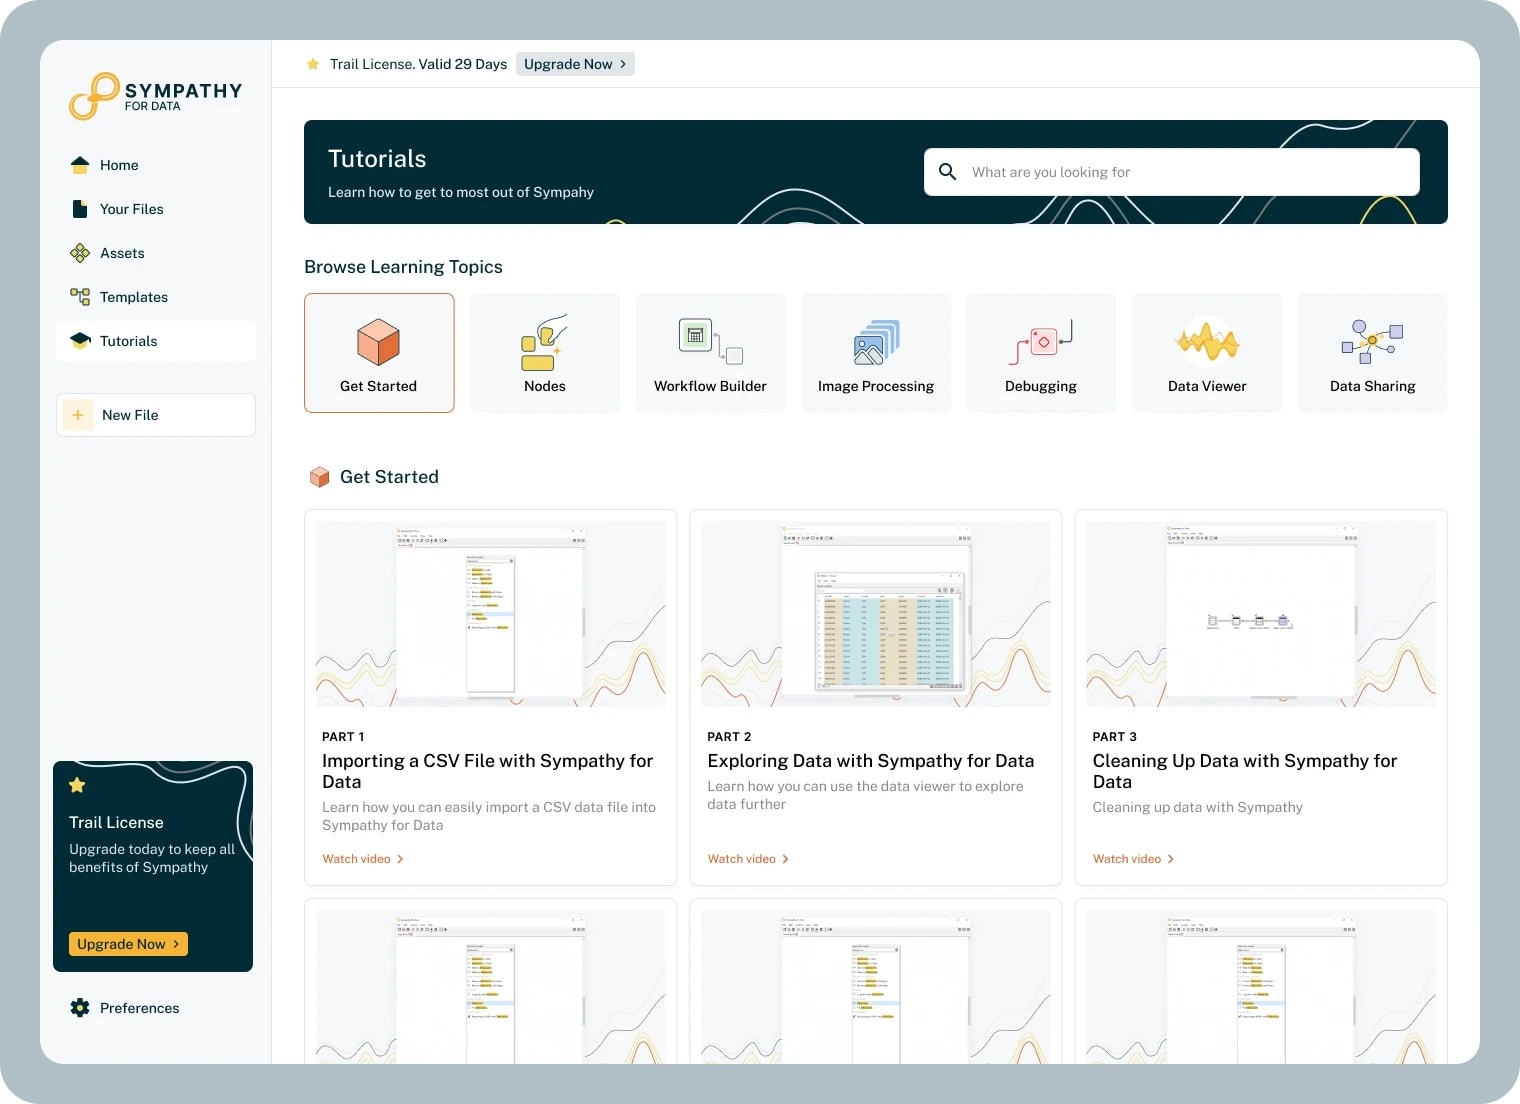
Tutorials
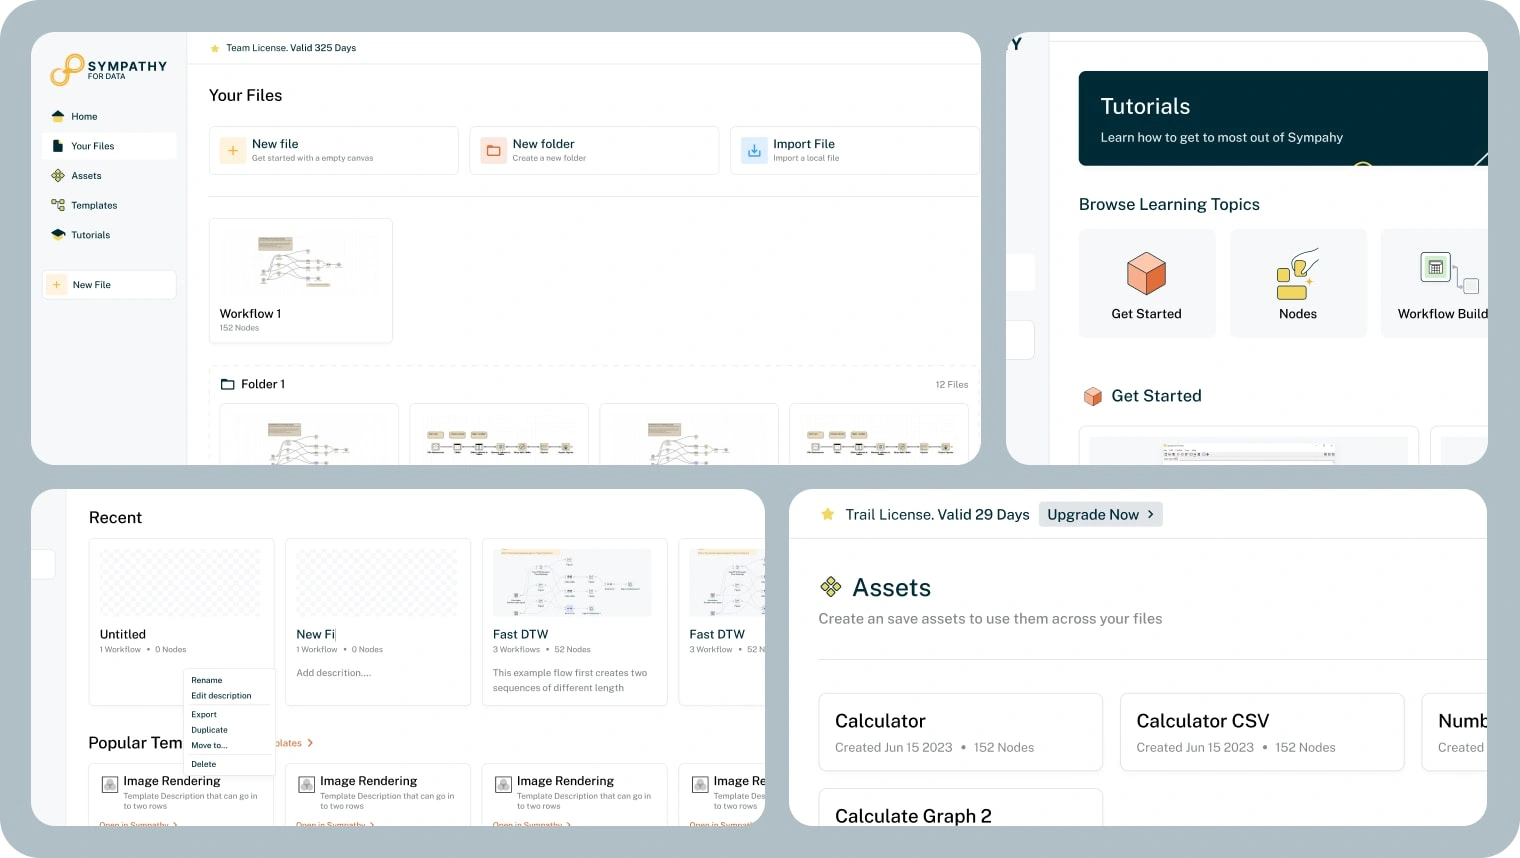
Details shot
Node Builder
When creating a project in Sympathy, the user will get a blank canvas where they can add nodes that will process data in different ways. A user can add a node in many different ways.
They can use a left navigation, where nodes are placed in different categories. They can use shortcuts to get a node dropdown, but also use a universal search to find nodes, templates & more.
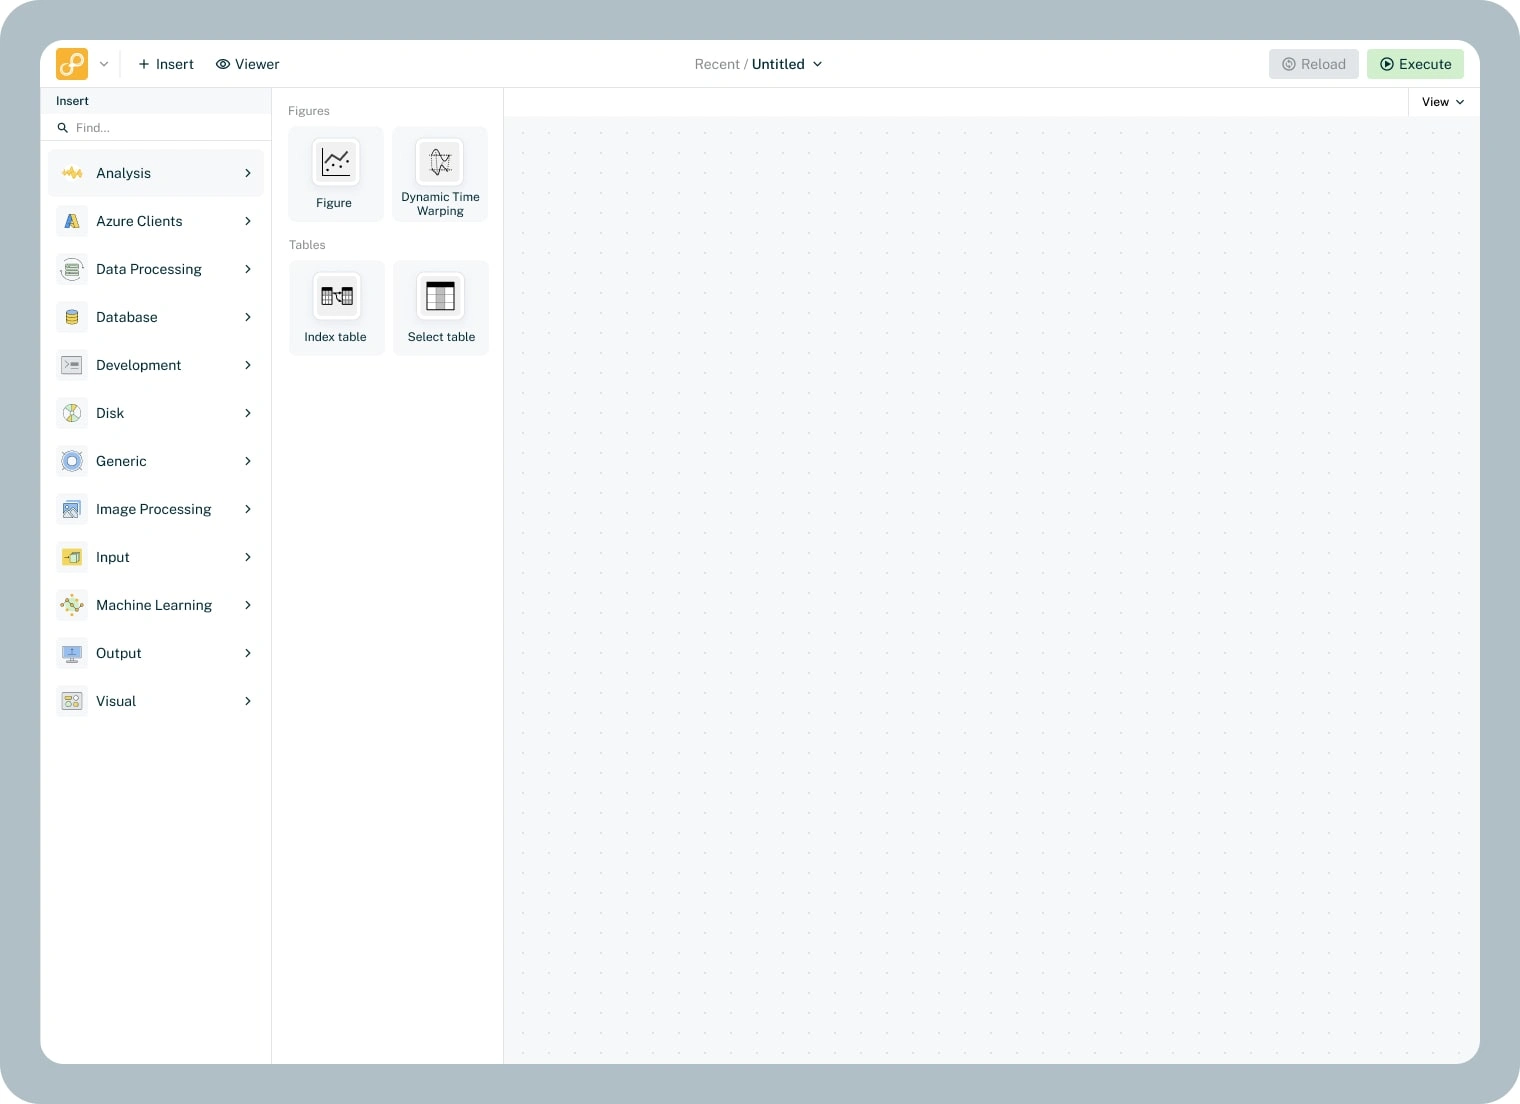
Node Categories
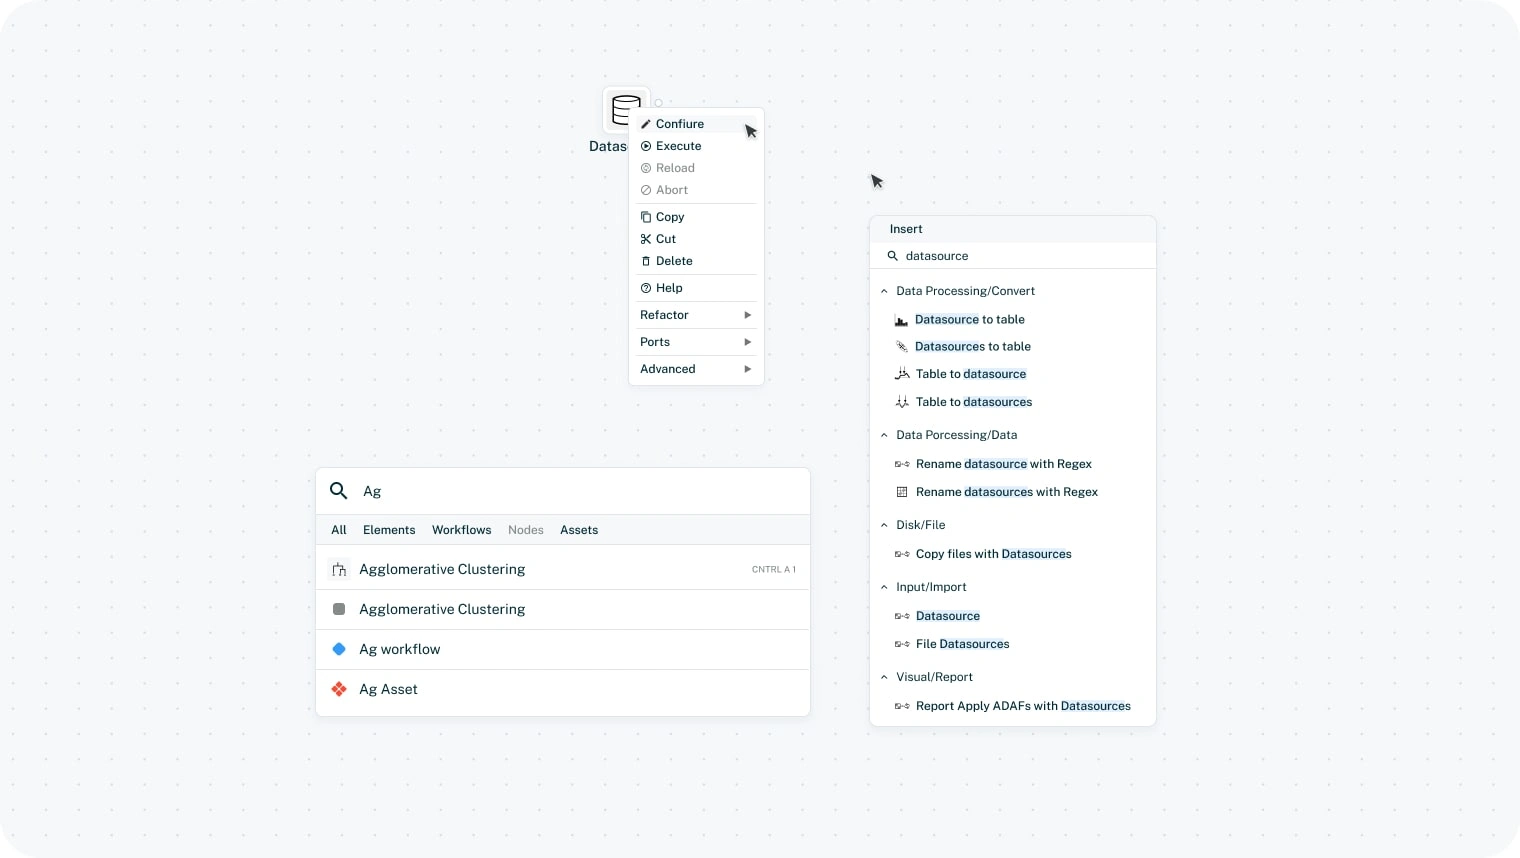
Node Details, Including; Node Search, Universal Search, Node Actions
The Node builder is a complex, drag & drop, user interface where the user themself can decide exactly what elements they want to show. A node can also be a "group" of sort, where another workflow is being ran at this stage.
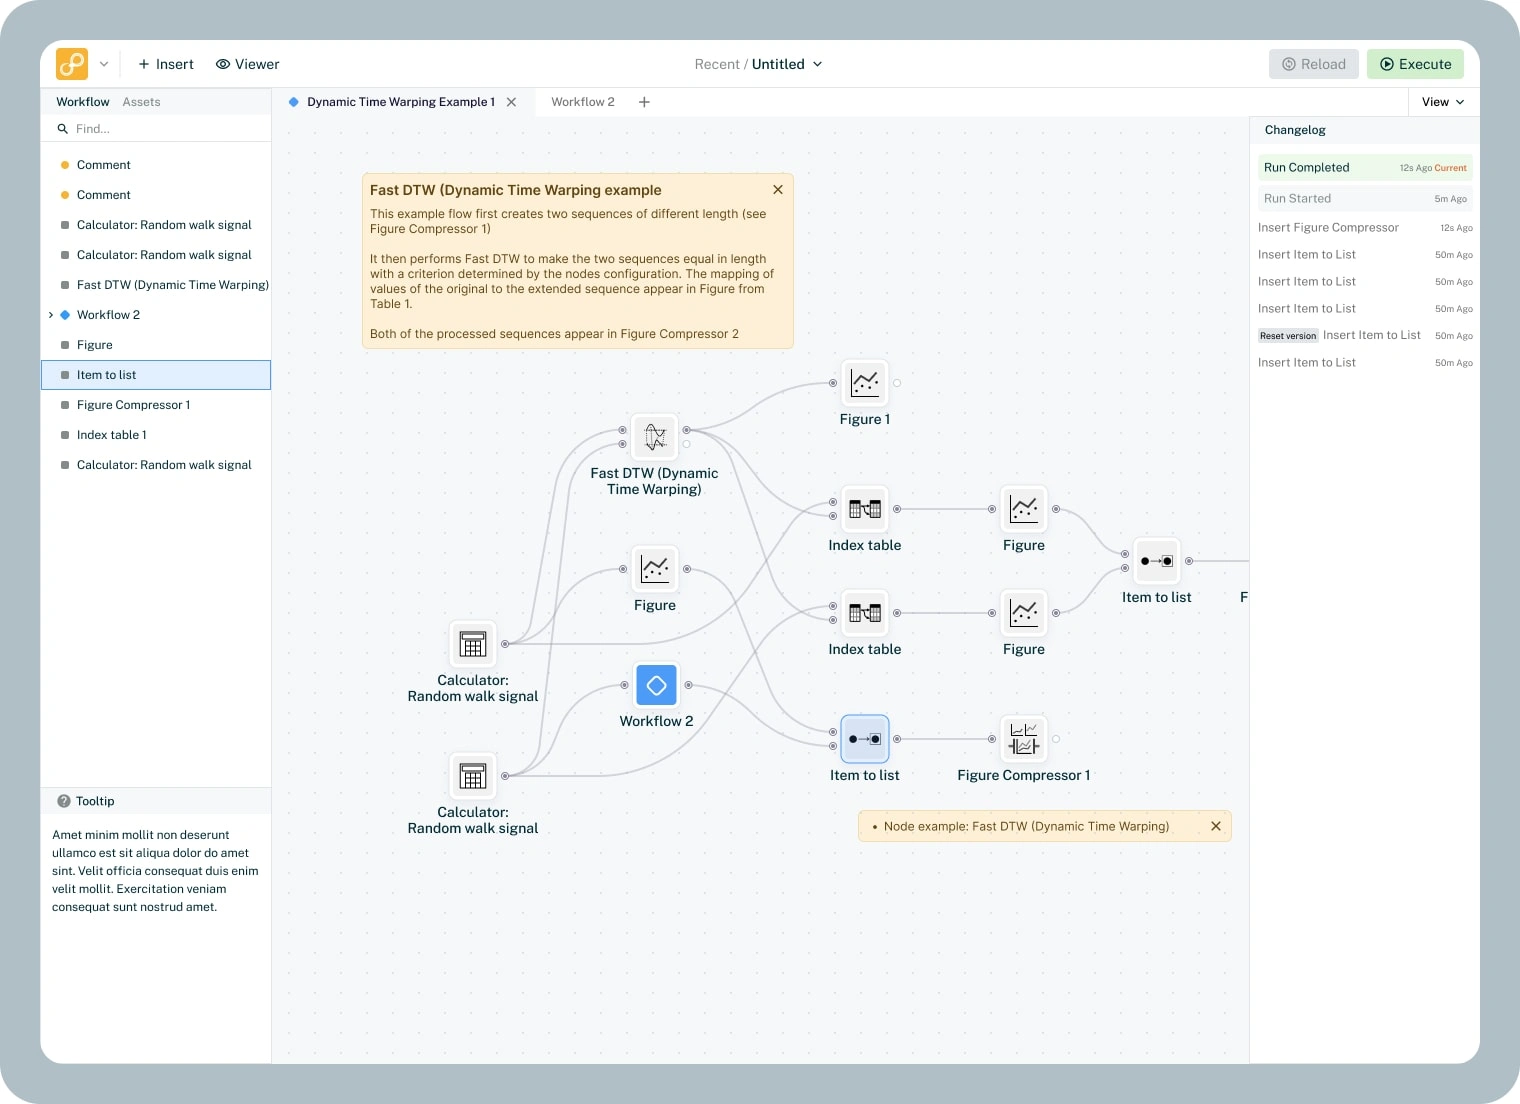
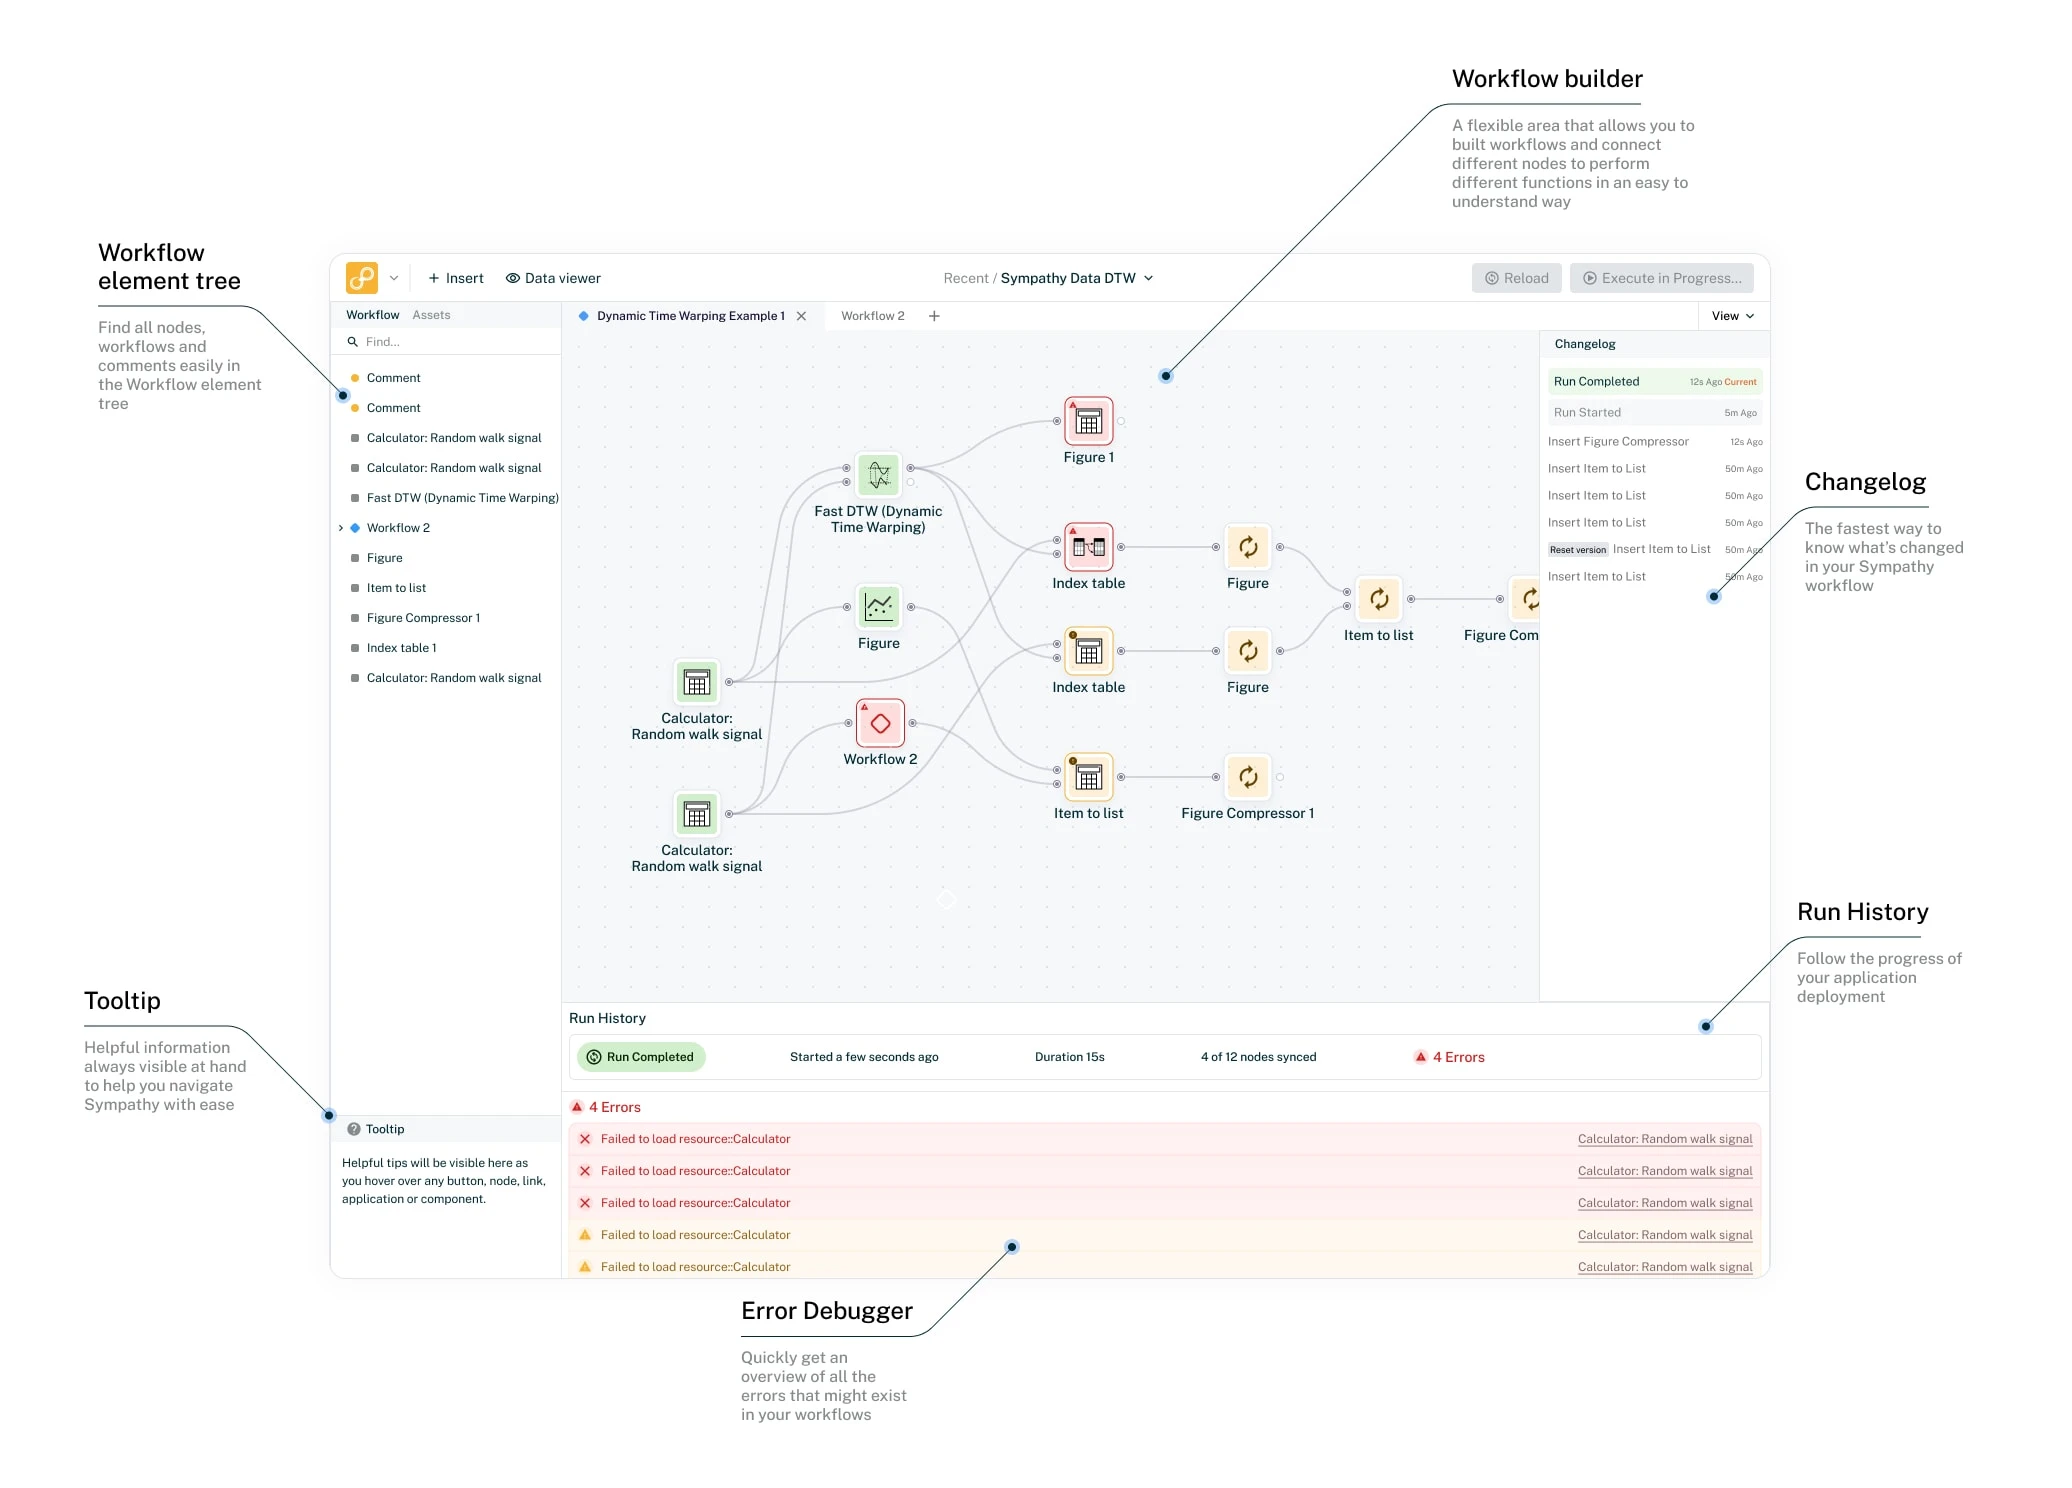
UI of a built workflow
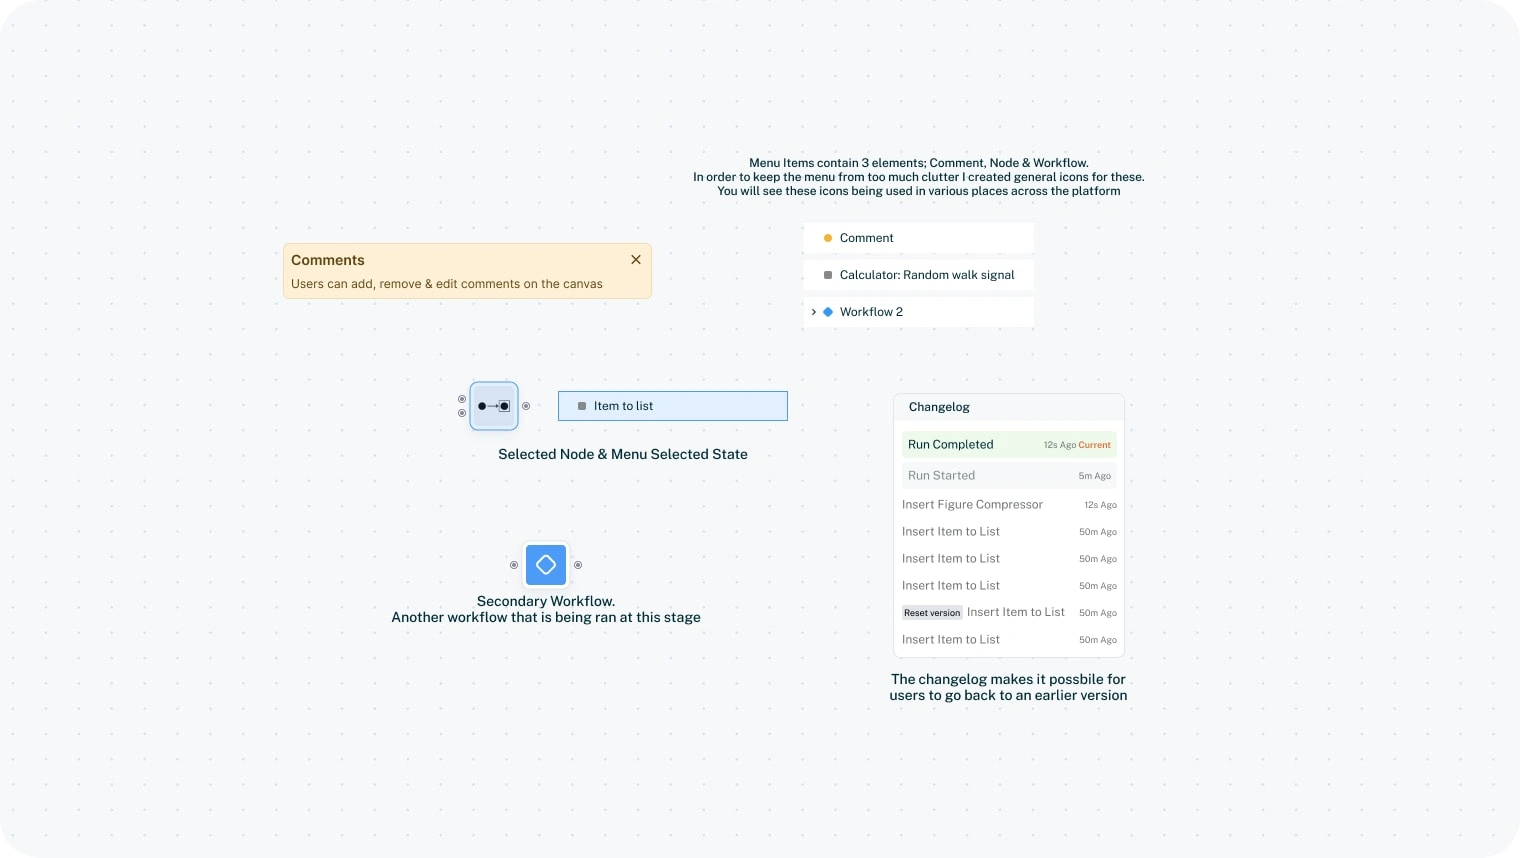
UI explanations
Data viewer
The data viewer is where the user open up a node to set it's specific preferences & details.
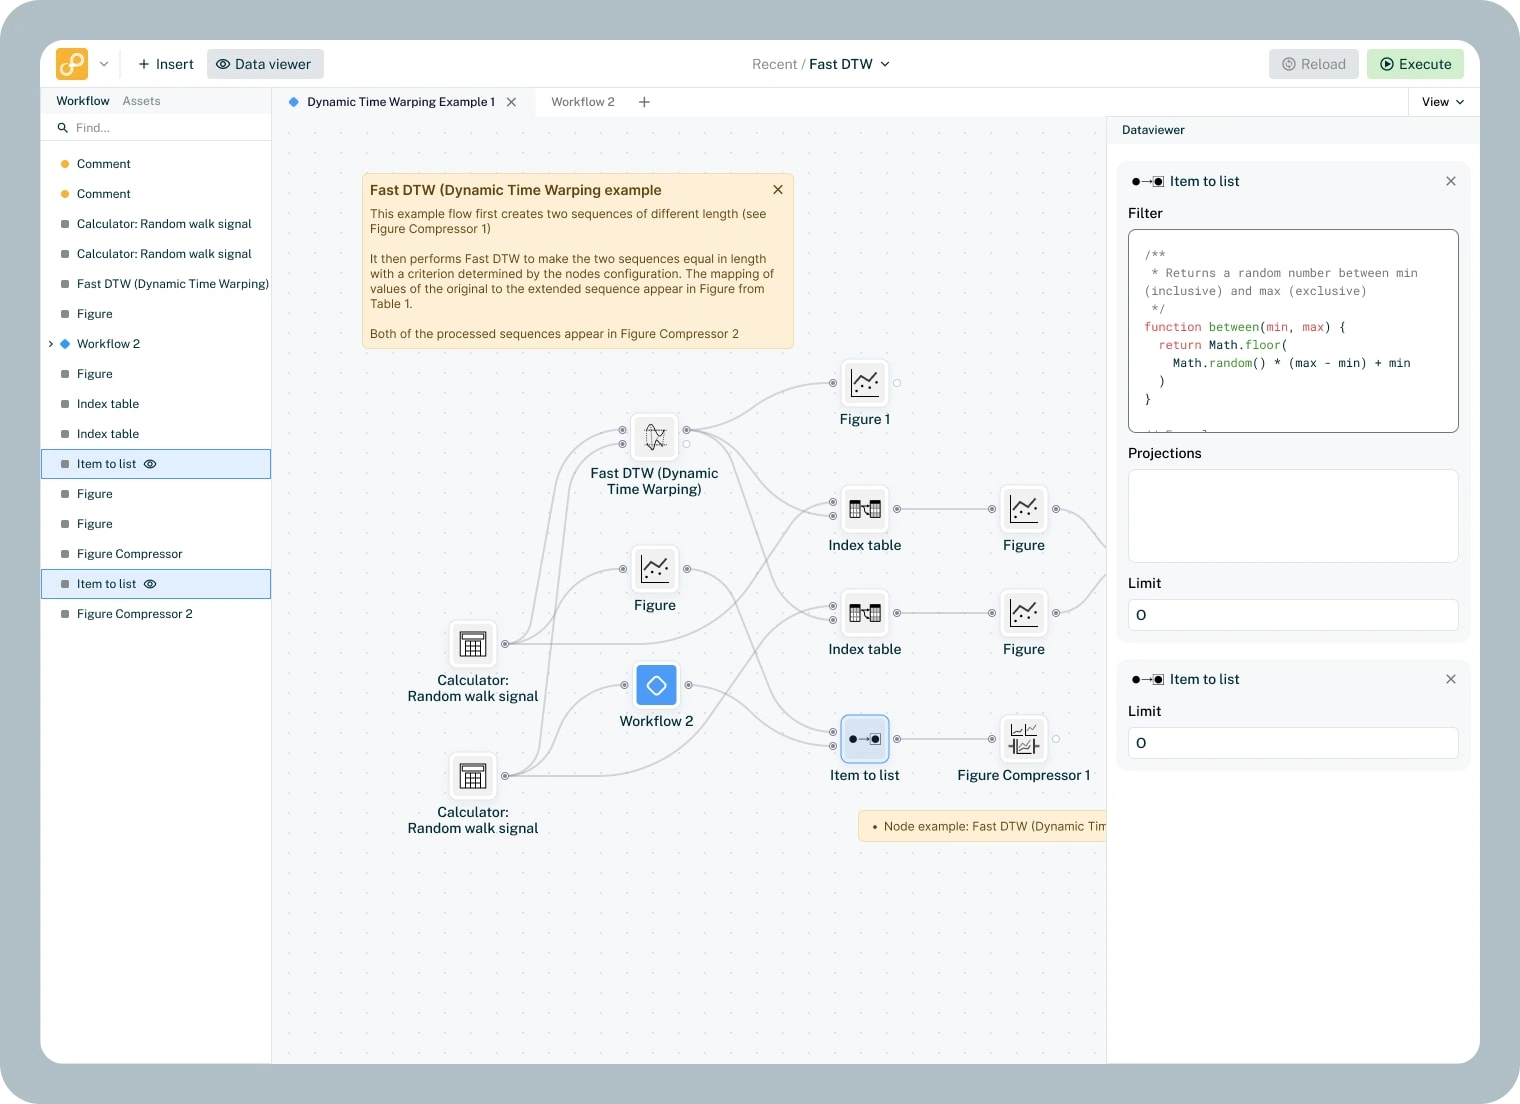
Data viewer left navigation
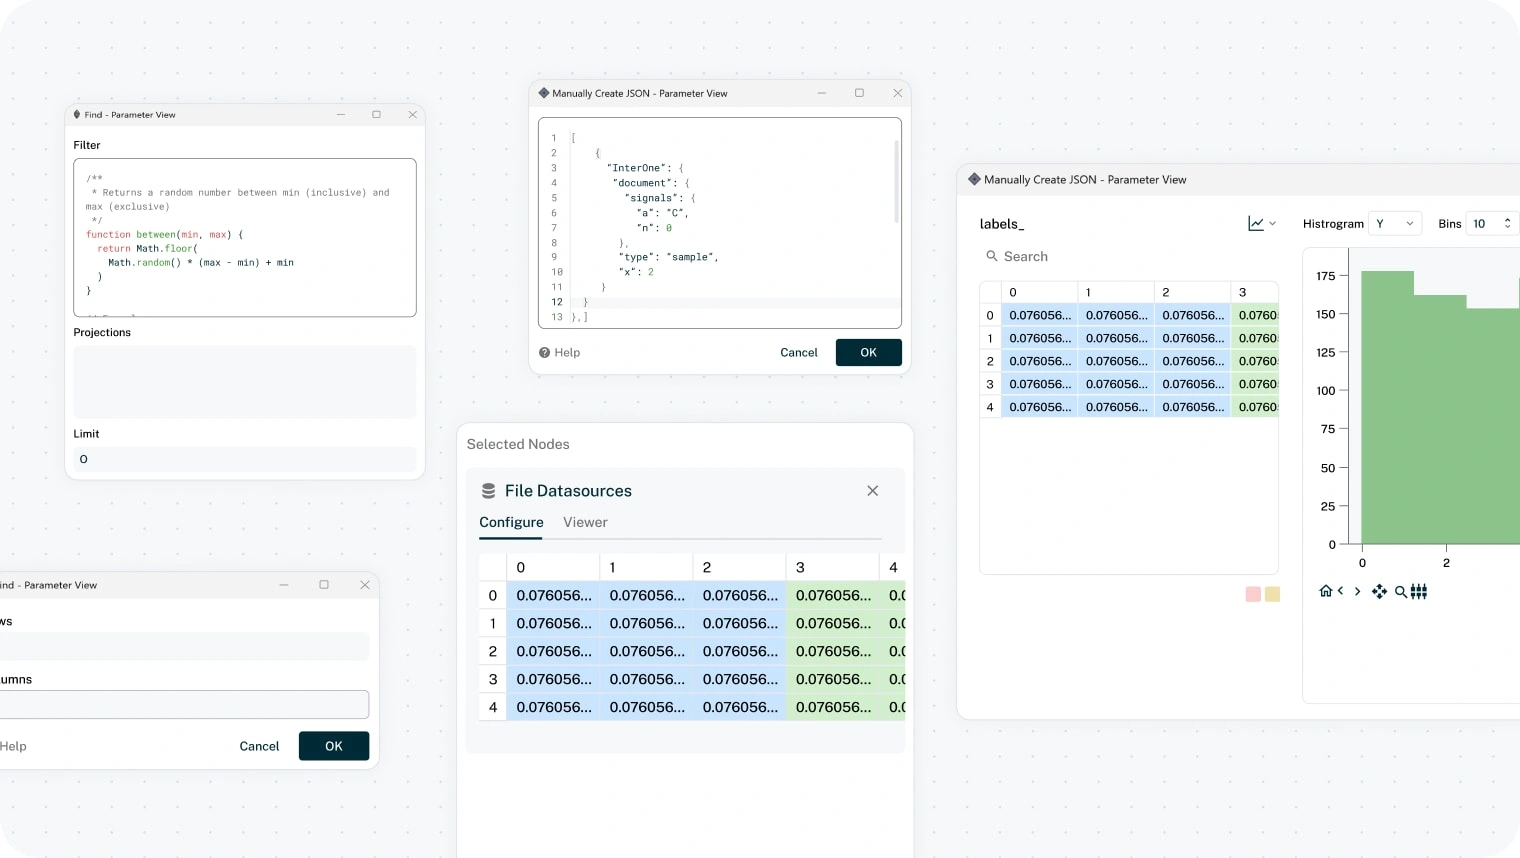
Data Viewer Popups
Execute, Run & Debug
When a user have created their workflow it's time to test it. Using the top right Execute button a user can test their workflow all all its nodes. From left to right the software will run the data, giving real time updates of any errors that may occur. If a user gets any error the software will clearly show this, allowing the user to fix, reload & re-run the workflow.
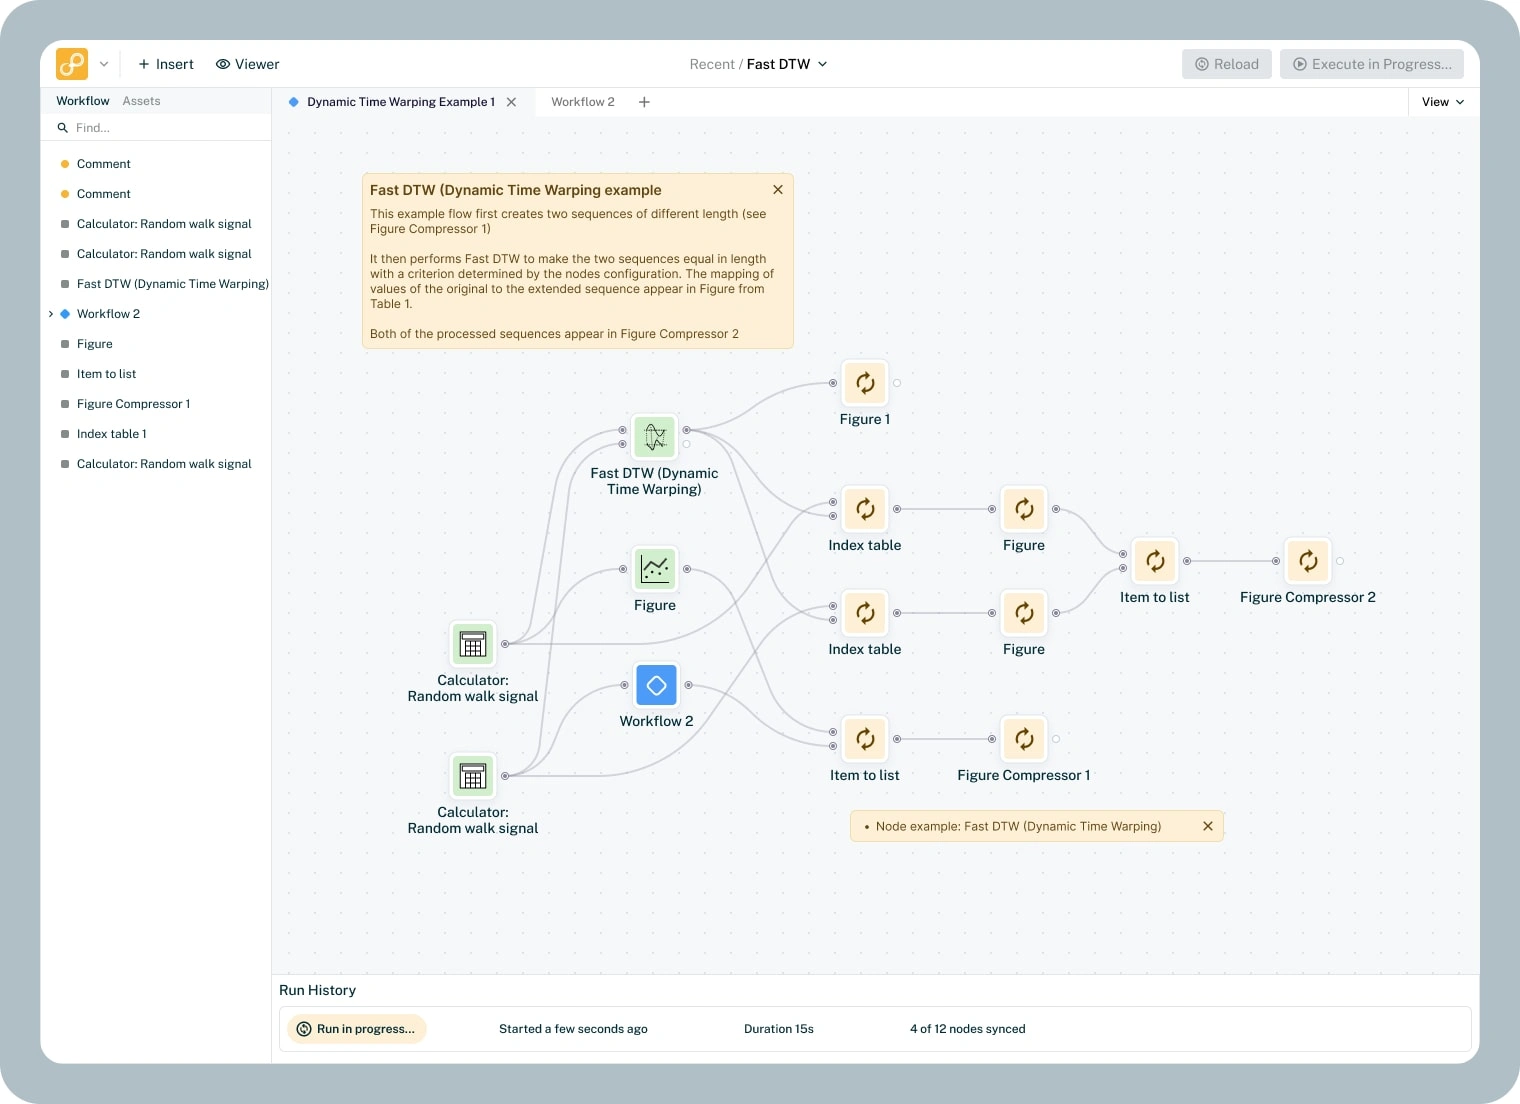
Execute in progress. Node icons change to indicate that a execute is in progress
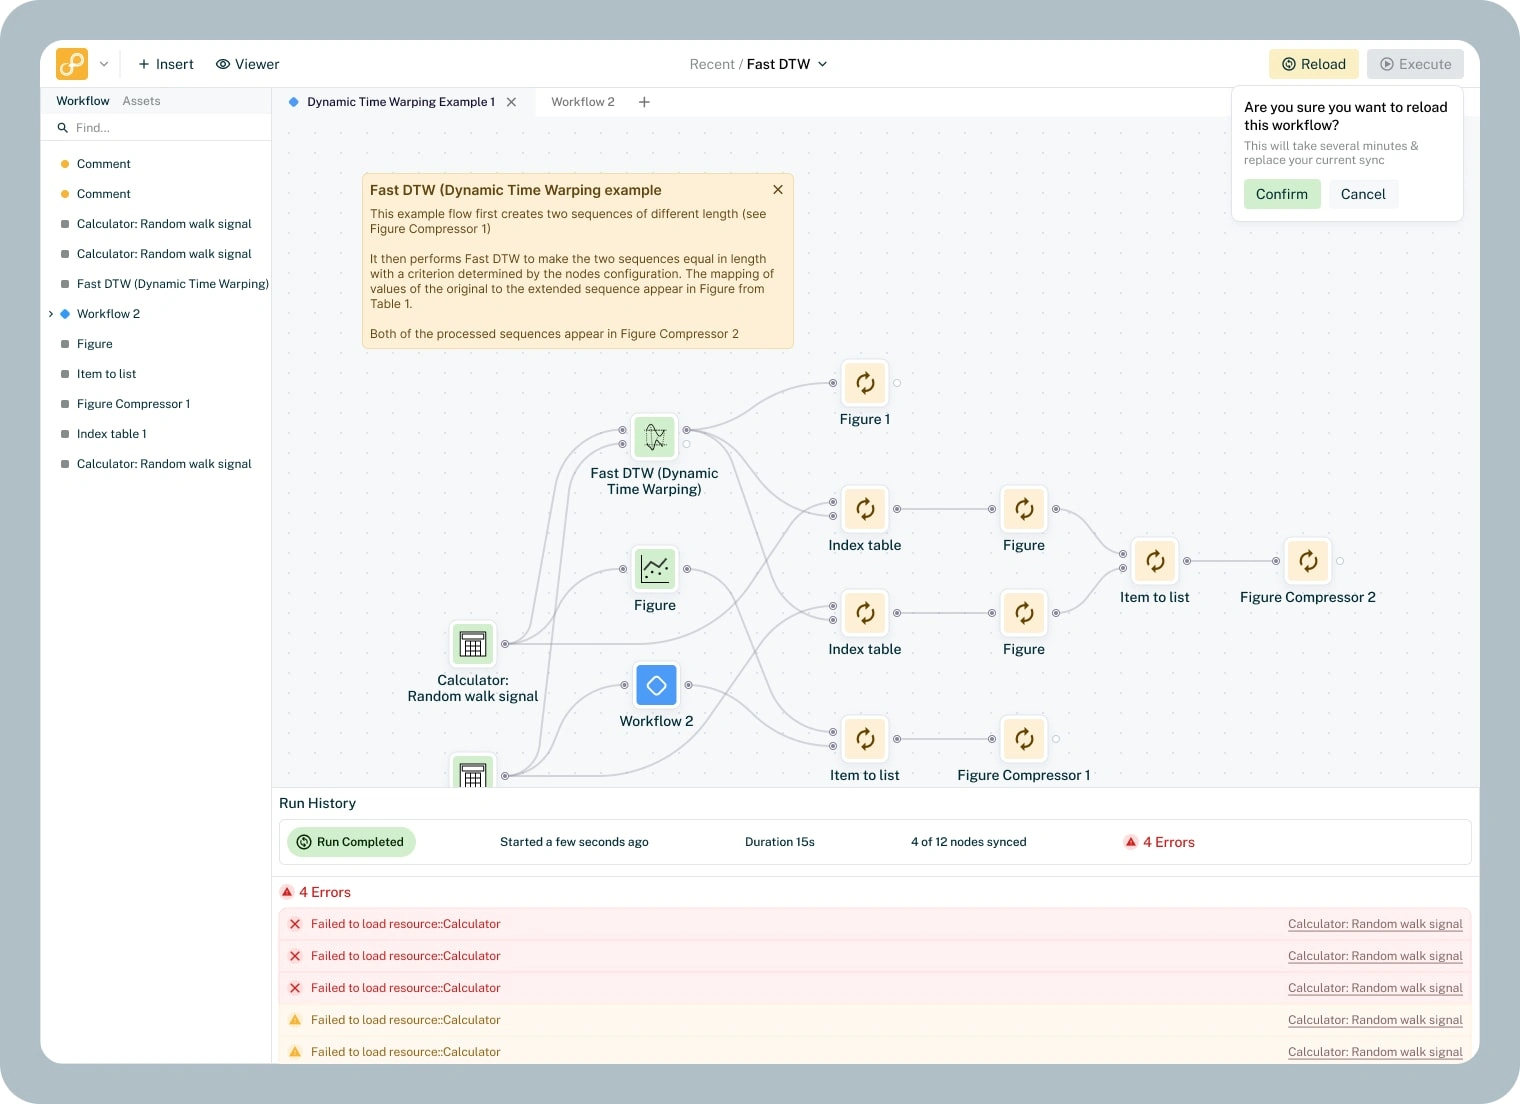
When a run is completed, you might get a feed of errors. You can then decide to fix those & reload the workflow
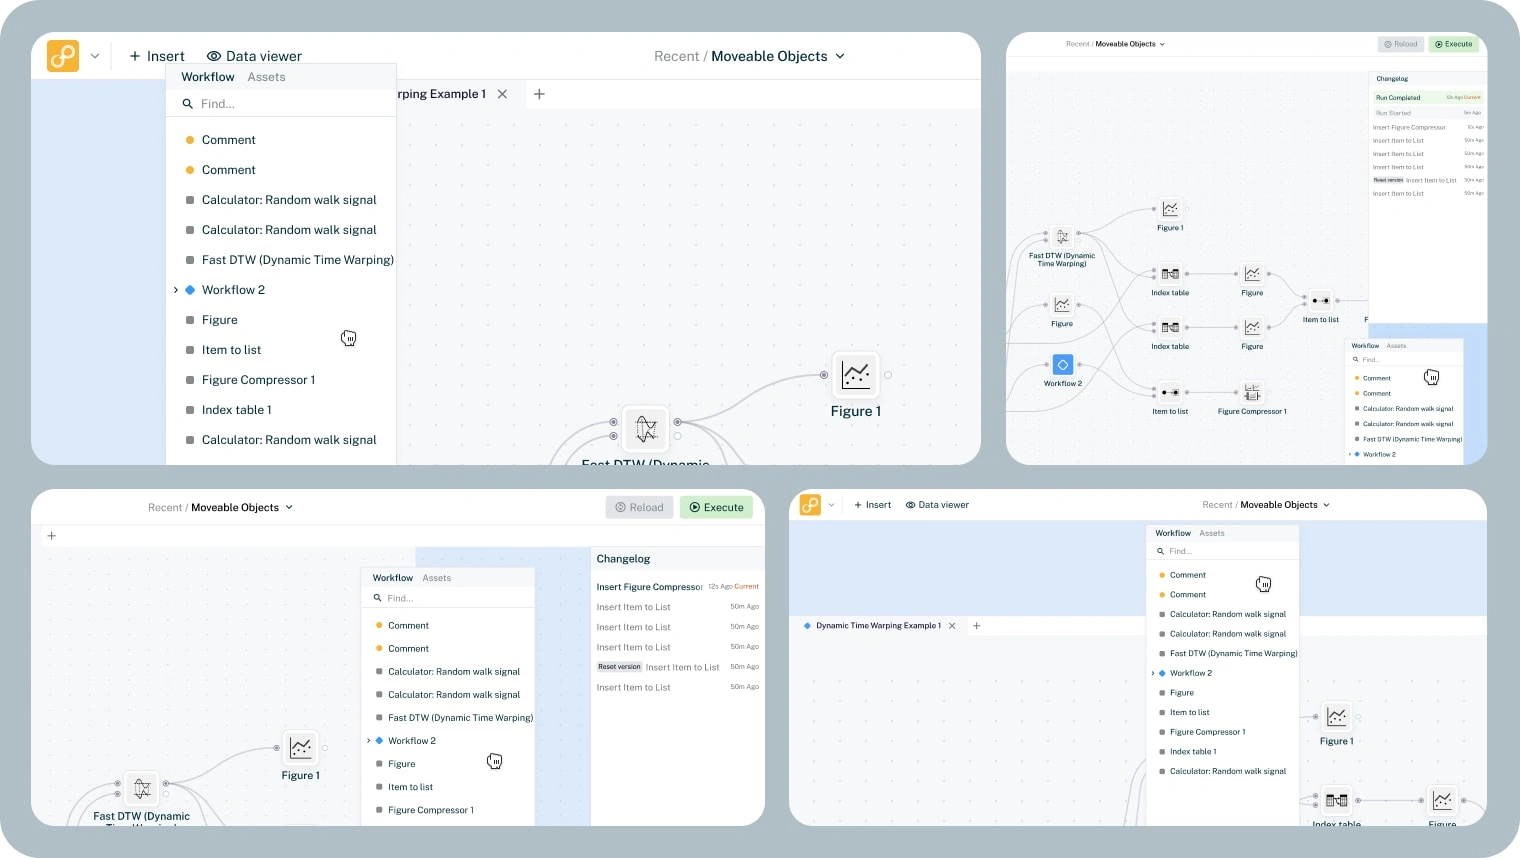
Drag & Drop
A core functionality in Sympathy's UI is the ability to move the UI. This allows the user to create the workspace they want & remove the things they don't need.
Thank you for viewing!
If you liked this project & would like to know how I can help you bring your idea to life, please do not hesitate to contact me! I'll happily hop on a free 30-minutes consultancy call to discuss your project and how I can help you!
Like this project
Posted Mar 19, 2024
Sympathy for Data turns complex machine data into insights. I worked on improving its UI without losing the UX that big companies already trust.