Veltrix AI — 0→1 AI Analytics for Small Business

Mykola Popov

Role: Lead Product Designer · Sole designer, 0→1
Timeline: ~12 months · Industry: B2B SaaS · SMB analytics
Scope: Brand, marketing site, product UX/UI, design system, motion
The problem
Veltrix connects QuickBooks, Xero, Shopify and HubSpot. Early retention sat at 22% — owners connected their accounts, saw charts, and left. They weren't data-poor. They were decision-poor.
78% of signups connected an account. Only 22% were still active at week 4. The most engaged owners flooded support asking "okay, but what does this mean?"
Research
14 owner interviews across retail, services and e-commerce, first-session analytics, and comprehension tests — show a real chart, ask "what would you do now?"
The surprise: owners who churned read the charts correctly and still couldn't name an action. Visual clarity had almost no relationship to whether they'd act. We had been optimizing the wrong variable.
The bet
A dashboard asks a question — what does this mean? — when the owner came for an answer.
Raw data → plain-English insight → one next action.
Design principles
Answer first, evidence on demand. Never open with a chart. Open with the verdict; the chart sits underneath as proof.
Earn trust by showing your work. Every insight links to its numbers and source tool. Low-confidence findings are framed as questions, not claims.
One decision at a time. Recommend a single next action; the rest tuck behind "other options."
Plain English, owner's words. Not "MRR cohort variance" — "you're keeping fewer repeat customers than last month."
Three strategic decisions
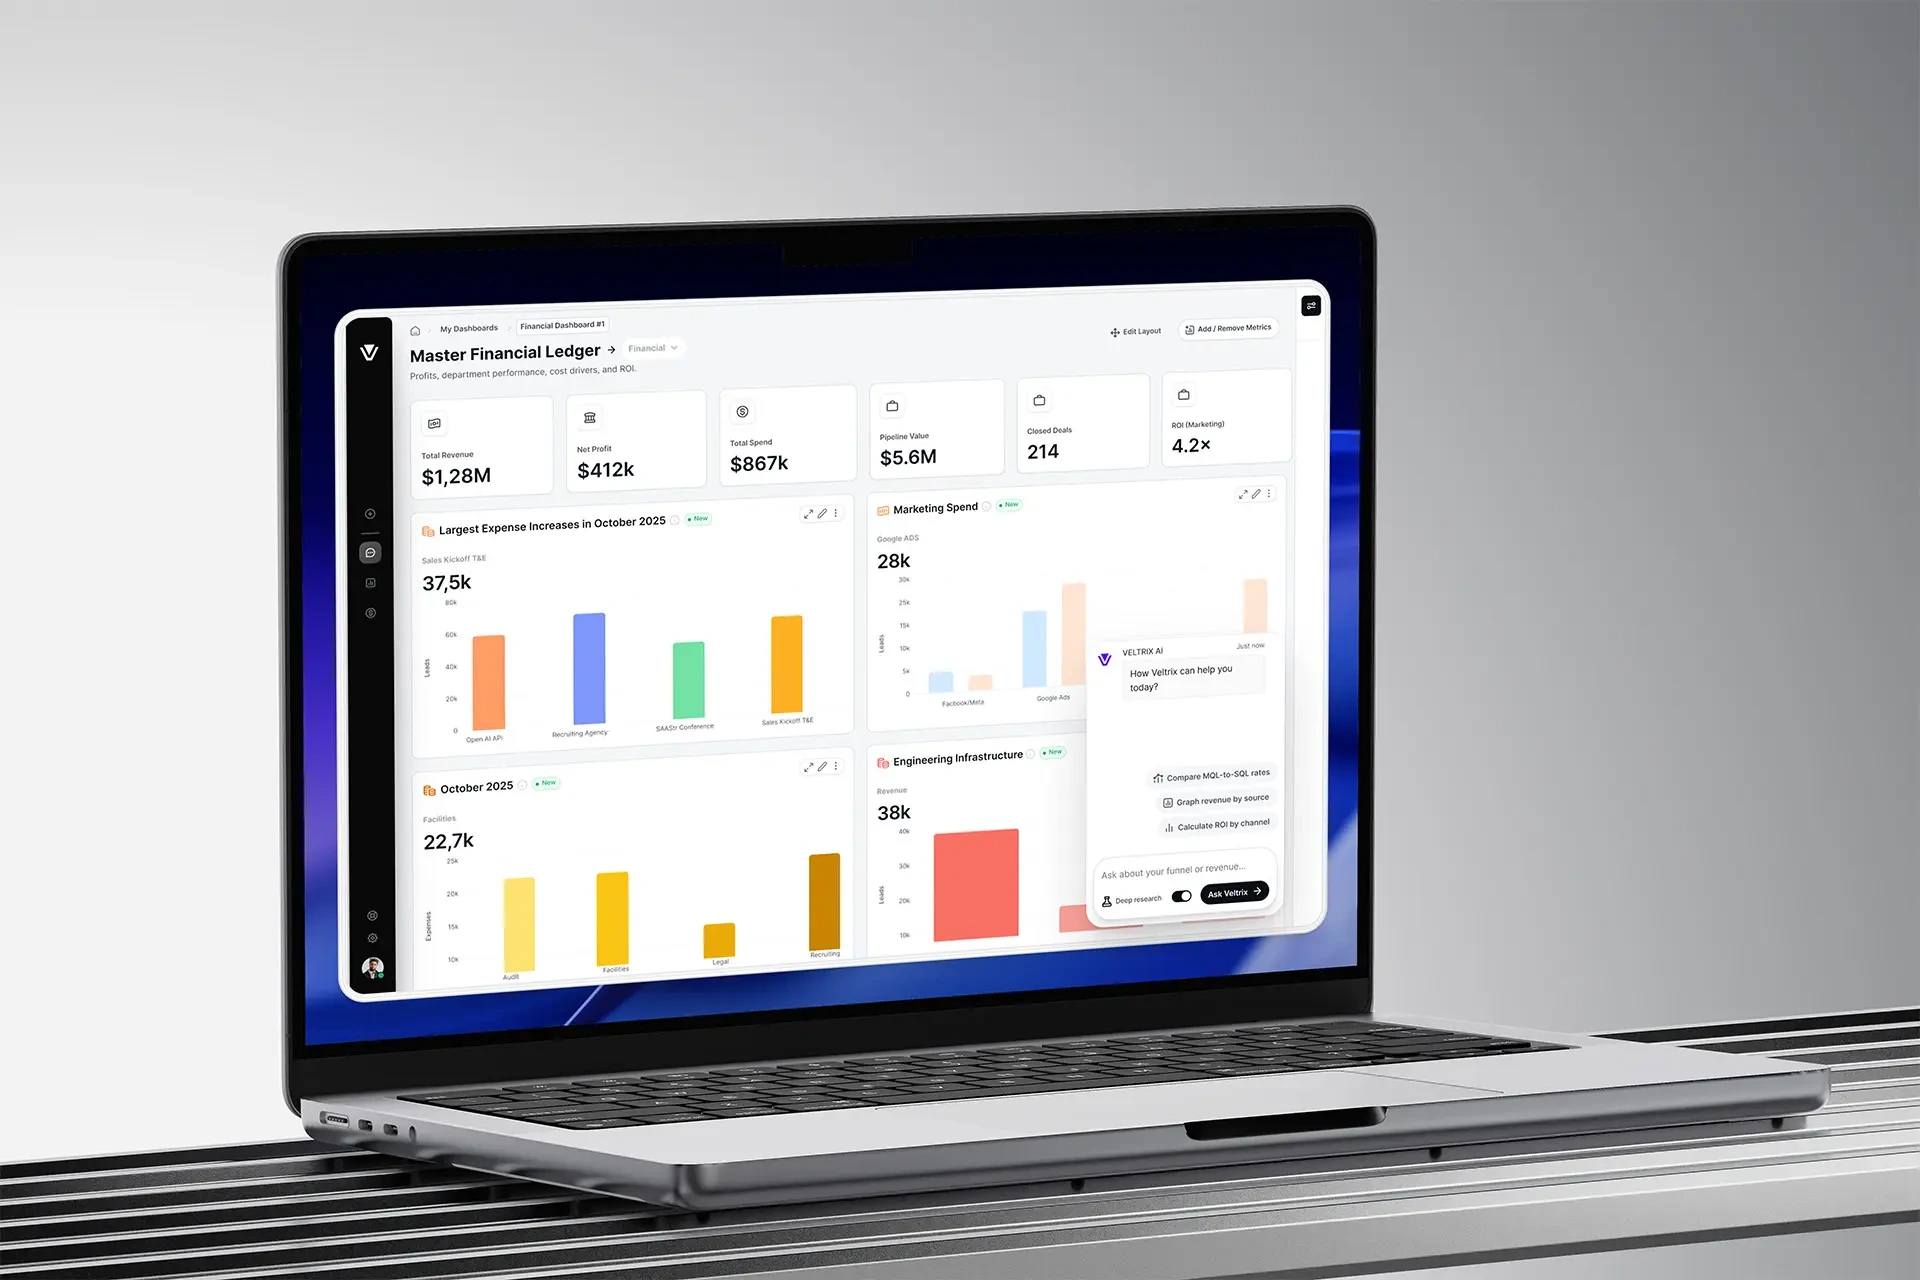
Lead with the answer, not the chart. Shipped an insight feed instead of a cross-tool dashboard. Riskier — the model had to commit to a claim — but a dashboard only re-creates the gap that made owners churn.
Design for the AI being wrong. One confident, incorrect insight burns trust permanently. Every insight is traceable: tap to see the numbers and the source tool. Lower-confidence insights are framed as questions. "Is this right?" support tickets dropped.
One next action, never three. A list of suggestions feels thorough but recreates decision paralysis. One prioritized action per insight, the rest behind "other options."
Solution
The product resolved to a single atomic unit — a claim, the evidence behind it, and one action — scaling from the marketing homepage to a phone. Progressive connect flow: the first connected tool produces a real insight immediately; the rest are invited later, in context.
Results
22% → 49% week-4 retention
< 3 min from connect to first real insight
2.2× retention lift for owners who reached an insight
1 prioritized action per insight
North-star metric: weekly insights acted on per active account — decisions changed, not charts viewed.
What I'd do differently
Bring the data scientist into discovery, not just delivery. Model fallibility was a core experience constraint; I treated it as an implementation detail until it bit us.
Like this project
Posted Aug 8, 2026
Sole designer, zero to launch: brand, marketing site, product UX and design system for an AI analytics platform. Week-4 retention went from 22% to 49%.
Likes
0
Views
2
Clients
Veltrix AI