NeoDash | SaaS Analytics Dashboard UI/UX Design

Ishan Lakhani


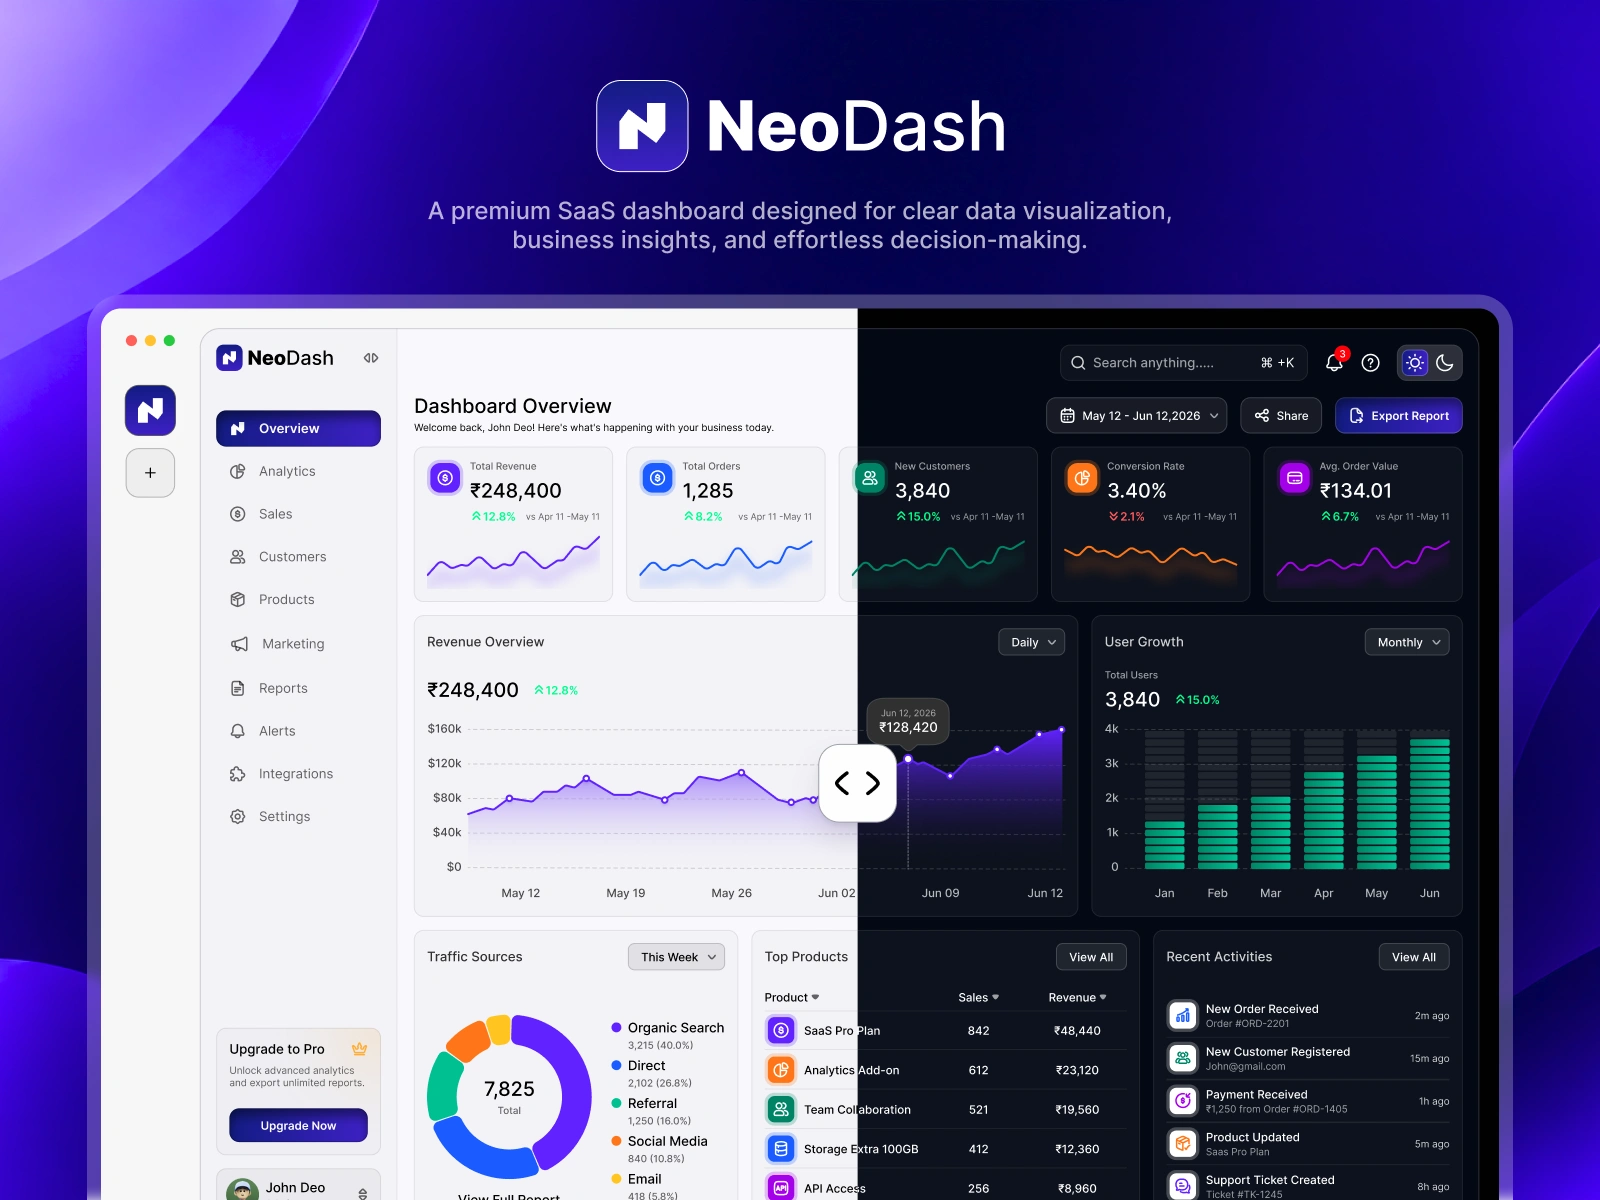
NeoDash is a self-initiated SaaS analytics dashboard concept designed to help business teams monitor key metrics, explore performance trends, and review operational data in one place.

The Challenge
Business dashboards can become difficult to scan when KPIs, charts, tables, and operational metrics compete for attention.
The goal of this concept was to explore how a clearer information hierarchy, consistent visual patterns, and organized data views could make important information easier to understand.

Design Goals
Make key performance indicators easy to scan.
Create a clear hierarchy between summary metrics and detailed analytics.
Organize charts, tables, and supporting information into consistent sections.
Maintain visual consistency across light and dark themes.

Design Approach
1. Information Hierarchy
I organized the interface around key metrics, analytical charts and supporting data tables to create a clear visual reading order.
2. Data Visualization
I explored chart layouts and visual distinctions to make different types of information easier to interpret.
3. Visual Consistency
I used a consistent approach to spacing, typography, colors and reusable UI elements to create a cohesive dashboard experience.


Key Dashboard Features
Overview & KPI Cards: A quick summary of important business metrics.
Revenue & Performance Analytics: Charts for exploring performance trends.
Customer Analytics: A dedicated area for customer-related data.
Operational Insights: Supporting information presented through structured tables and visualizations.


Deliverables:
High-fidelity dashboard UI in Figma
Light and dark theme concepts
KPI cards, charts, tables, and reusable UI components
My Role:
I worked on the concept, information structure, visual design, dashboard layouts, and presentation.
Outcome:
The project demonstrates my approach to organizing complex information into a clear dashboard interface. It also explores how consistent components and visual hierarchy can support easier data interpretation.
This is a self-initiated concept project, not a commissioned client project.

Like this project
Posted Oct 9, 2026
Self-initiated SaaS dashboard concept featuring KPI cards, data visualizations, light and dark modes, and reusable UI components in Figma.