Built with Jitter
Fathom: B2B Sales Analytics Dashboard

Robin Holesinsky
Verified


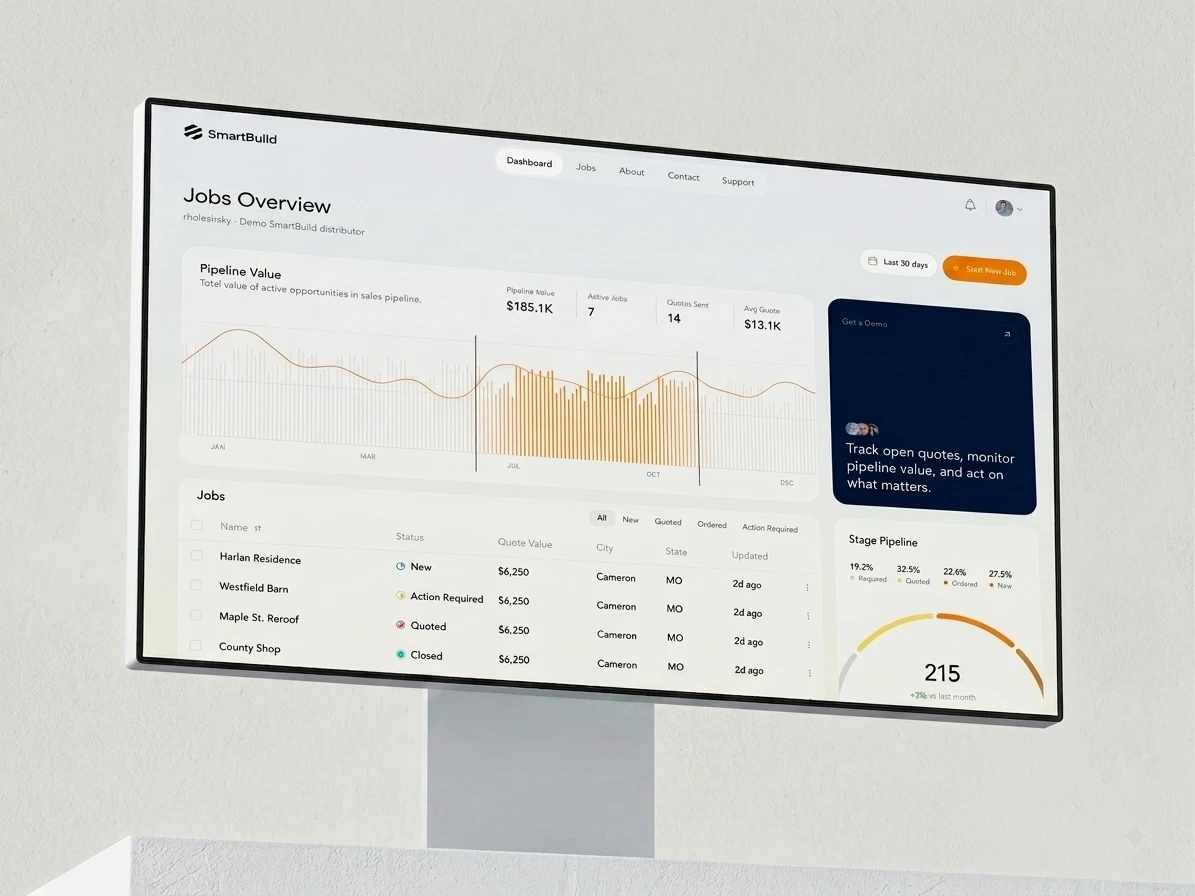
Sales Dashboard, Pipeline Overview (Phantom)
Pipeline dashboard concept for a B2B SaaS web app. The goal was to answer one question on load: what is in the pipeline right now, and what needs attention today.
Four headline metrics sit above the fold (pipeline value, active jobs, quotes sent, average quote), followed by a scrubbable timeline chart with hover tooltip and value average, a radial stage breakdown, and a filterable data table with status chips and bulk selection.
Two layout directions in one post. The first keeps the chart compact so the table starts higher. The second gives the timeline full width with a smoothed trend line over the bars, and moves the stage gauge into the sidebar with percentage splits and a month-over-month delta.
Light UI, soft depth, single orange accent doing all the emphasis work. Designed in Figma.
Open for new work.
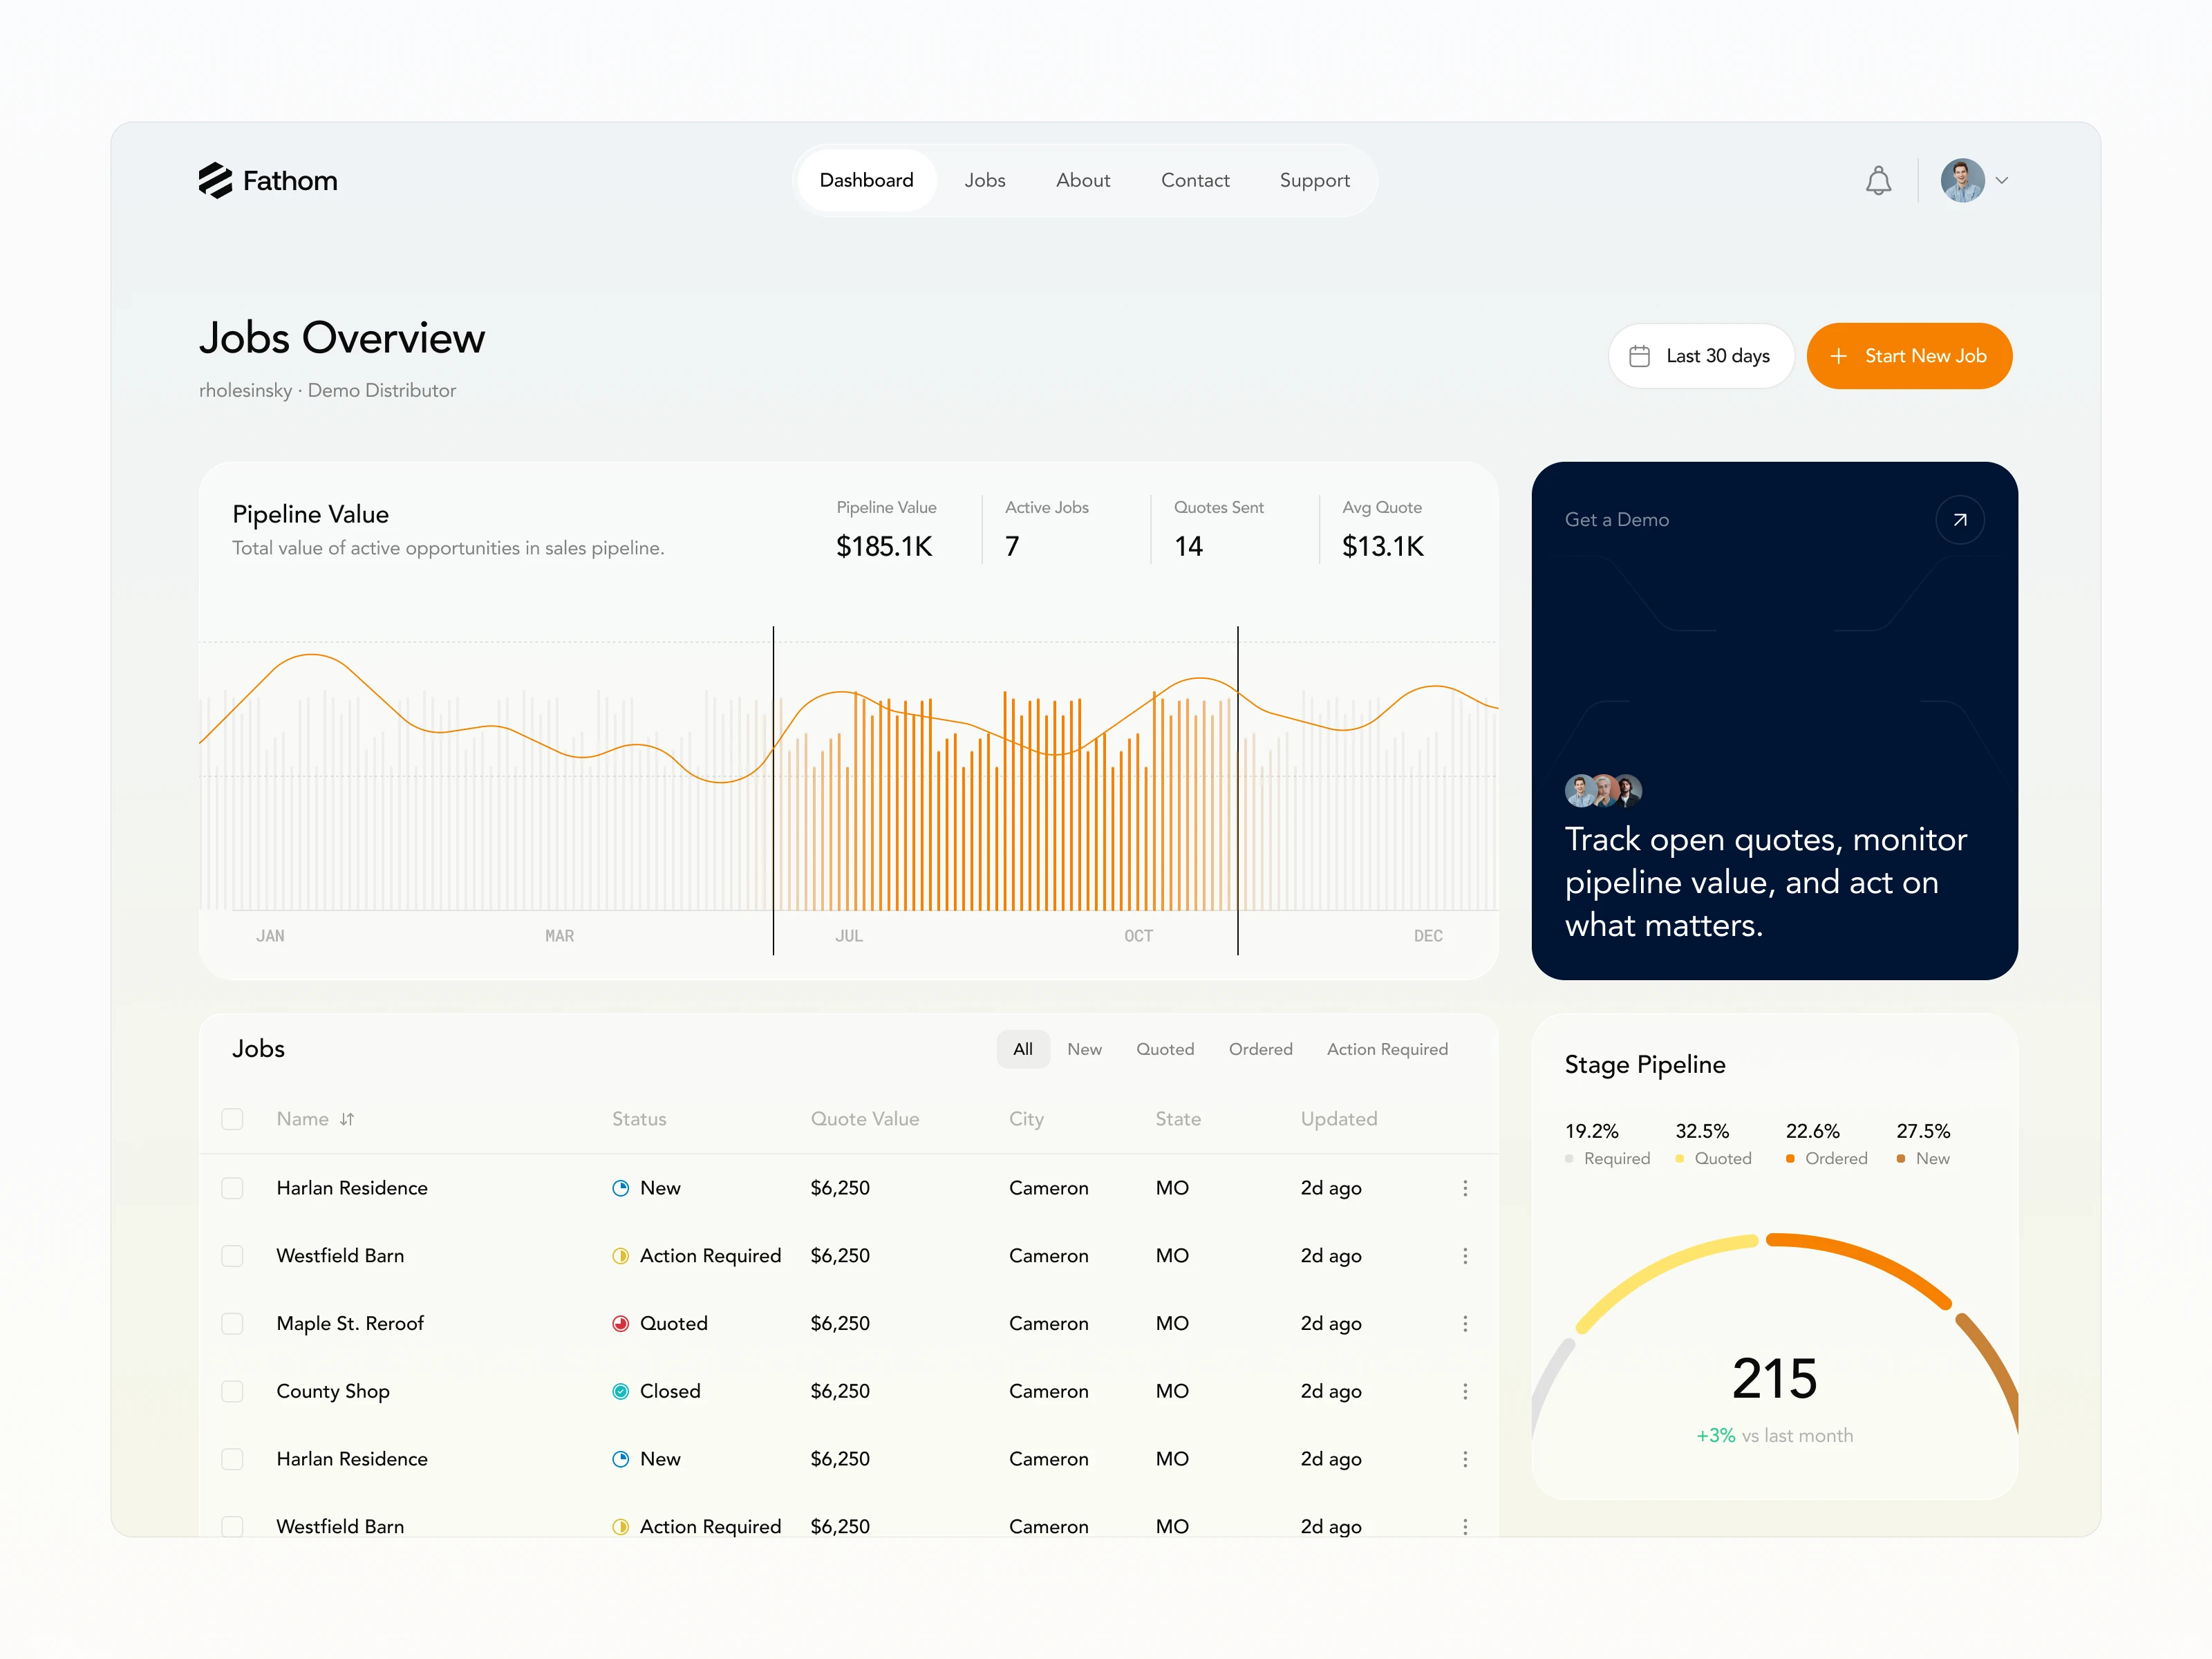
Pipeline overview
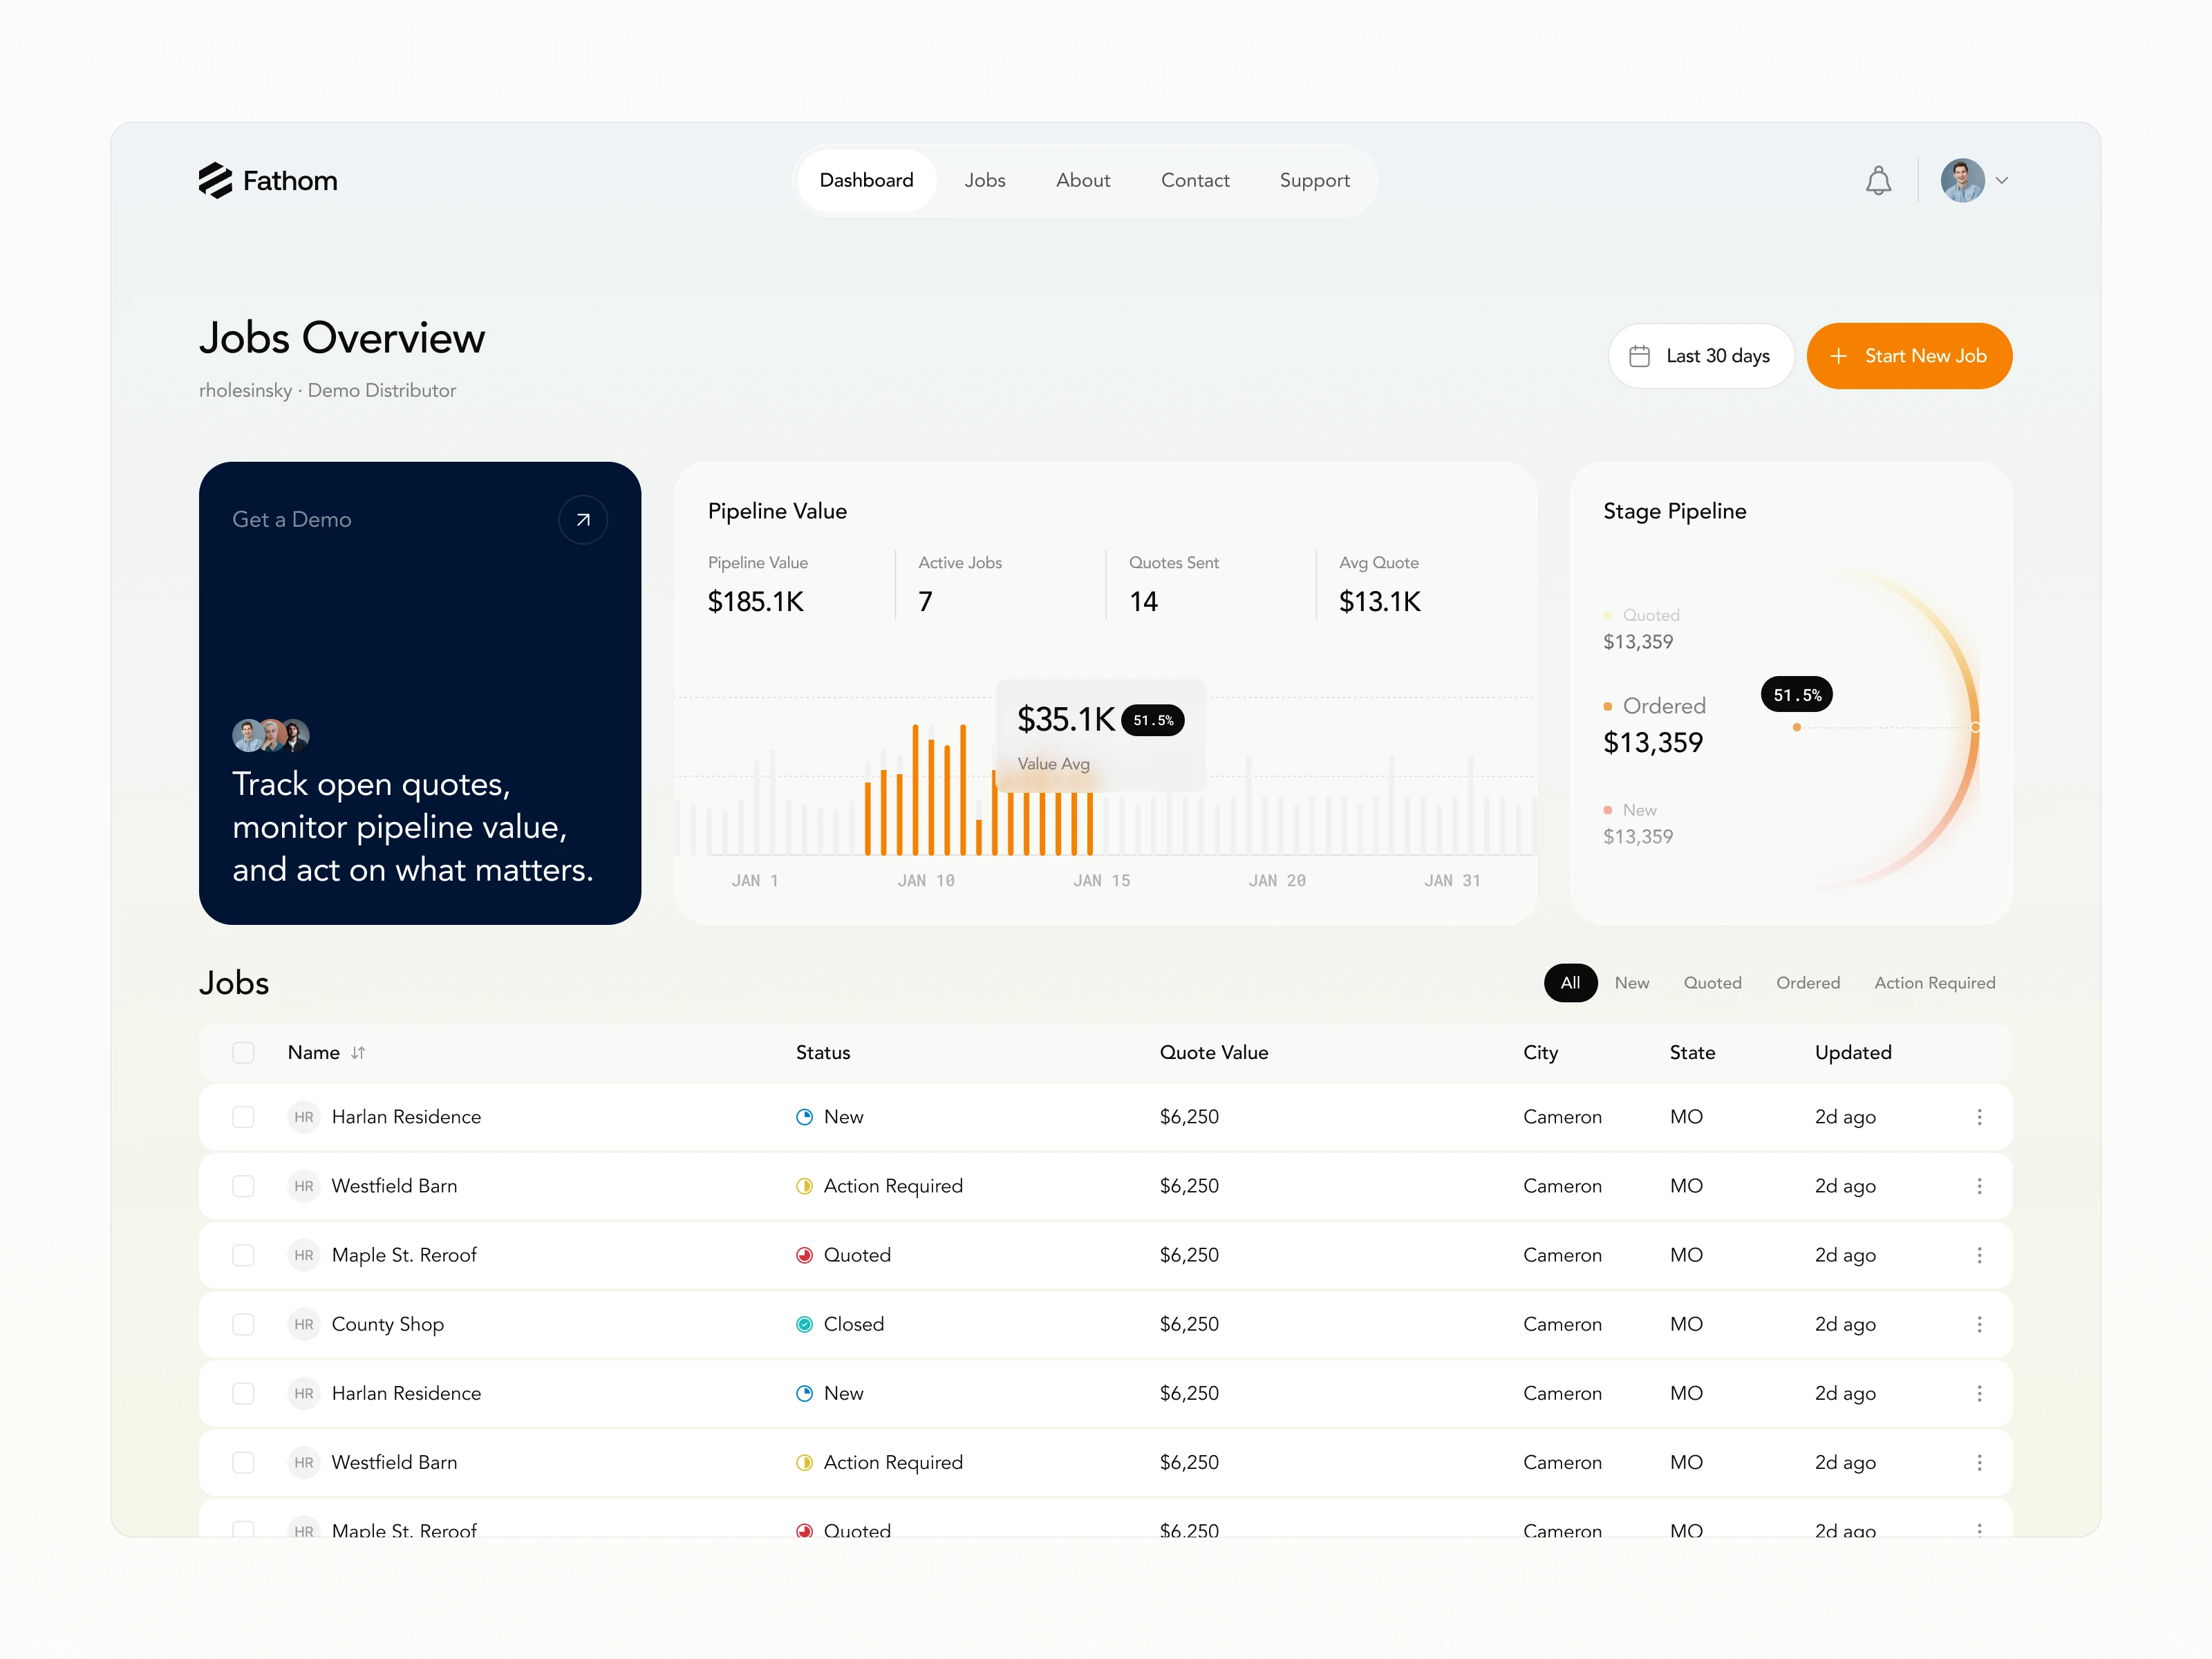
Pipeline overview v2
Like this project
Posted Aug 20, 2026
Sales analytics dashboard for a B2B SaaS. Pipeline value over time, quote KPIs, stage breakdown and a filterable jobs table in one overview screen.
Likes
1
Views
24