A Power BI dashboard created

Daryll Bensley


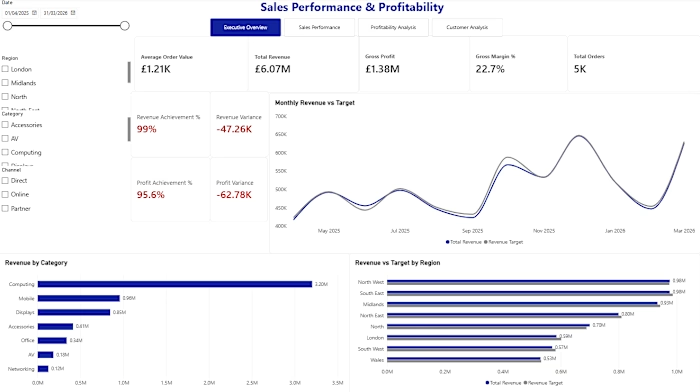
A Power BI dashboard created to analyse sales performance for a fictional small business.
The dashboard provides an overview of revenue, gross margin, orders and average order value, with interactive filters for region, sales channel and product.
It also includes monthly revenue trends and breakdowns by region, product and sales channel, making it easier to identify performance trends and compare results.
Like this project
Posted Aug 29, 2026
A Power BI dashboard created to analyse sales performance for a fictional small business. The dashboard provides an overview of revenue, gross margin, orders...
Likes
0
Views
1