Sales Performance & Profitability Dashboard

Daryll Bensley
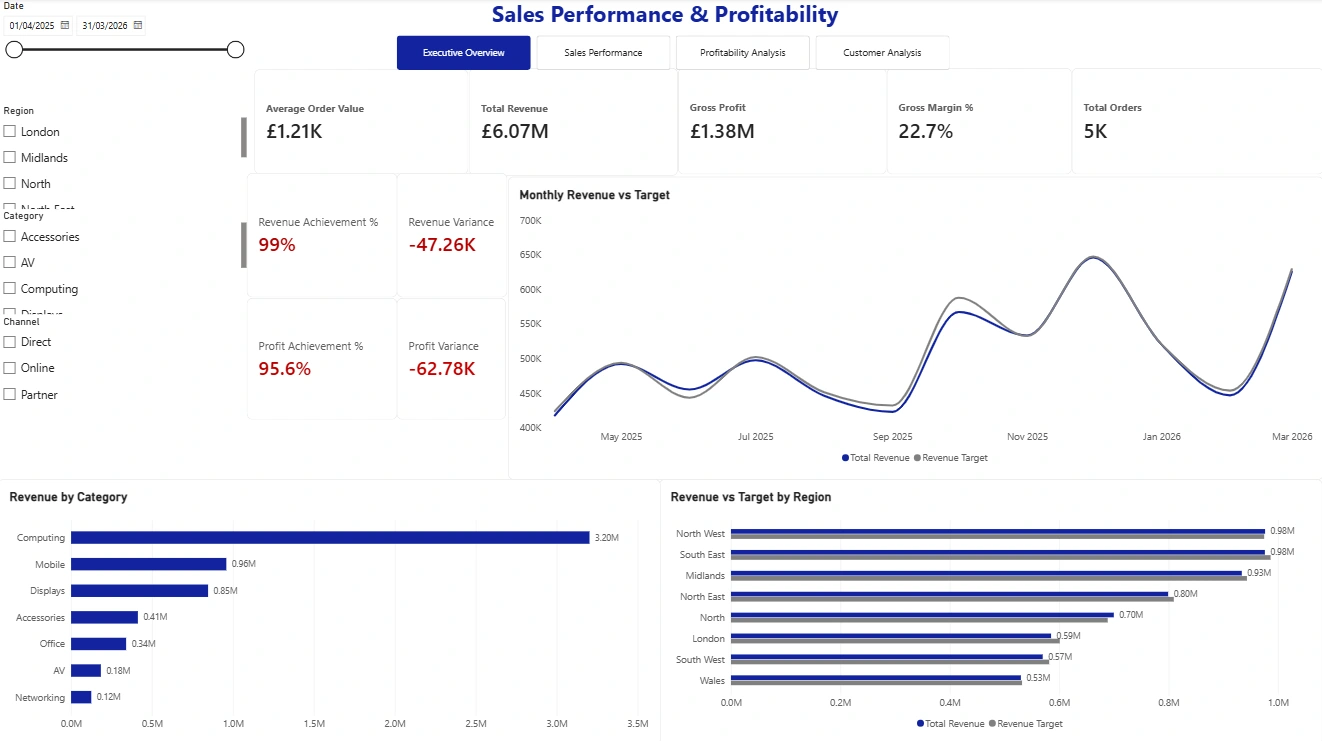
Sales Performance & Profitability Dashboard
Spec project for a small-business reporting scenario.
The brief
Create a clear reporting experience that helps a manager explore sales performance, profitability, targets, products, and customers without digging through spreadsheets.
What I built
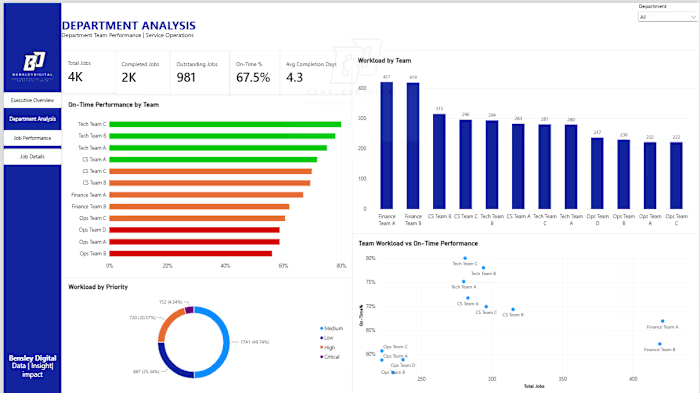
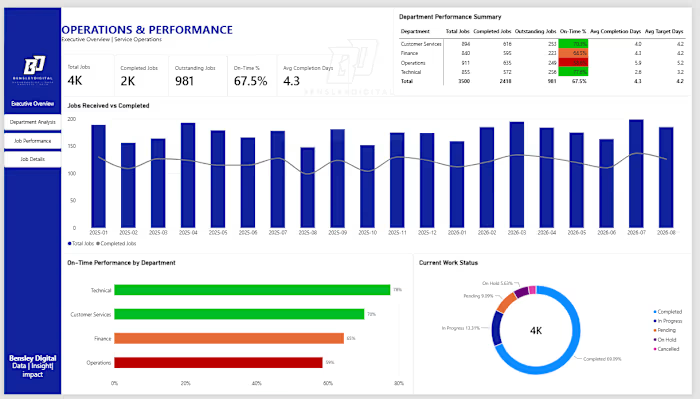
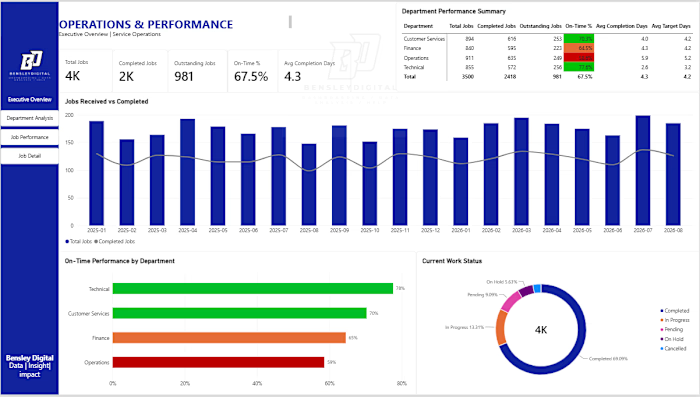
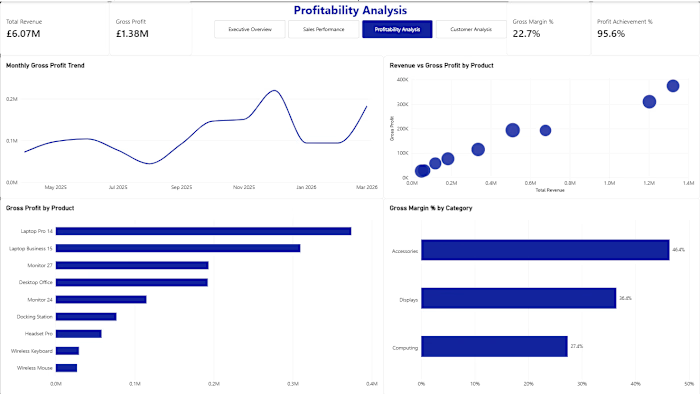
A 4-page interactive Power BI report covering:
Revenue and gross profit
Actual-versus-target performance
Sales performance by period and category
Product and customer analysis
The report uses interactive filters, cross-filtering, Top N analysis, dynamic tooltips, and 20+ DAX measures so users can move from a high-level view to the detail behind it.
Approach
I structured the report around the questions a manager is likely to ask first: What are we selling? Is it profitable? Are we on target? Which products and customers are driving the result?
The aim was a clean, practical dashboard that supports quick decisions and makes business data easier to explore.
Tools
Power BI and DAX.
Like this project
Posted Sep 7, 2026
A fictional 4-page Power BI dashboard for exploring sales, profit, targets, products, and customers.
Likes
0
Views
2