Data Visualization for NWA Research
Merve Okutan
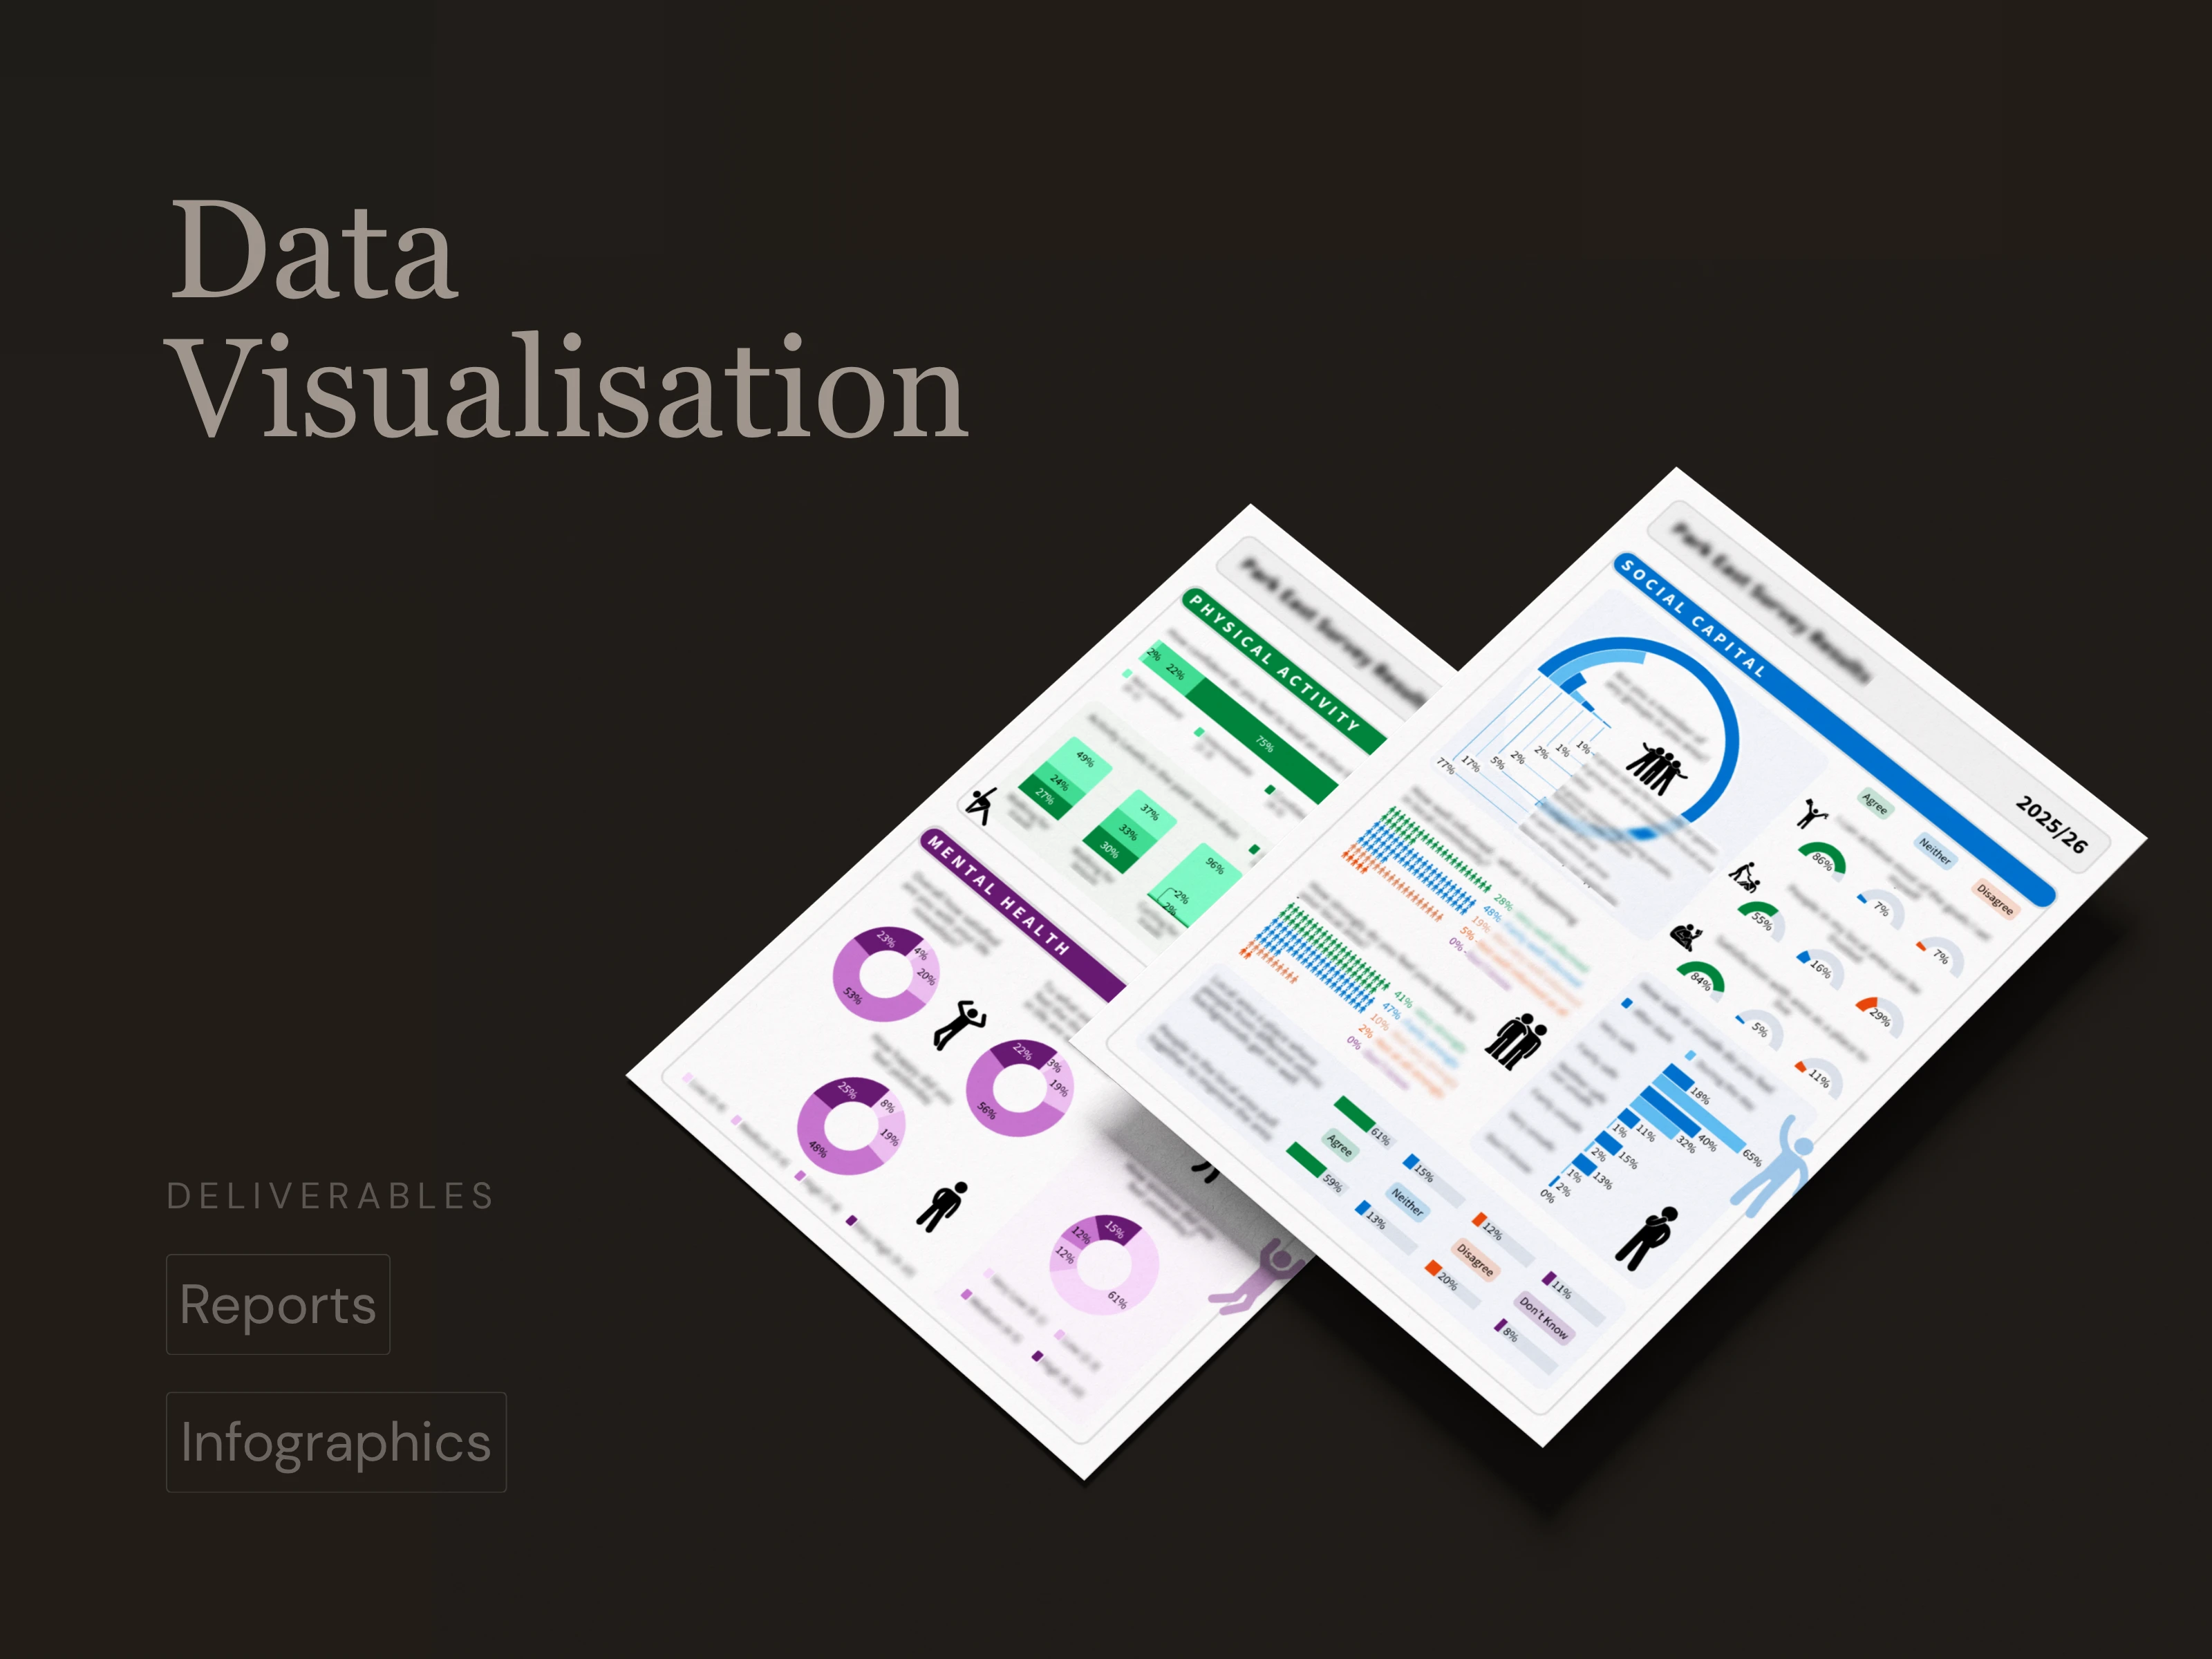
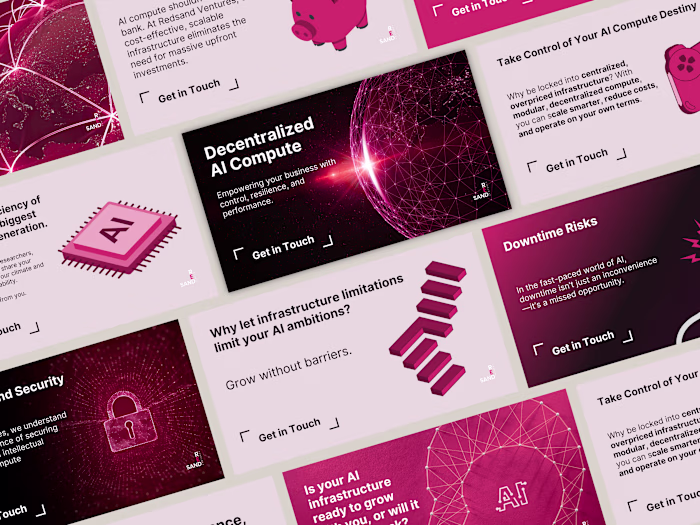
Data Visualisation & Public Communications
Client: NWA Research
Industry: Social Market Research
Year: 2022-Present
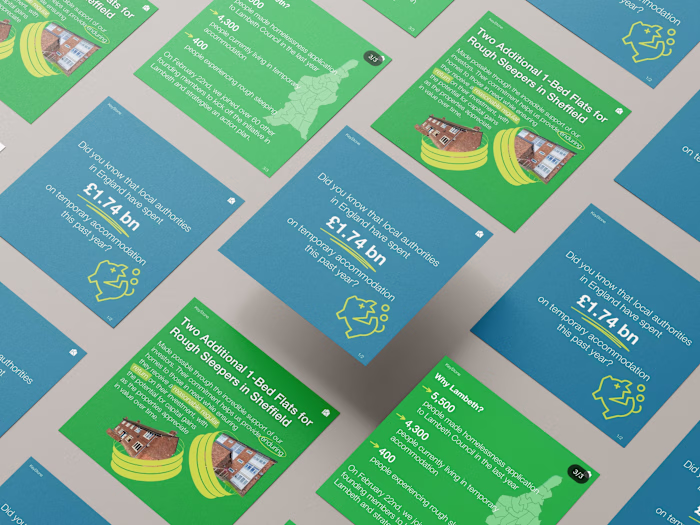
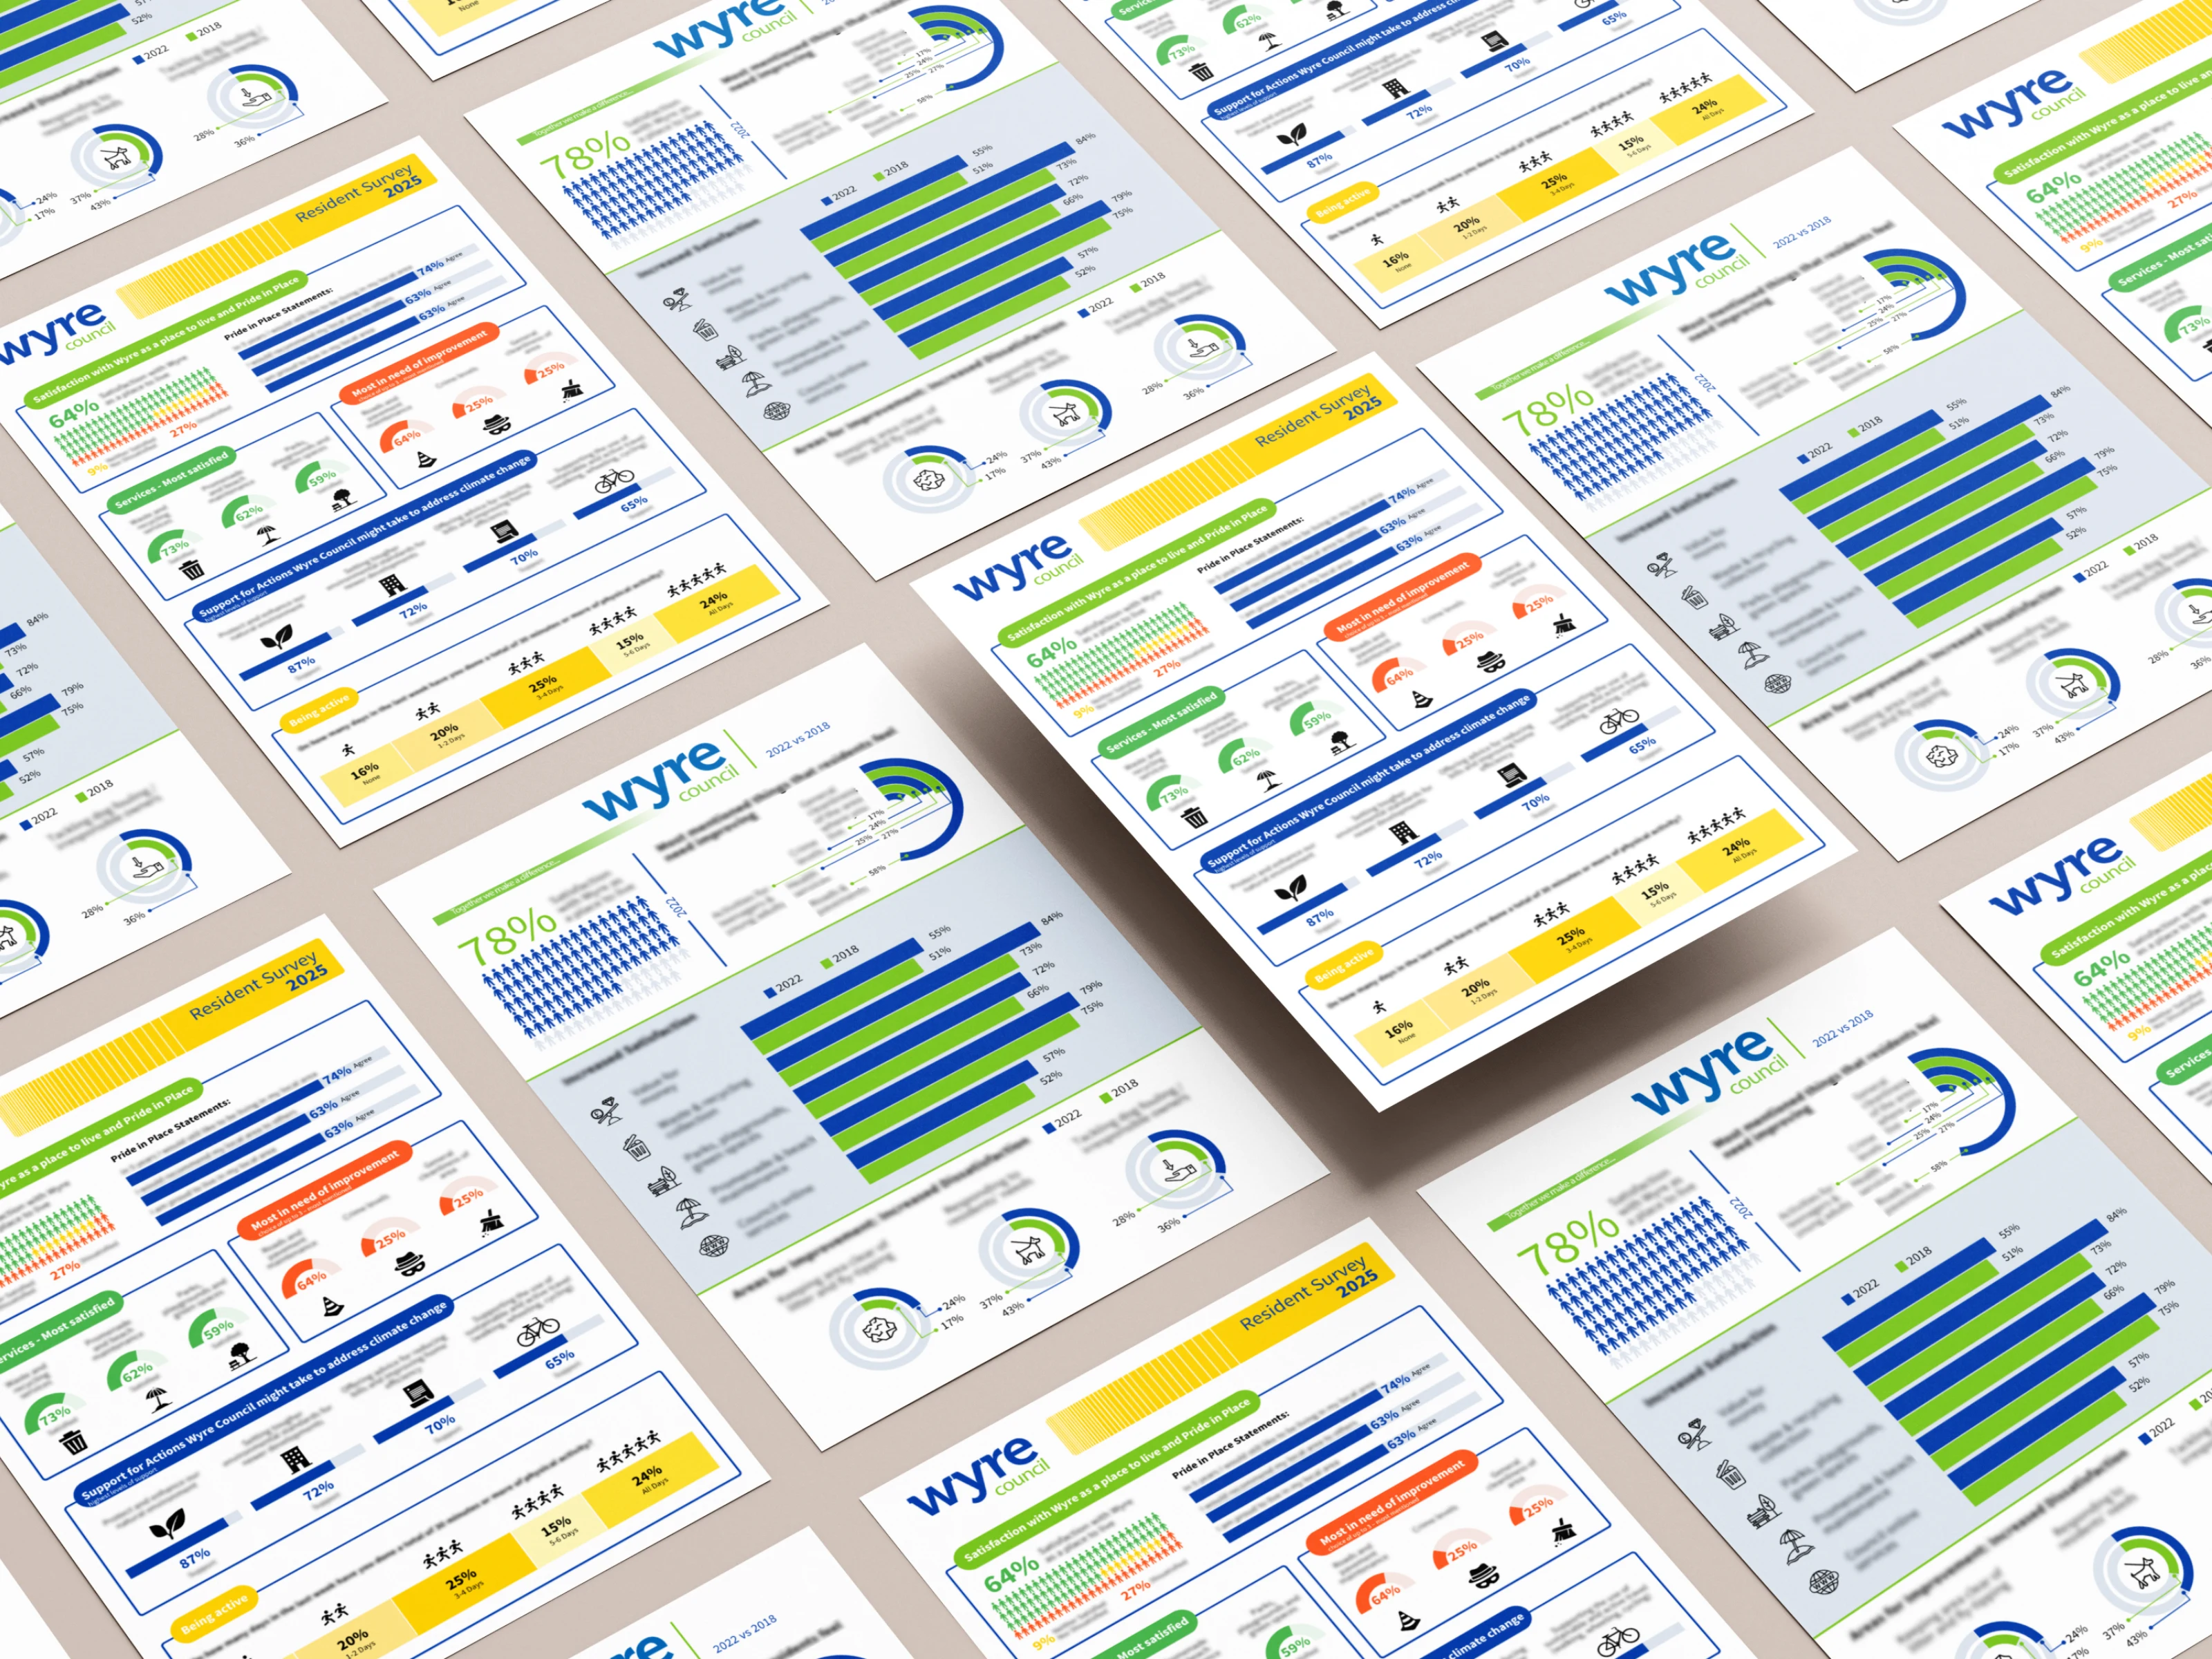
Need: NWA Research works with local authorities across the UK, producing social research that needs to reach and resonate with a wide range of audiences, from council decision-makers to the general public. They needed someone who could take complex data and make it useful to the people receiving it.
The Challenge
Raw survey data, however rigorous, rarely communicates itself. The challenge is to present findings in a way that is clear and accessible without oversimplifying the research. For a company whose clients return year after year to track change over time, consistency and credibility in that presentation matters.
The Work
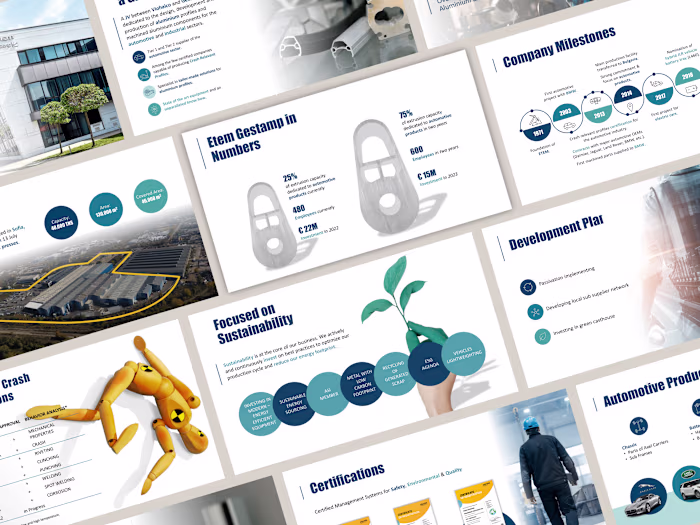
An ongoing collaboration spanning several years, covering infographics, reports, and presentations across multiple research projects. The data comes from NWA Research; the structure, framing, and visual language is built from the ground up. That means deciding how findings are organised, how key insights are surfaced, and how the output reads to its intended audience, whether that's a council committee or the general public.
Excellent work - flexible and inventive in her approach. Much impressed and will work with her again.”
-Norma, NWA Research
The Outcome
Local authorities have returned year after year for longitudinal comparisons, with the visual outputs becoming embedded in how they track and communicate public data over time. The collaboration is ongoing.
Working with complex data that needs to reach a wider audience? Let's make it land.
Like this project
Posted Jun 17, 2026
Developed data visualization for social research to aid local authorities.