ClearMetric Web Analytics Platform Development

Devowise Studios


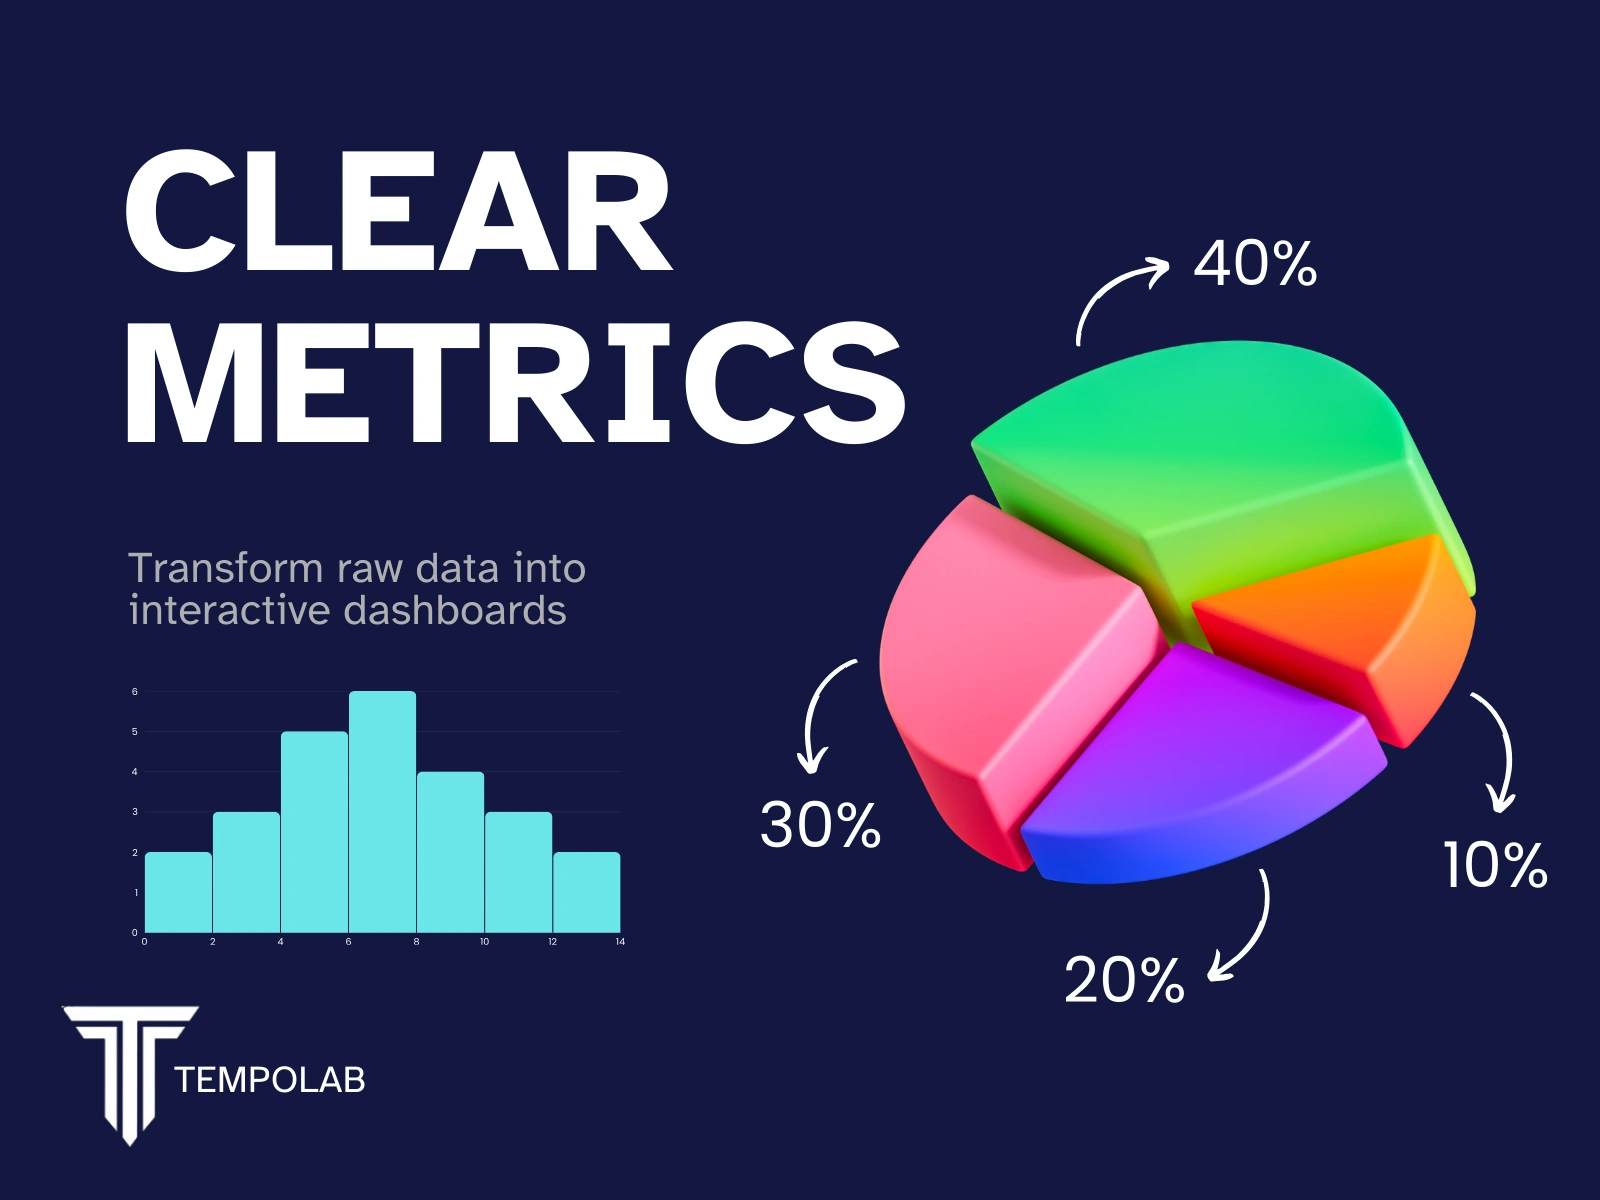
ClearMetric — Building an AI-Powered Analytics Dashboard with TempoLabs
Overview
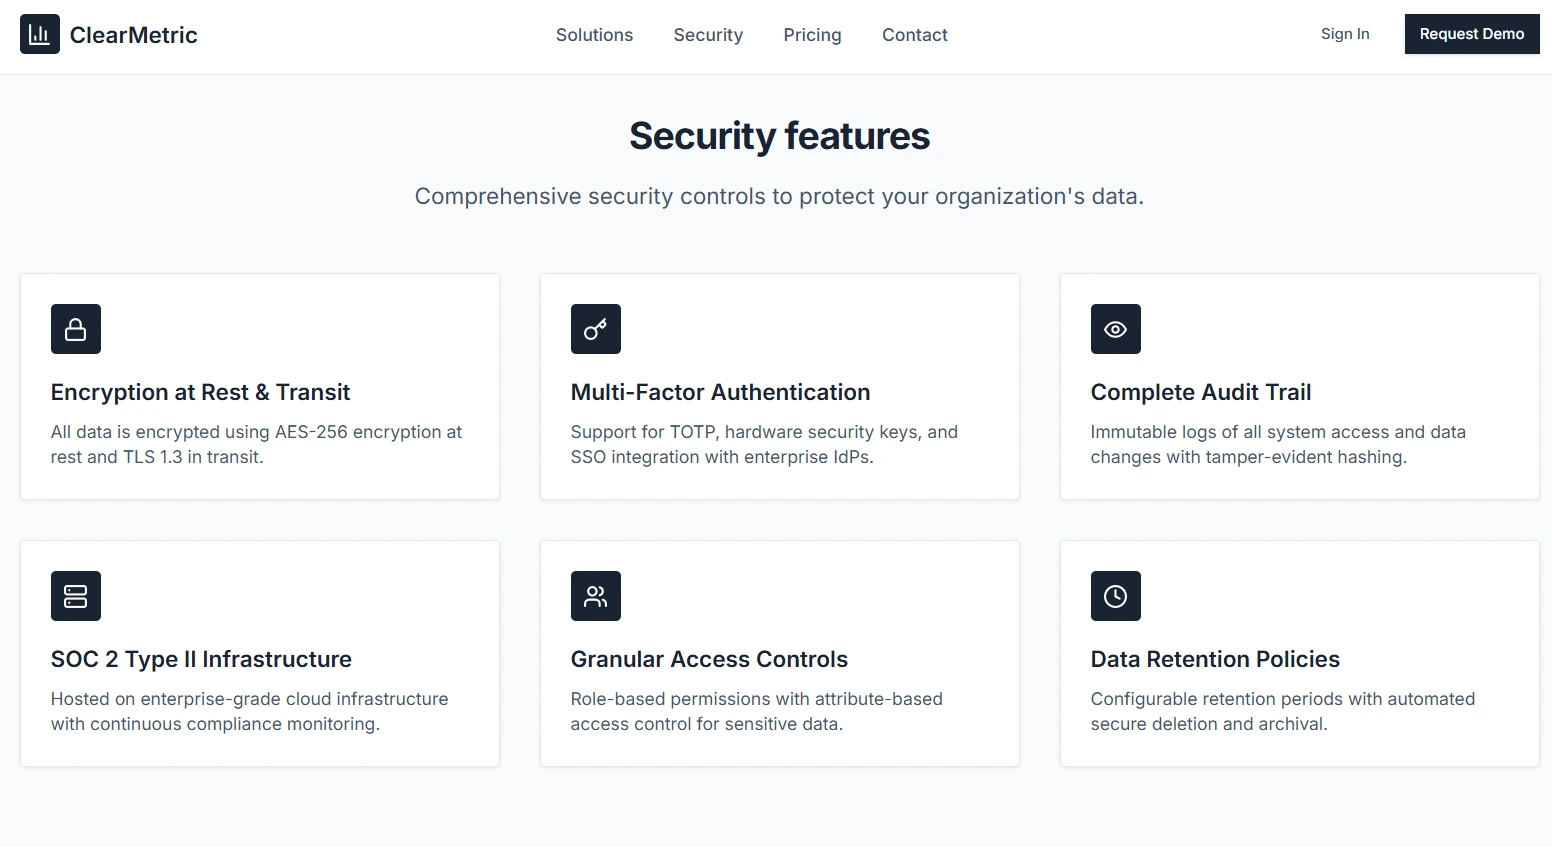
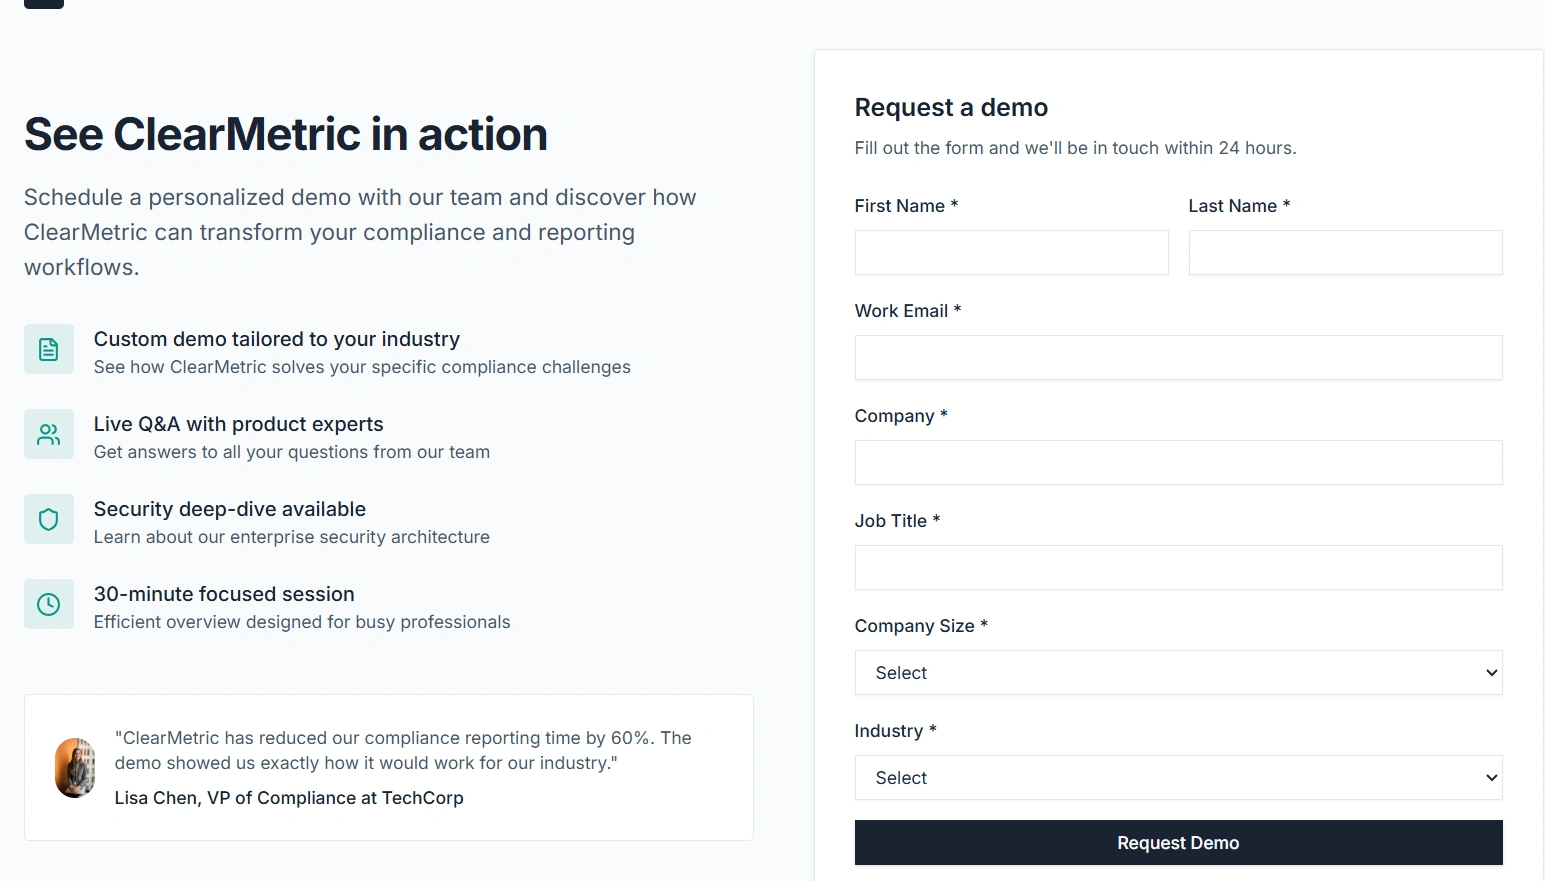
At Devowise Studios, we designed and developed ClearMetric, a modern web analytics platform that helps businesses monitor, visualize, and analyze key performance metrics through an intuitive, real-time dashboard experience.
Built entirely with TempoLabs, the project demonstrates how AI-assisted development can accelerate the creation of production-ready web applications without compromising usability, scalability, or design quality. From structured prompt engineering to responsive interface design, every stage of the application was guided through an iterative AI-driven workflow.
The platform combines interactive data visualization, modular UI architecture, and responsive layouts to provide businesses with actionable insights while showcasing the potential of modern AI-powered development.
The Challenge
Business intelligence platforms often present complex datasets that can overwhelm users without thoughtful organization and intuitive interactions. At the same time, rapidly building feature-rich dashboards traditionally requires significant development effort.
Our challenge was to create a platform that would:
Present business metrics through clear and intuitive visualizations.
Simplify complex analytical workflows with a clean user experience.
Demonstrate the capabilities of AI-assisted application development.
Deliver responsive performance across desktop, tablet, and mobile devices.
Build a scalable dashboard architecture capable of supporting future datasets and reporting features.
Project Objectives
To achieve these goals, we focused on:
Creating a modern analytics dashboard with intuitive navigation.
Designing reusable UI components for scalability.
Visualizing business data through interactive charts and reports.
Leveraging AI-assisted development to accelerate production.
Building responsive layouts optimized for every device.
Creating a flexible foundation for future analytics and reporting capabilities.
Our Role
Our team led the project from concept through deployment, including:
Product Strategy
UX Strategy
Prompt Engineering
Information Architecture
Dashboard Design
UI Design
AI-Assisted Development
Responsive Development
Data Visualization Design
Quality Assurance
Deployment Validation
Our Process
1. Discovery & Prompt Strategy
The project began by defining business objectives, user roles, reporting requirements, and dashboard workflows.
Detailed prompts were created within TempoLabs to establish the application's structure, navigation, dashboard components, routing logic, and interactive behaviors. This planning stage ensured the AI-generated foundation aligned with both business goals and user expectations.
The experience follows a structured progression:
Sign In → Monitor → Analyze → Take Action
2. Information Architecture
A clear content hierarchy was designed to help users quickly understand business performance without unnecessary complexity.
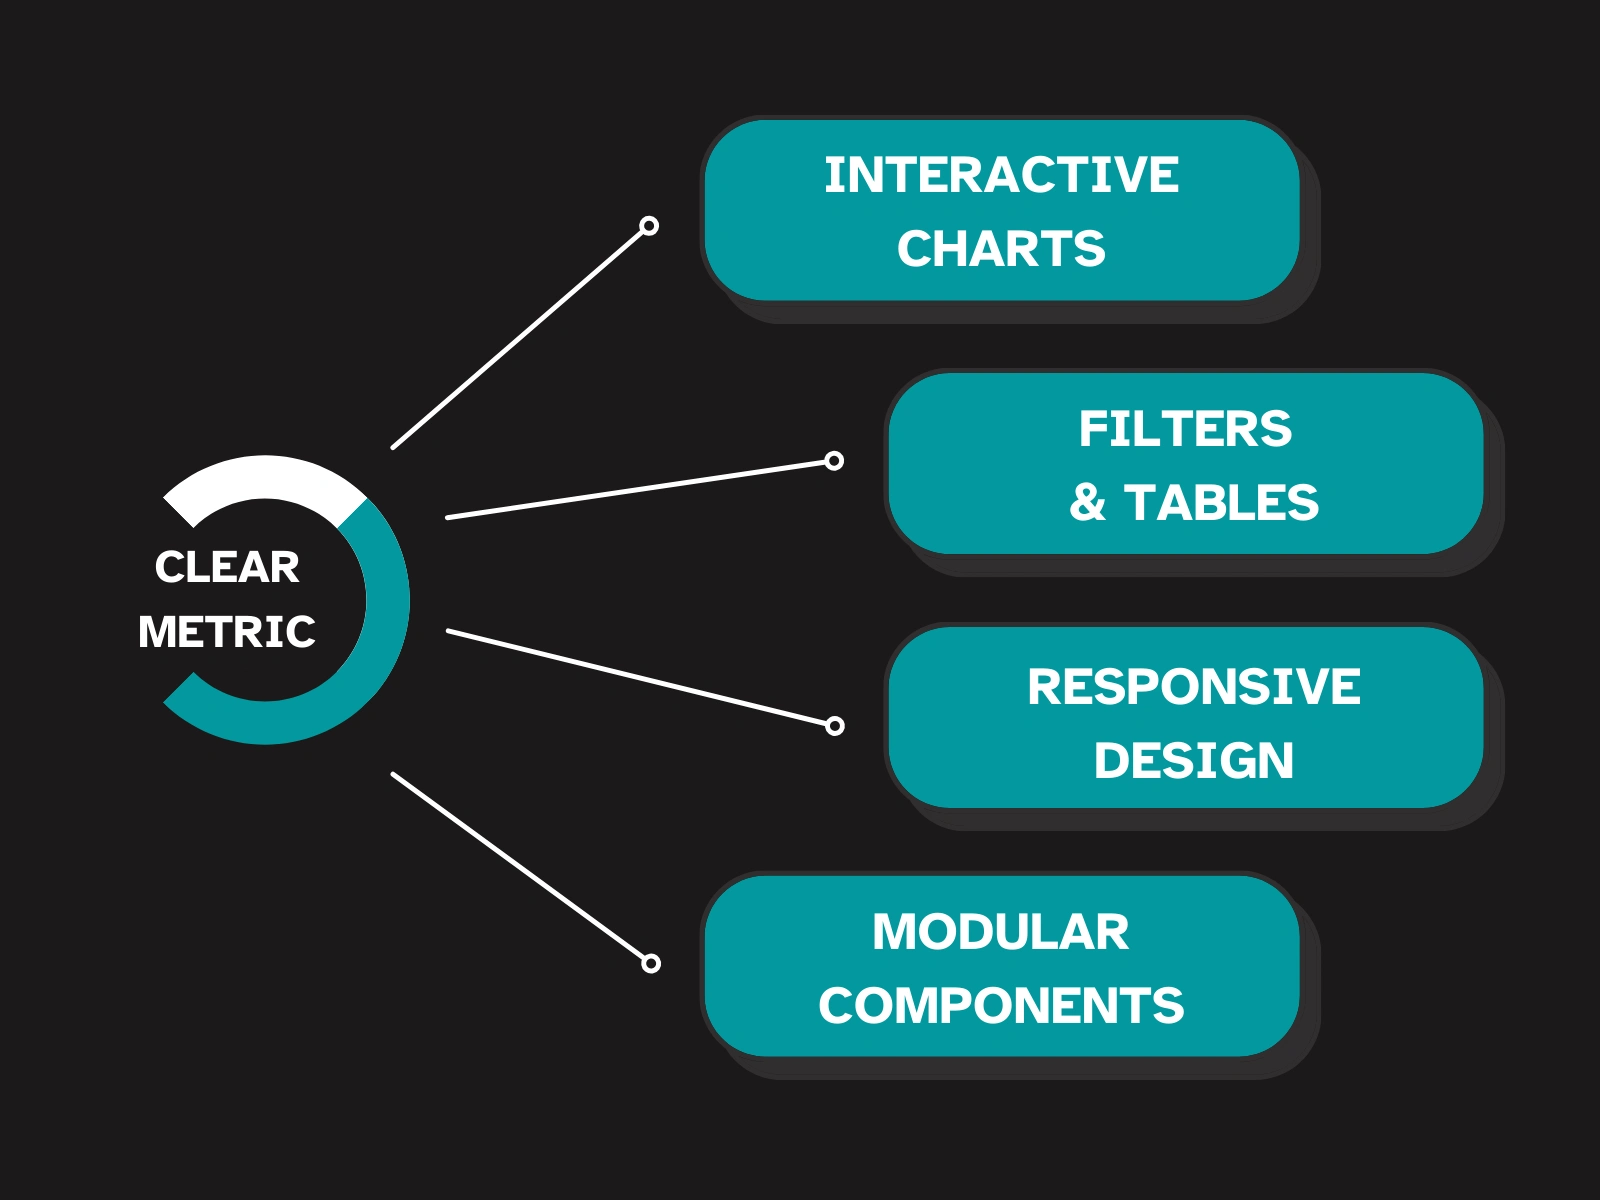
Dashboard widgets, charts, filters, reports, and data tables were organized into modular sections that allow users to monitor key metrics, explore trends, and access actionable insights efficiently.
3. AI-Assisted Development
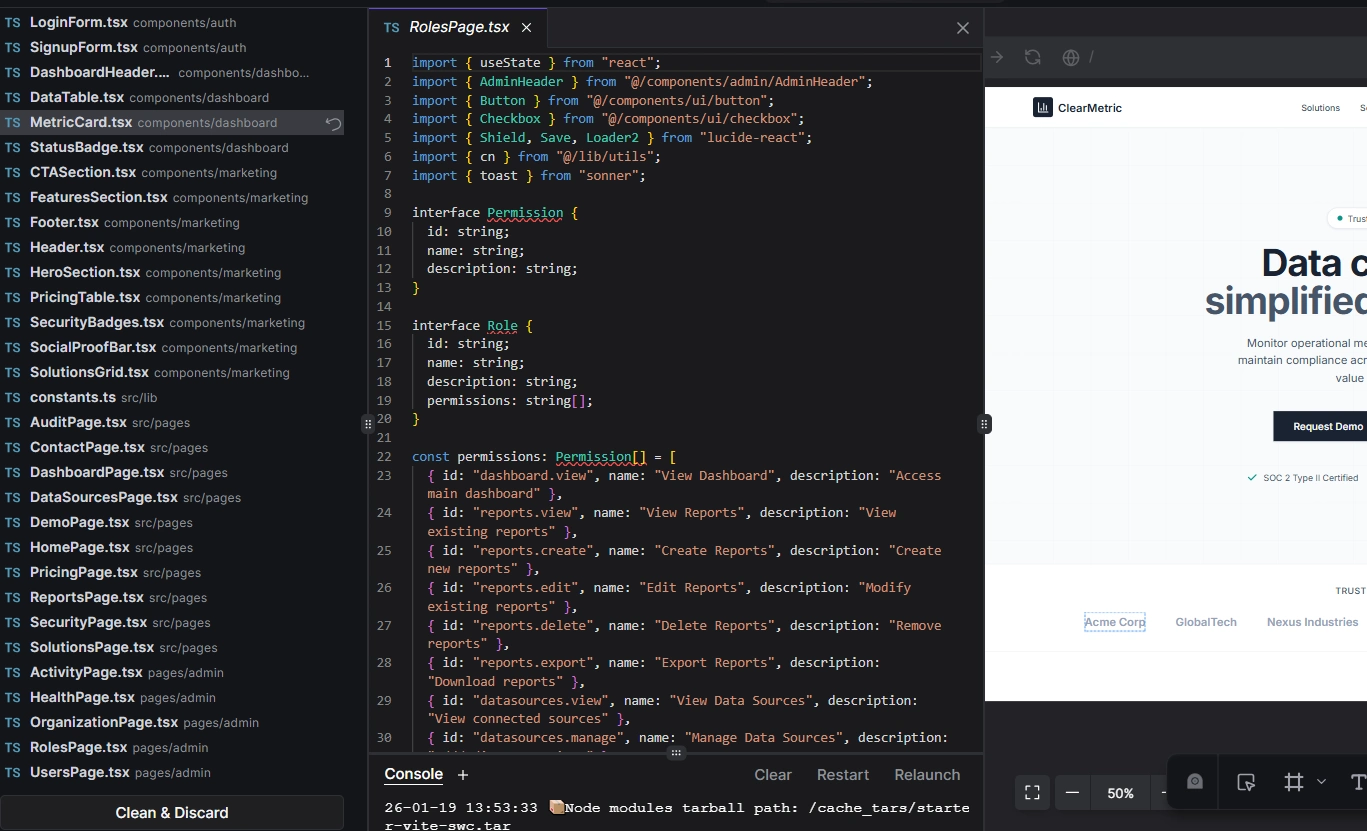
TempoLabs generated the initial React application based on carefully structured prompts, producing a complete project scaffold including navigation, pages, reusable components, and dashboard layouts.
The application was then refined through iterative prompt improvements, allowing the interface, interactions, and responsive behavior to evolve without traditional manual implementation. This iterative workflow accelerated development while maintaining a polished user experience.
4. Dashboard Experience & Optimization
Interactive charts, data tables, and filtering mechanisms were incorporated to support real-time exploration of business metrics.
The platform was thoroughly tested within the TempoLabs environment to ensure responsive layouts, smooth interactions, and consistent functionality across desktop, tablet, and mobile devices.
Key Features
The completed platform includes:
Secure user authentication.
Interactive analytics dashboard.
Dynamic charts and data visualizations.
Searchable and filterable reporting tables.
Real-time business performance insights.
Responsive layouts optimized for all devices.
Modular component architecture for future expansion.
AI-generated application foundation with iterative refinement.
Flexible dashboard structure capable of supporting additional reports and datasets.
Technology Stack
Frontend
React
Vite
Tailwind CSS
AI Development Platform
TempoLabs
Data Management
JSON Mock Data
API Integration
Data Visualization
Chart.js / D3.js
Development Architecture
Modular React Components
Responsive UI System
Outcome
The final application delivers a modern analytics platform that combines responsive design, interactive reporting, and AI-assisted development into a scalable business intelligence solution.
Key outcomes include:
A streamlined dashboard experience that improves data accessibility.
Interactive visualizations that simplify analytical decision-making.
Accelerated development through structured prompt engineering and AI-generated code.
Responsive performance optimized across desktop, tablet, and mobile devices.
A scalable application architecture prepared for future analytics, integrations, and reporting features.
Key Takeaways
ClearMetric demonstrates how AI-assisted development can significantly accelerate the creation of sophisticated business applications while maintaining high standards of usability and interface quality.
By combining thoughtful prompt engineering, modular React architecture, interactive data visualization, and responsive design, we created an analytics platform that transforms complex business data into clear, actionable insights—showcasing how modern AI workflows can complement traditional product design and development.
Like this project
Posted Jan 19, 2026
ClearMetric is a TempoLabs AI-generated analytics dashboard transforming data into interactive charts, filters, and production-ready web workflows
Likes
1
Views
11