A business-focused infographic and data
Bhaskar Tiwary
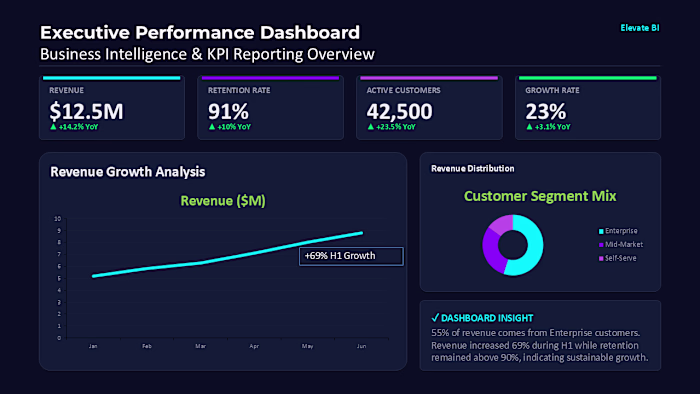
A business-focused infographic and data visualization project designed to simplify key startup KPIs through clear visual storytelling. This project explains essential metrics such as CAC, LTV, MRR, Churn Rate, and Conversion Rate using dashboard elements, process flows, and executive reporting layouts. The goal was to transform complex business data into actionable insights that are easy to understand and communicate.
Like this project
Posted Jun 5, 2026
A business-focused infographic and data visualization project designed to simplify key startup KPIs through clear visual storytelling. This project explains ...