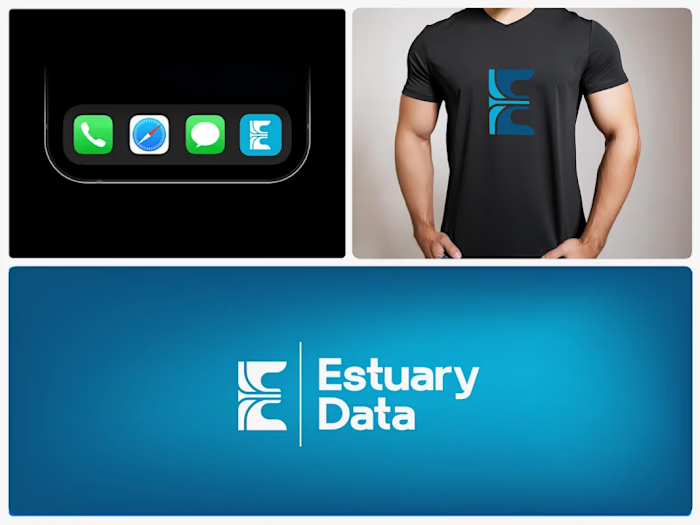
Estuary Data | Brand Identity for a Data SaaS

Bilal Haider




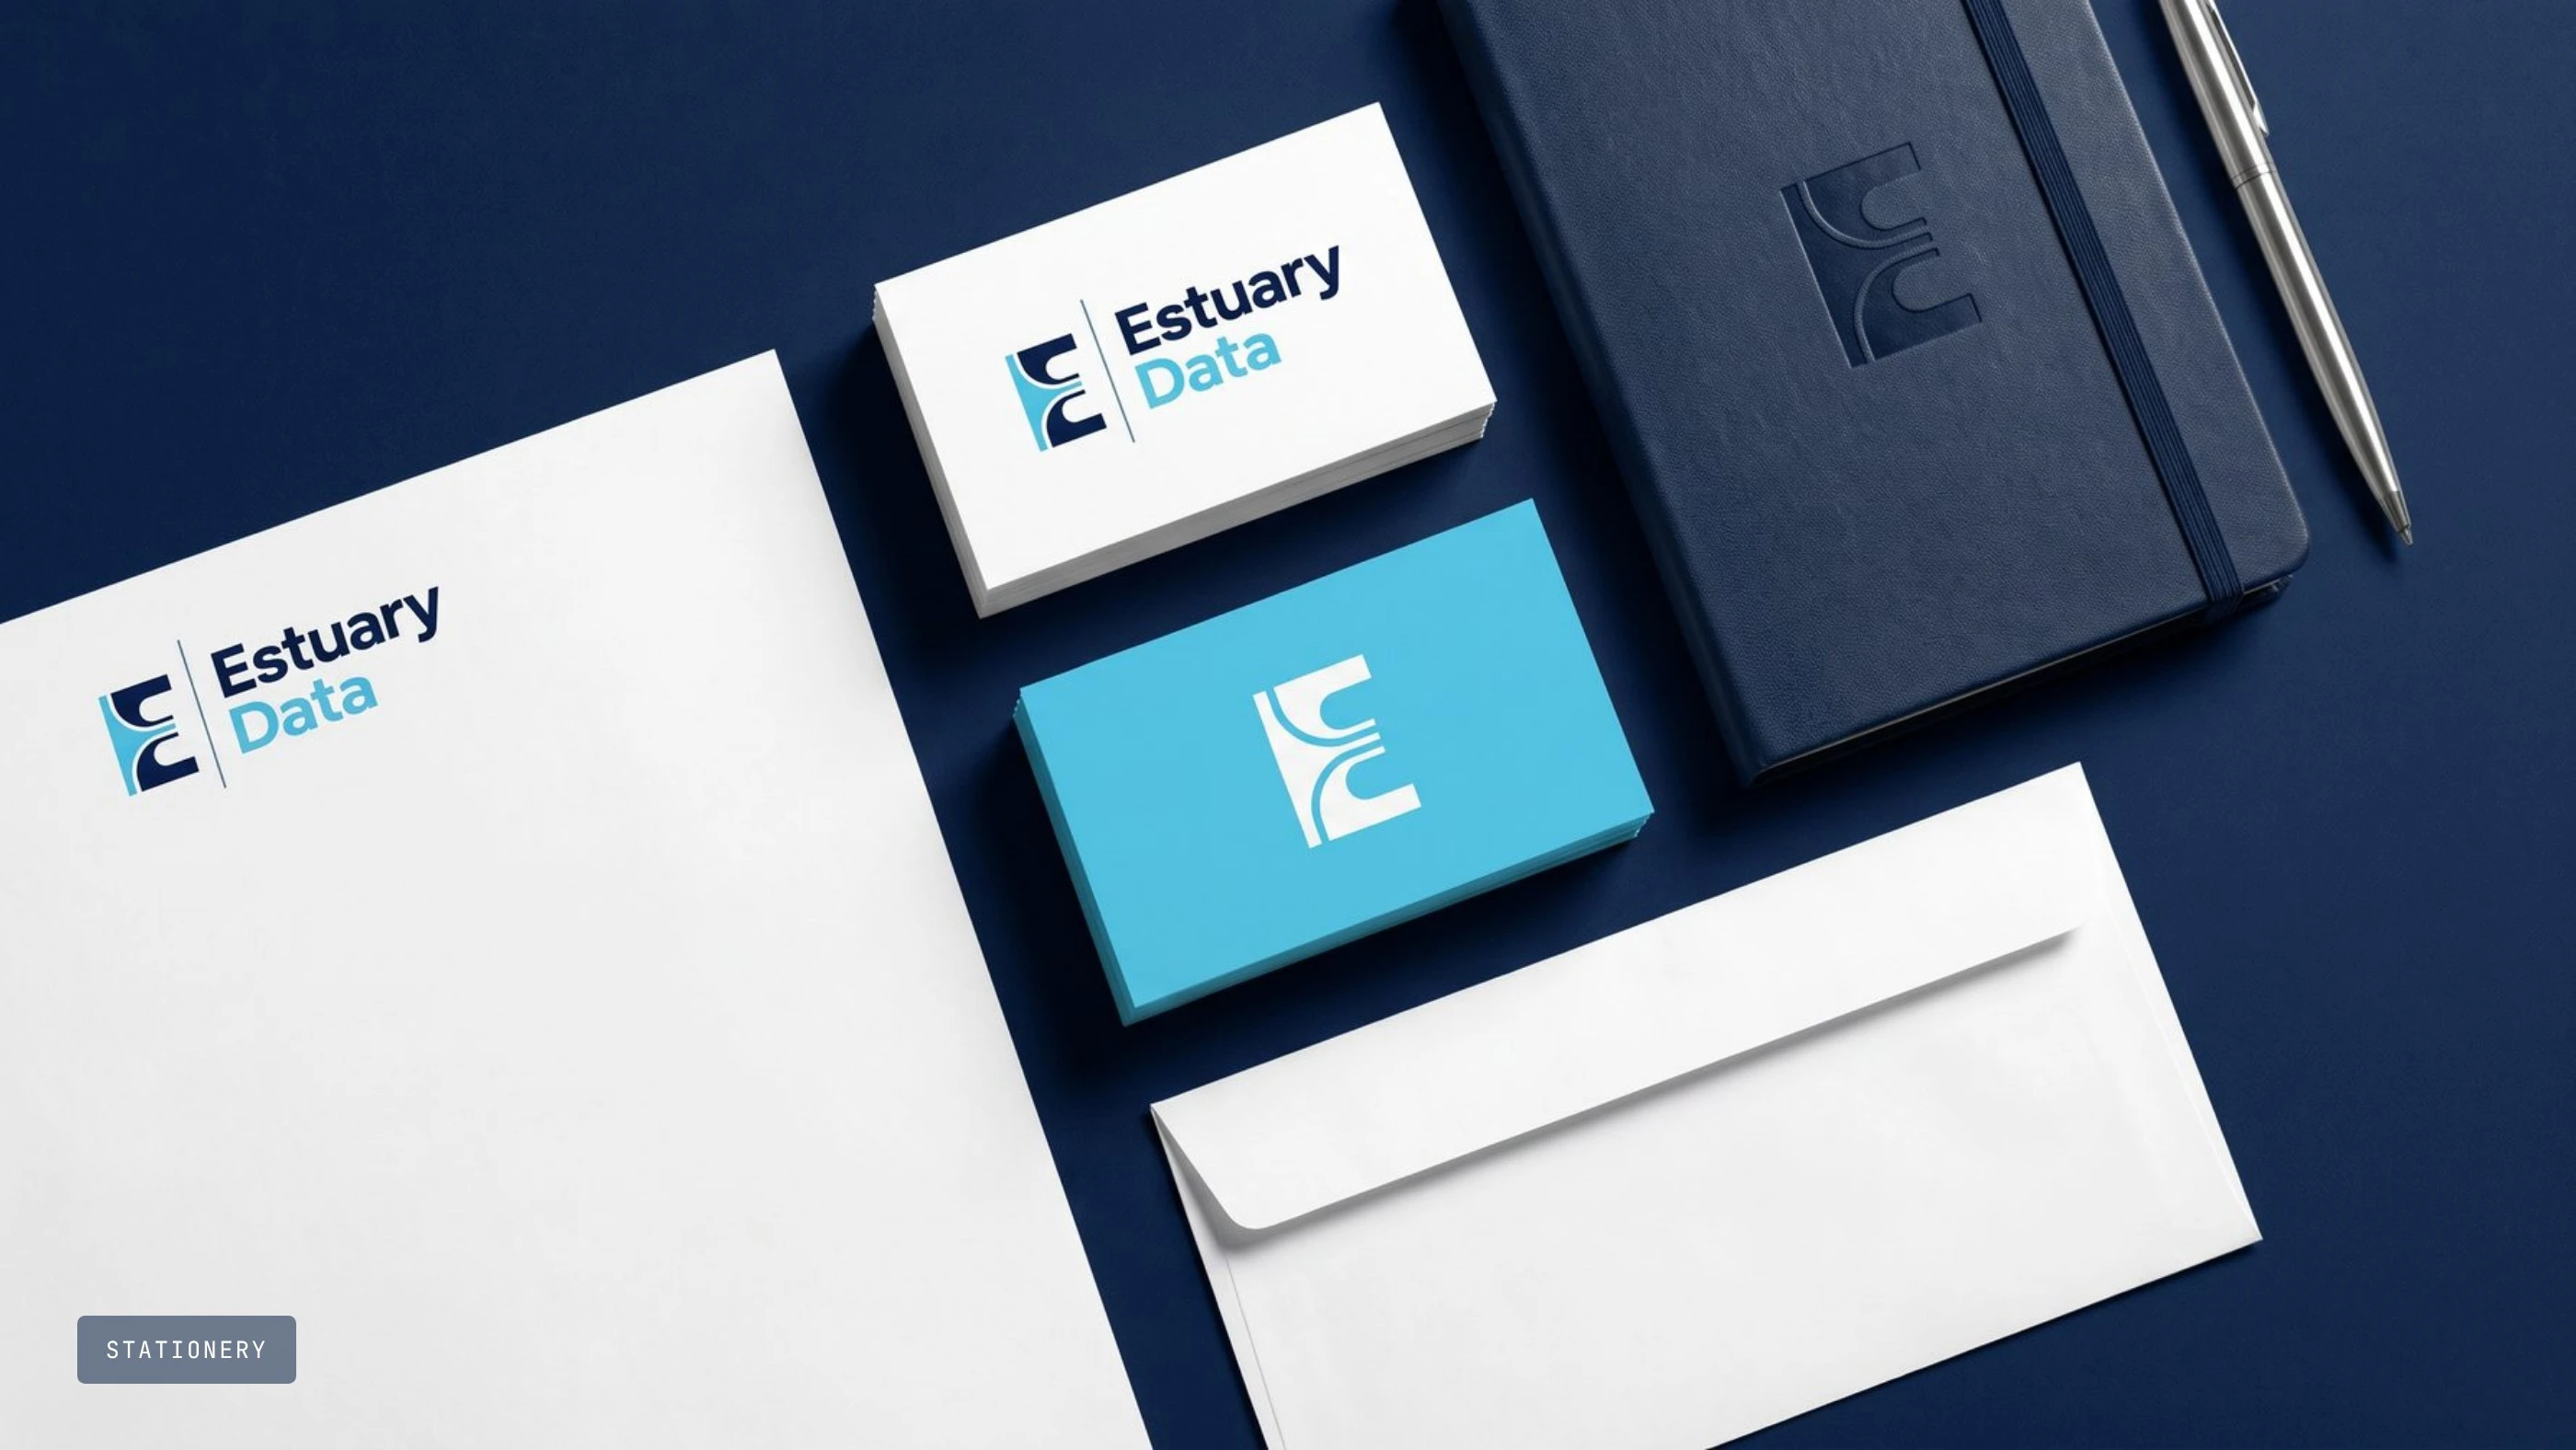
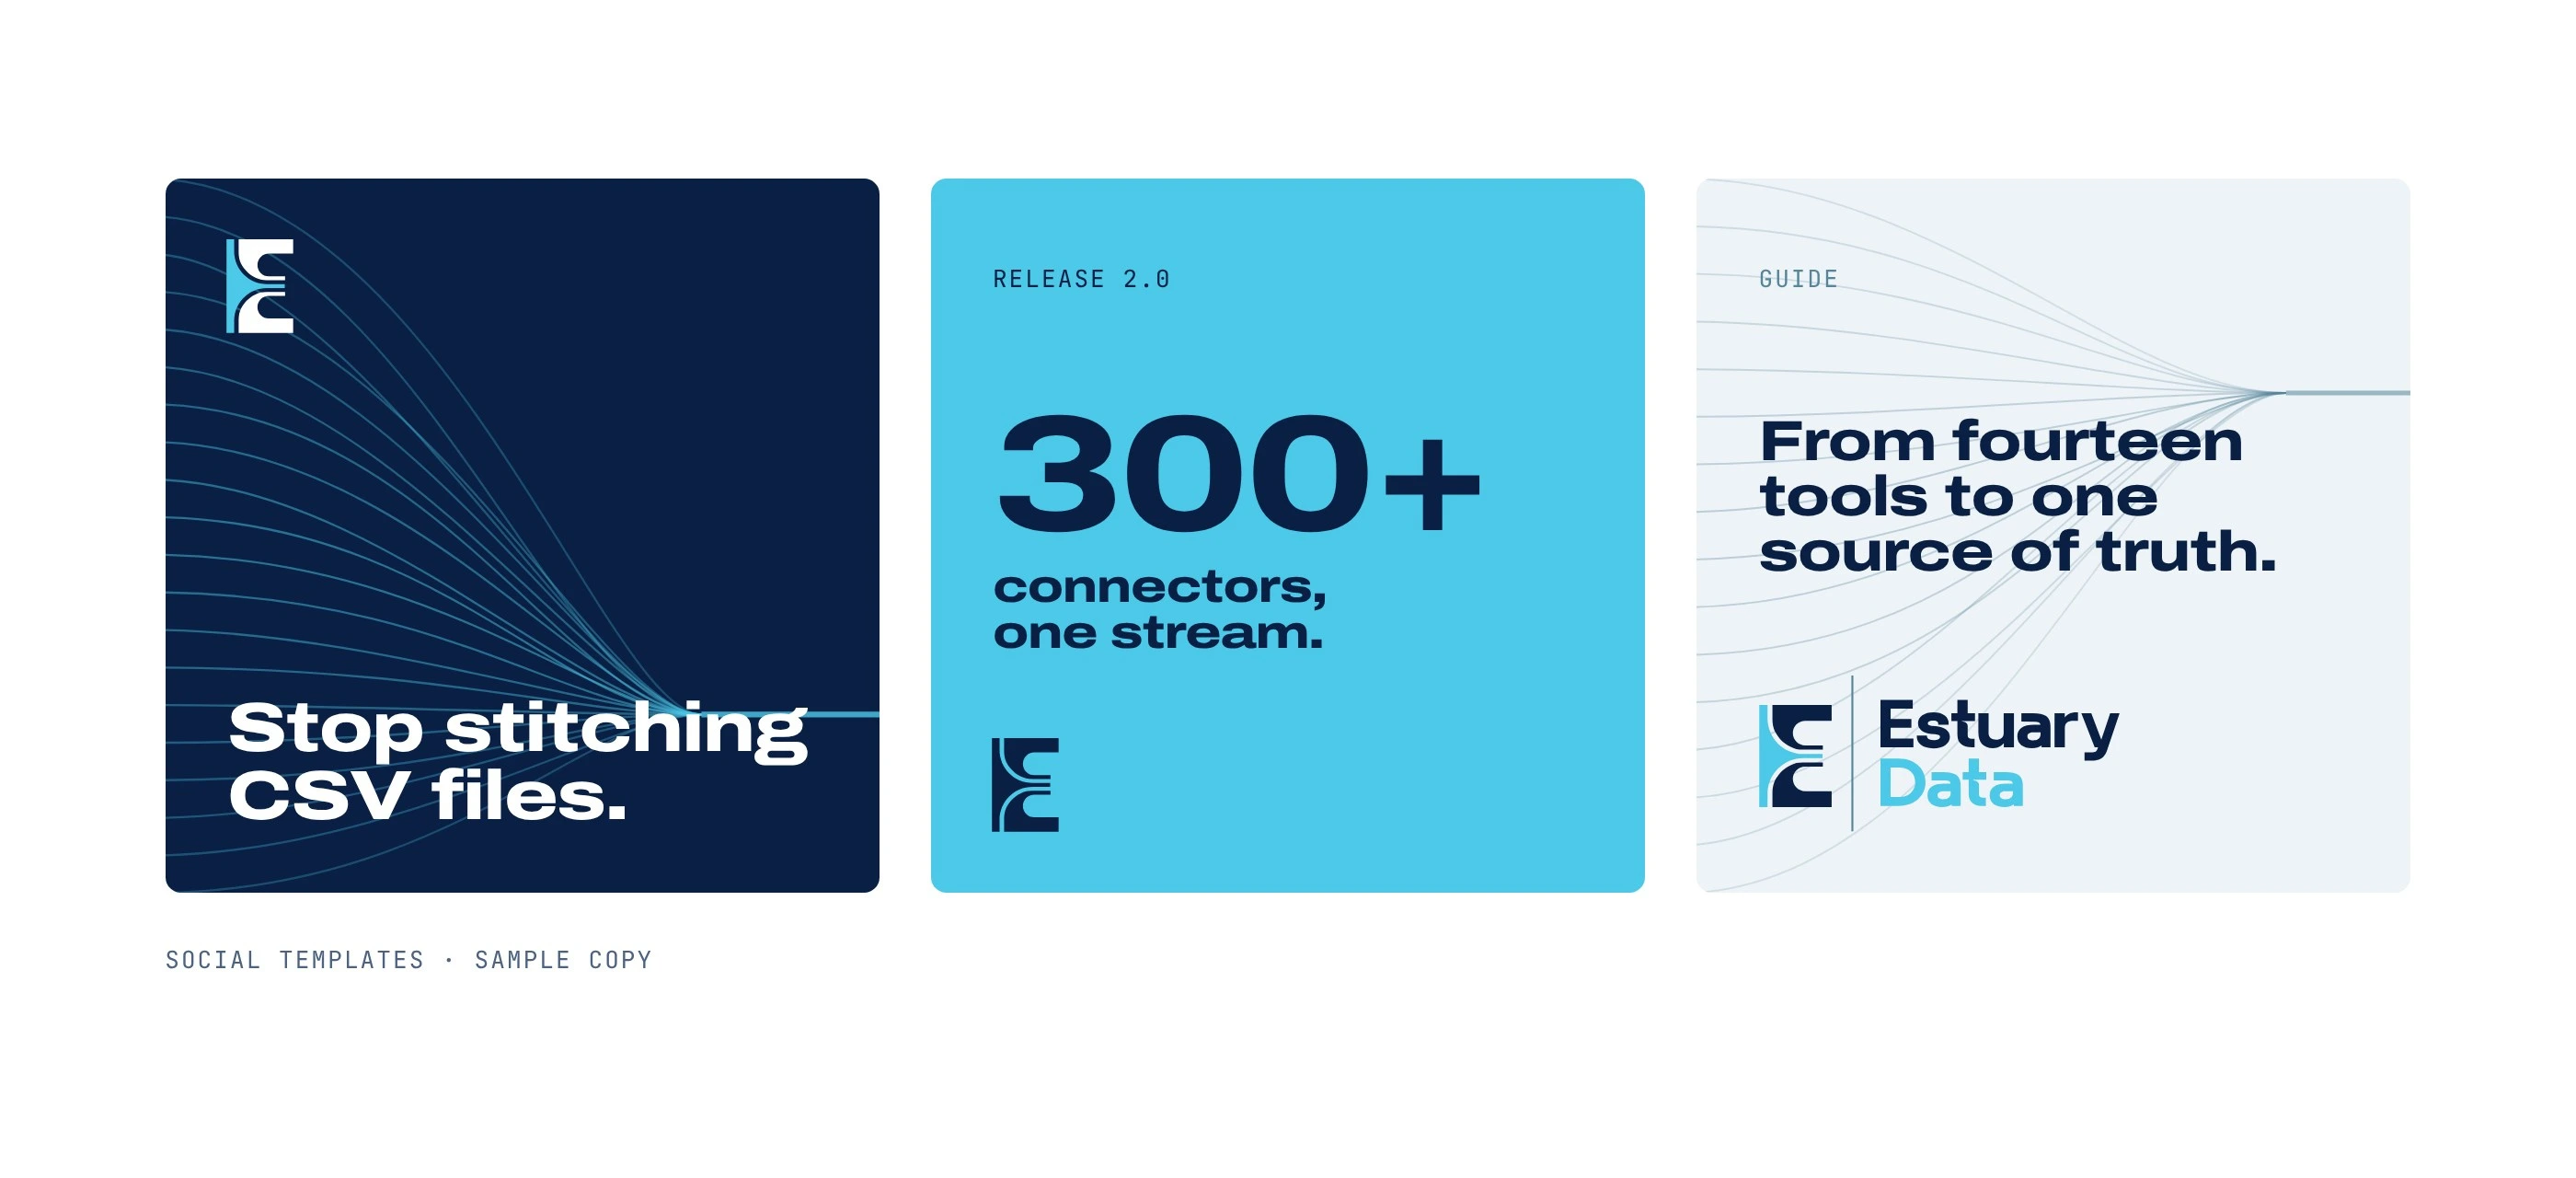
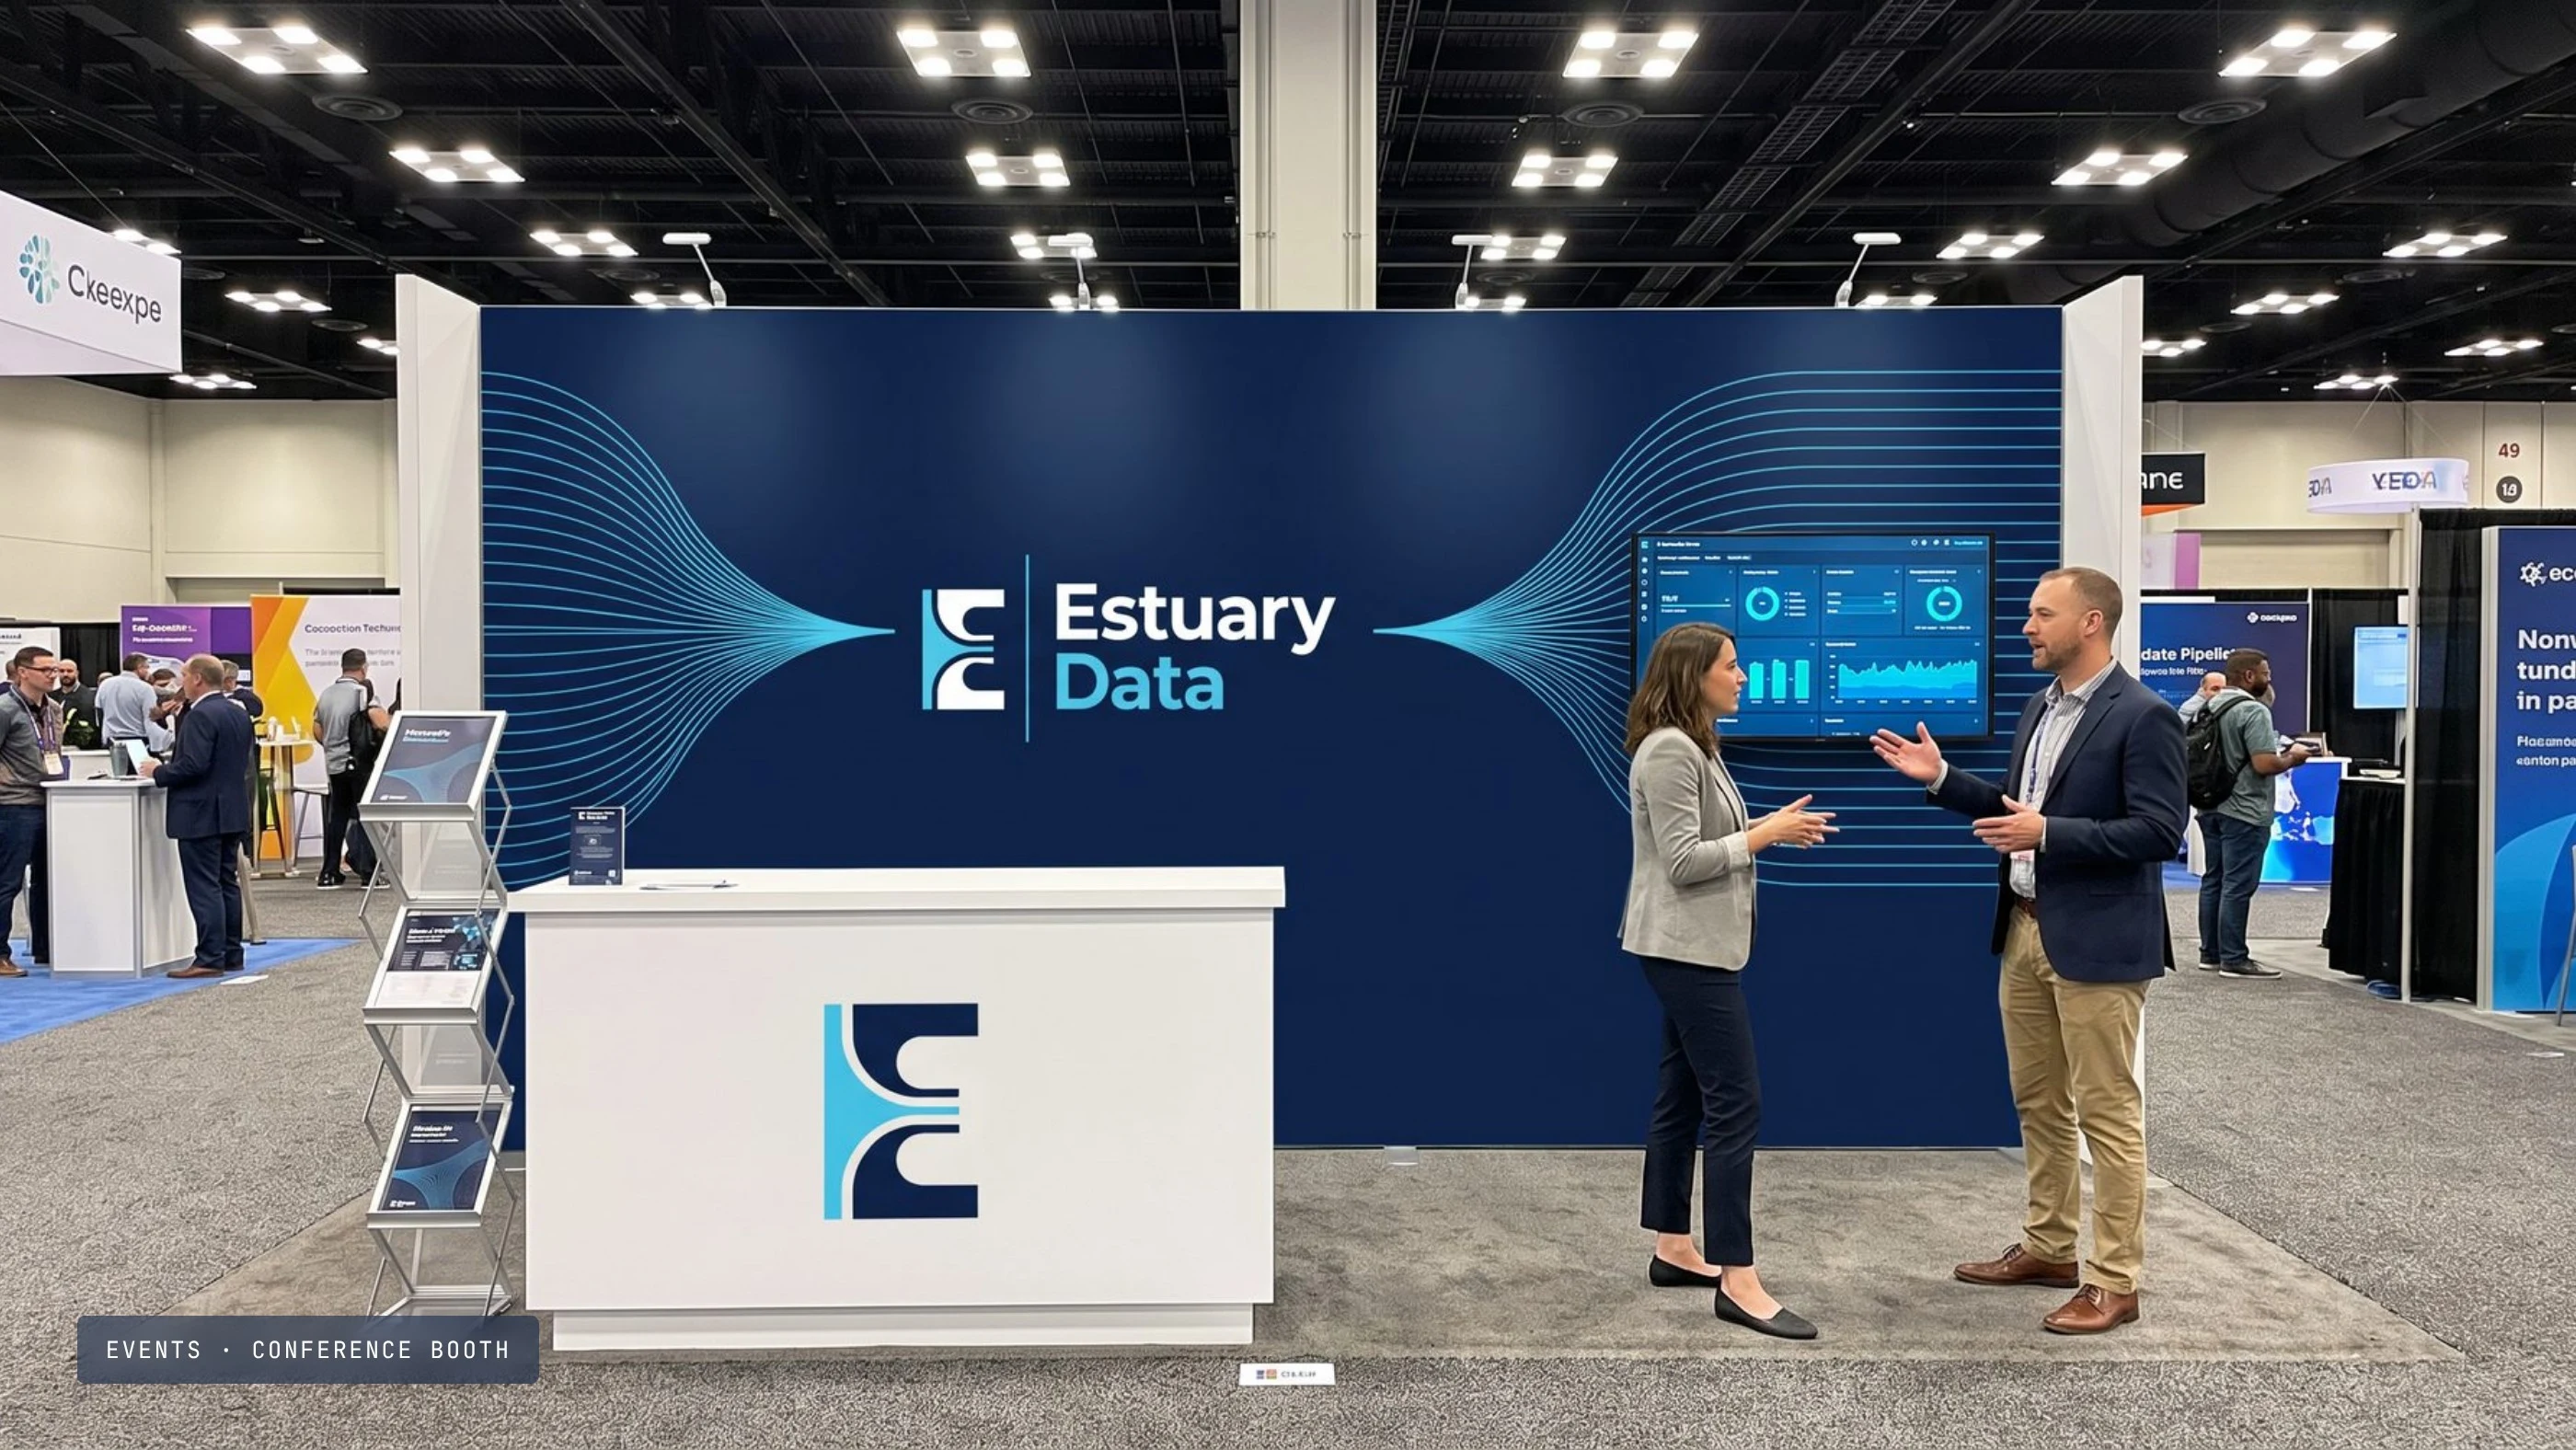

How do you draw "all your data in one place"? I started with a river.
Estuary Data is a SaaS platform that pulls a company's scattered data (databases, CRMs, payments, analytics) into one clean, real-time stream. The brief: build a full brand from scratch that shows data from everywhere coming together into one.
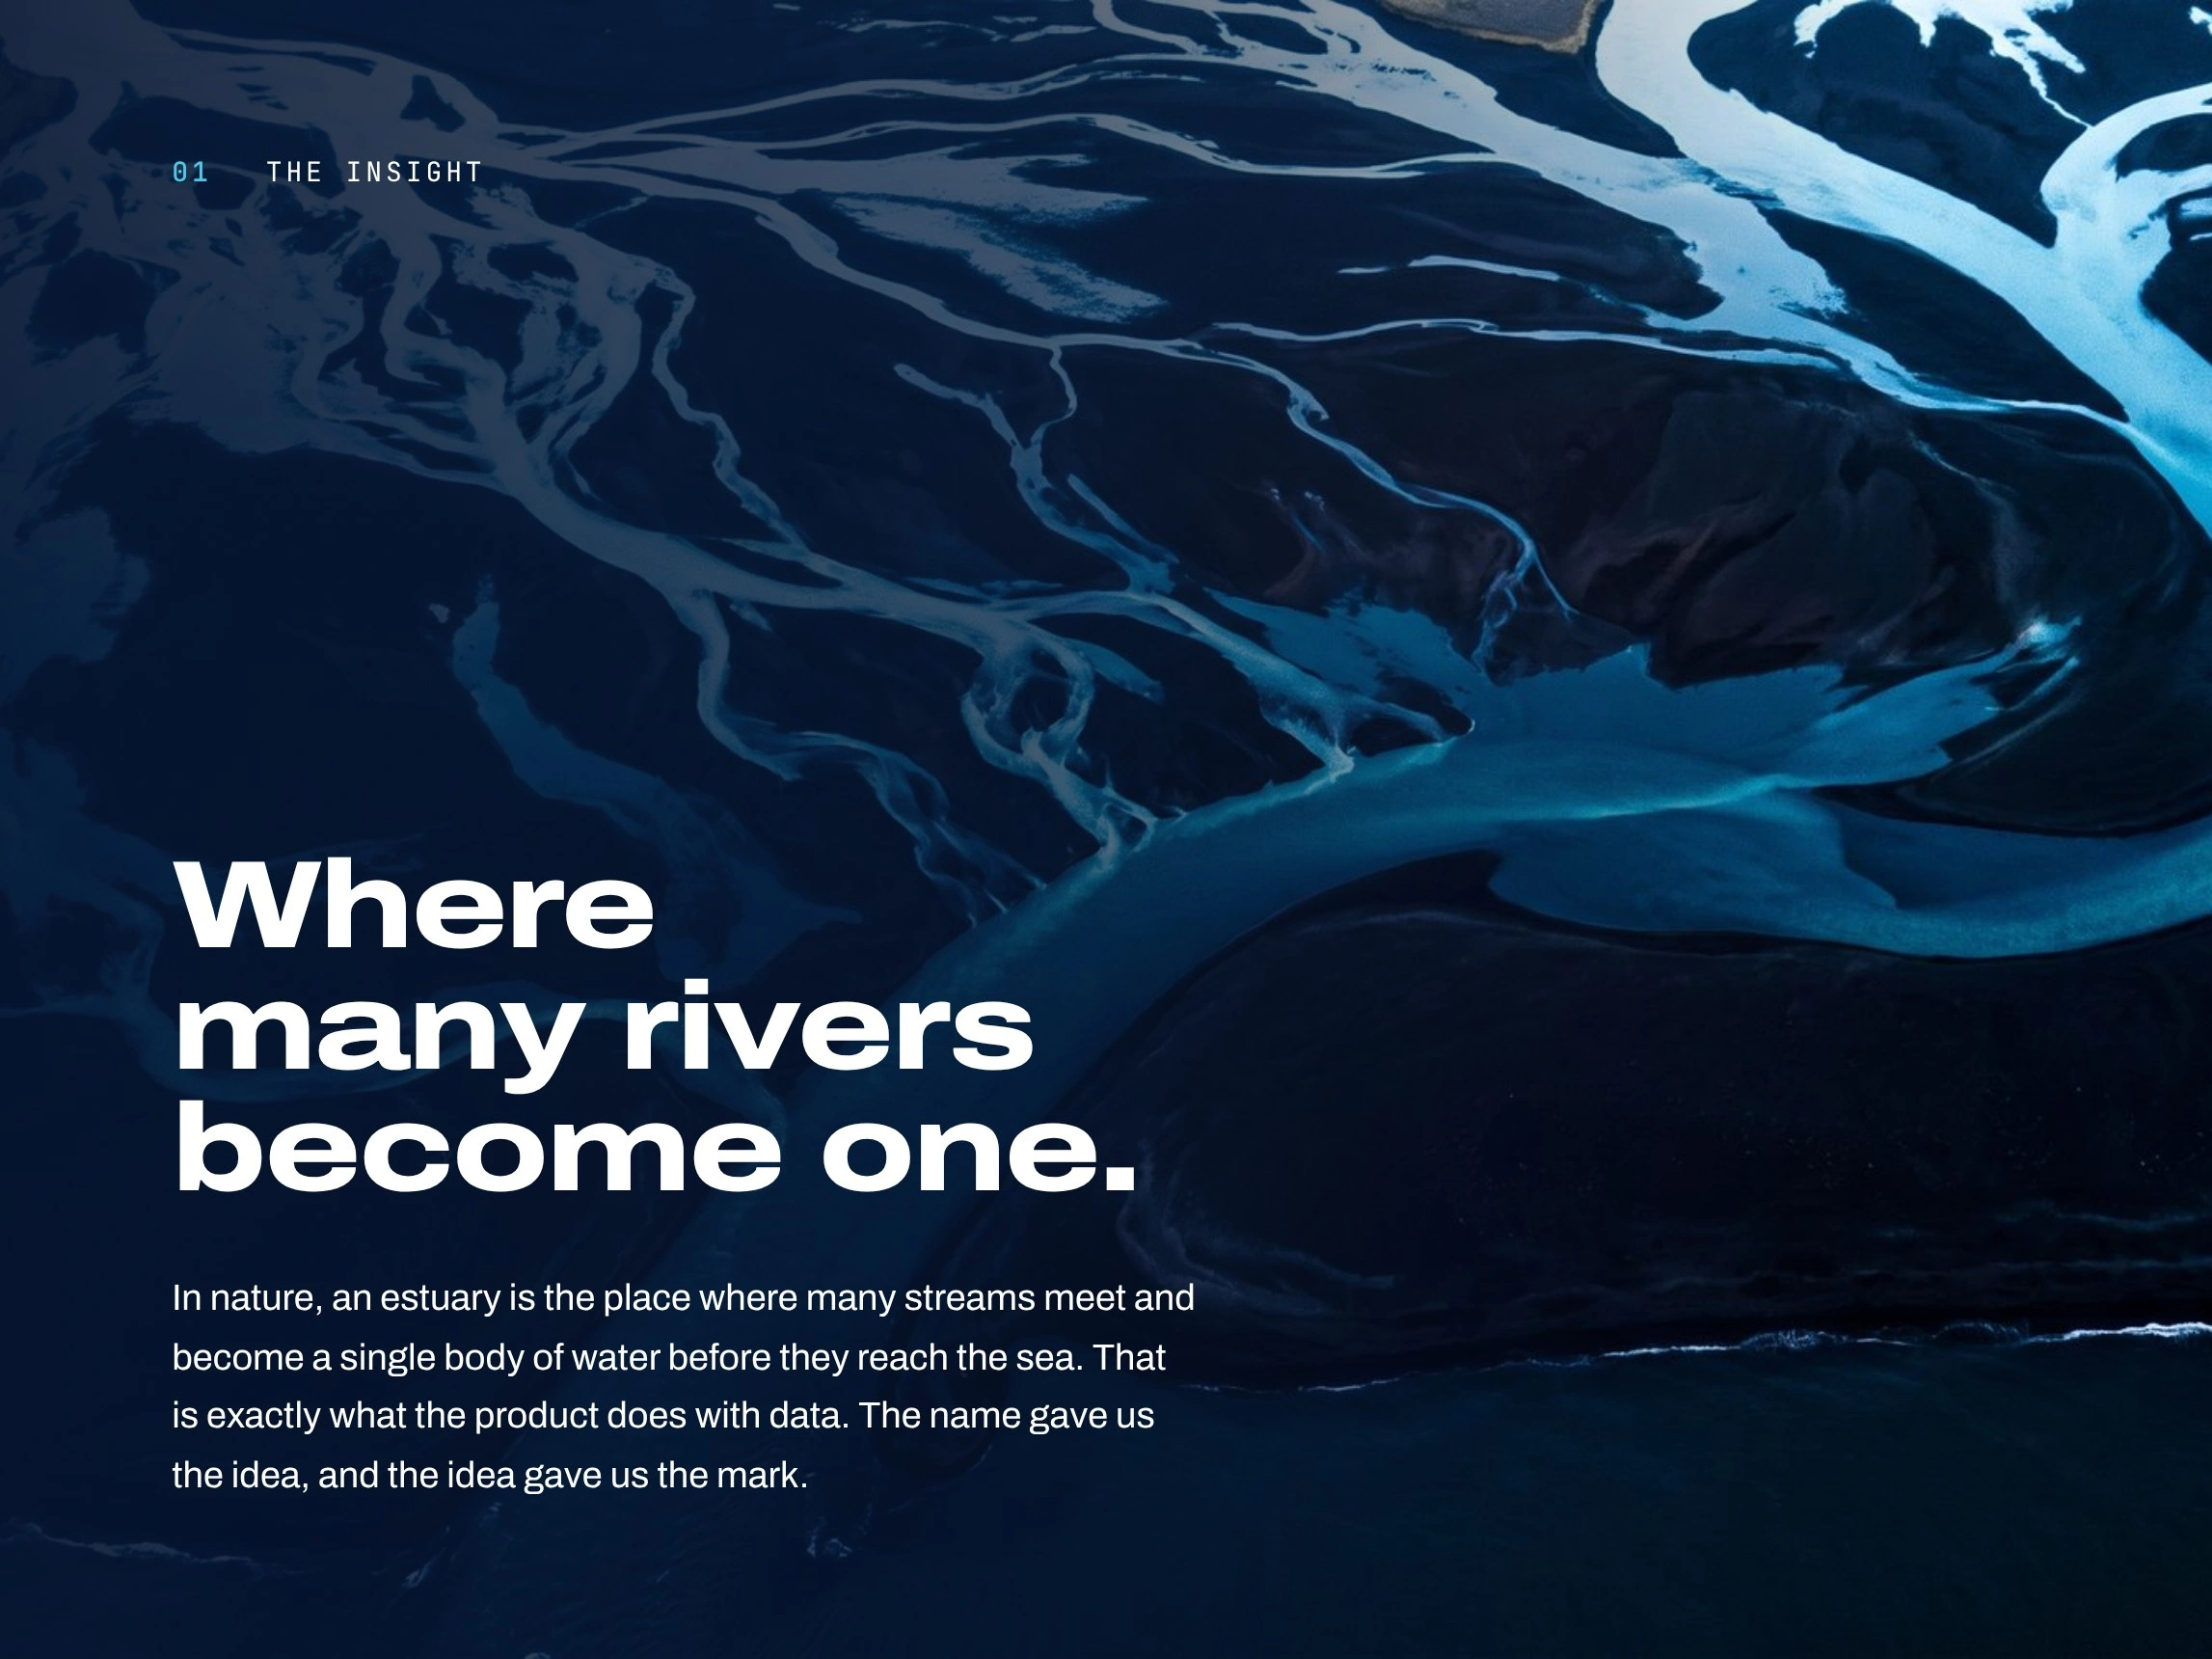
The answer was already in the name. An estuary is where many rivers meet and become one before reaching the sea.
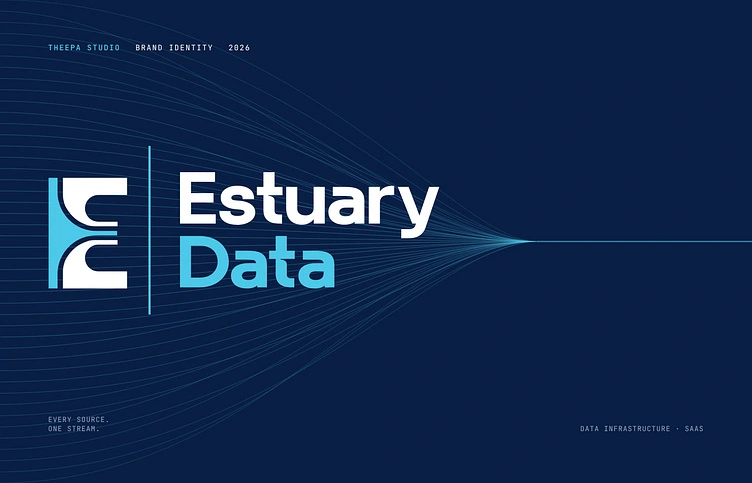
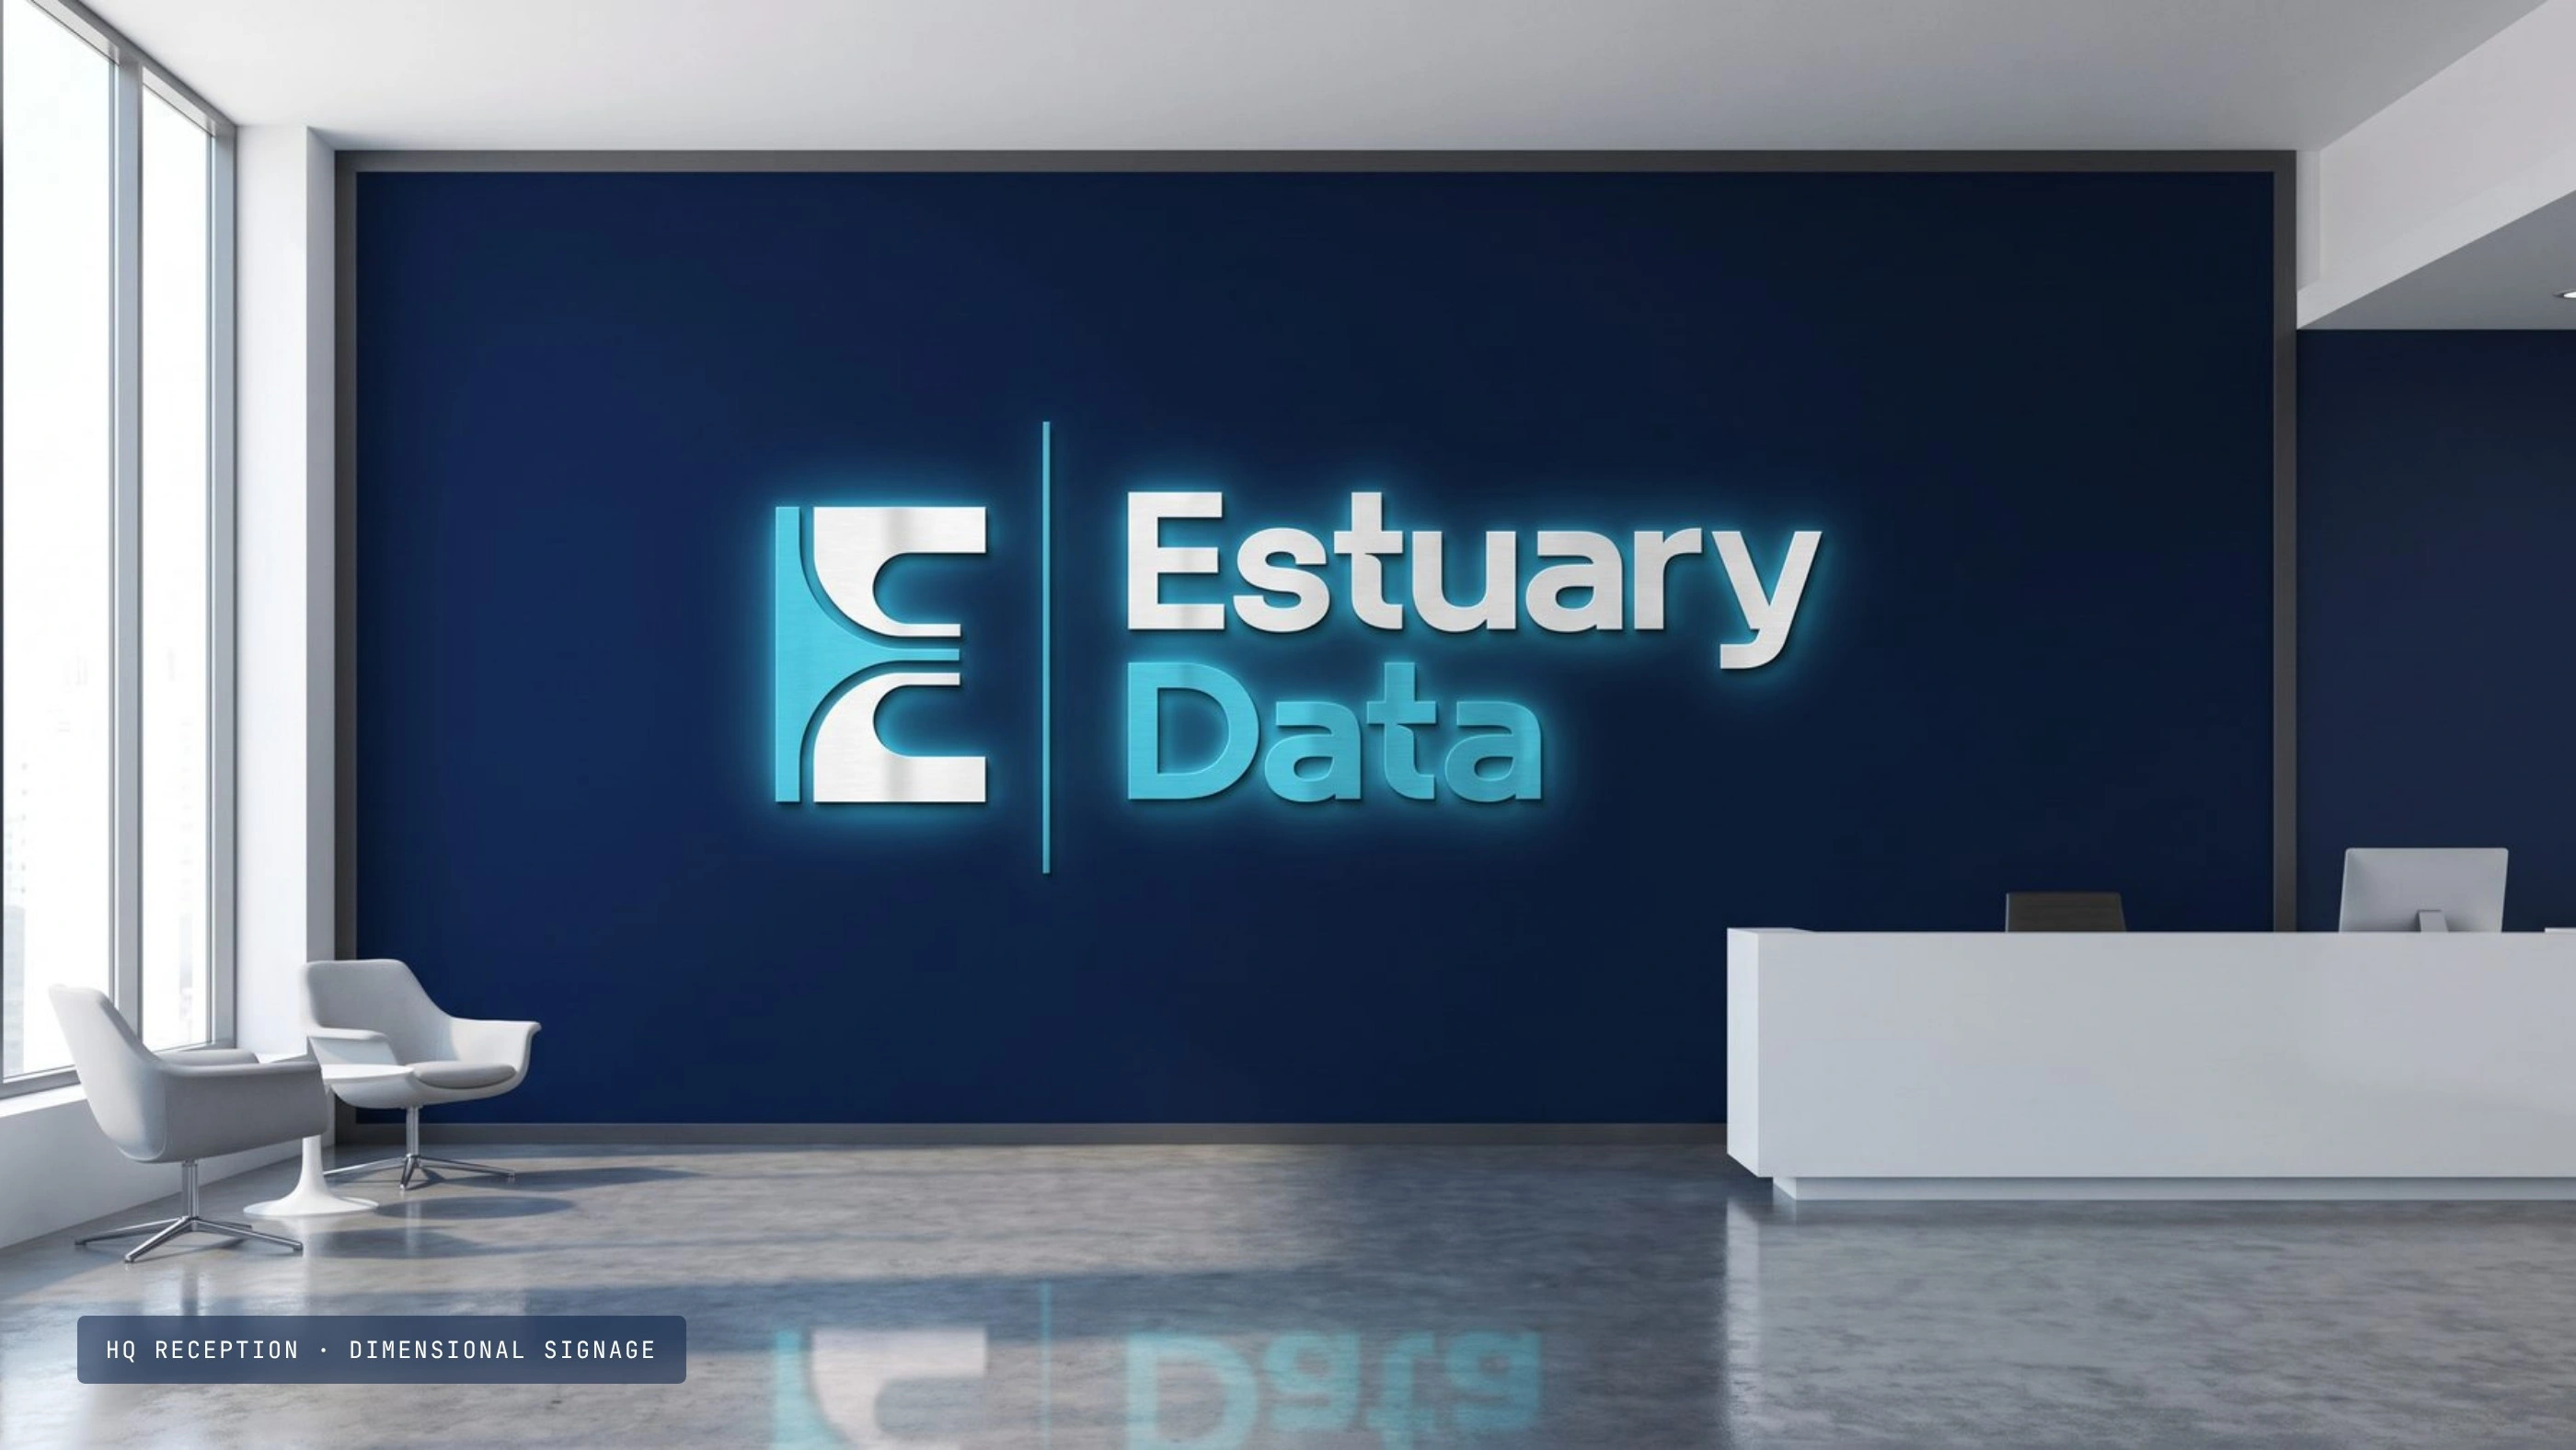
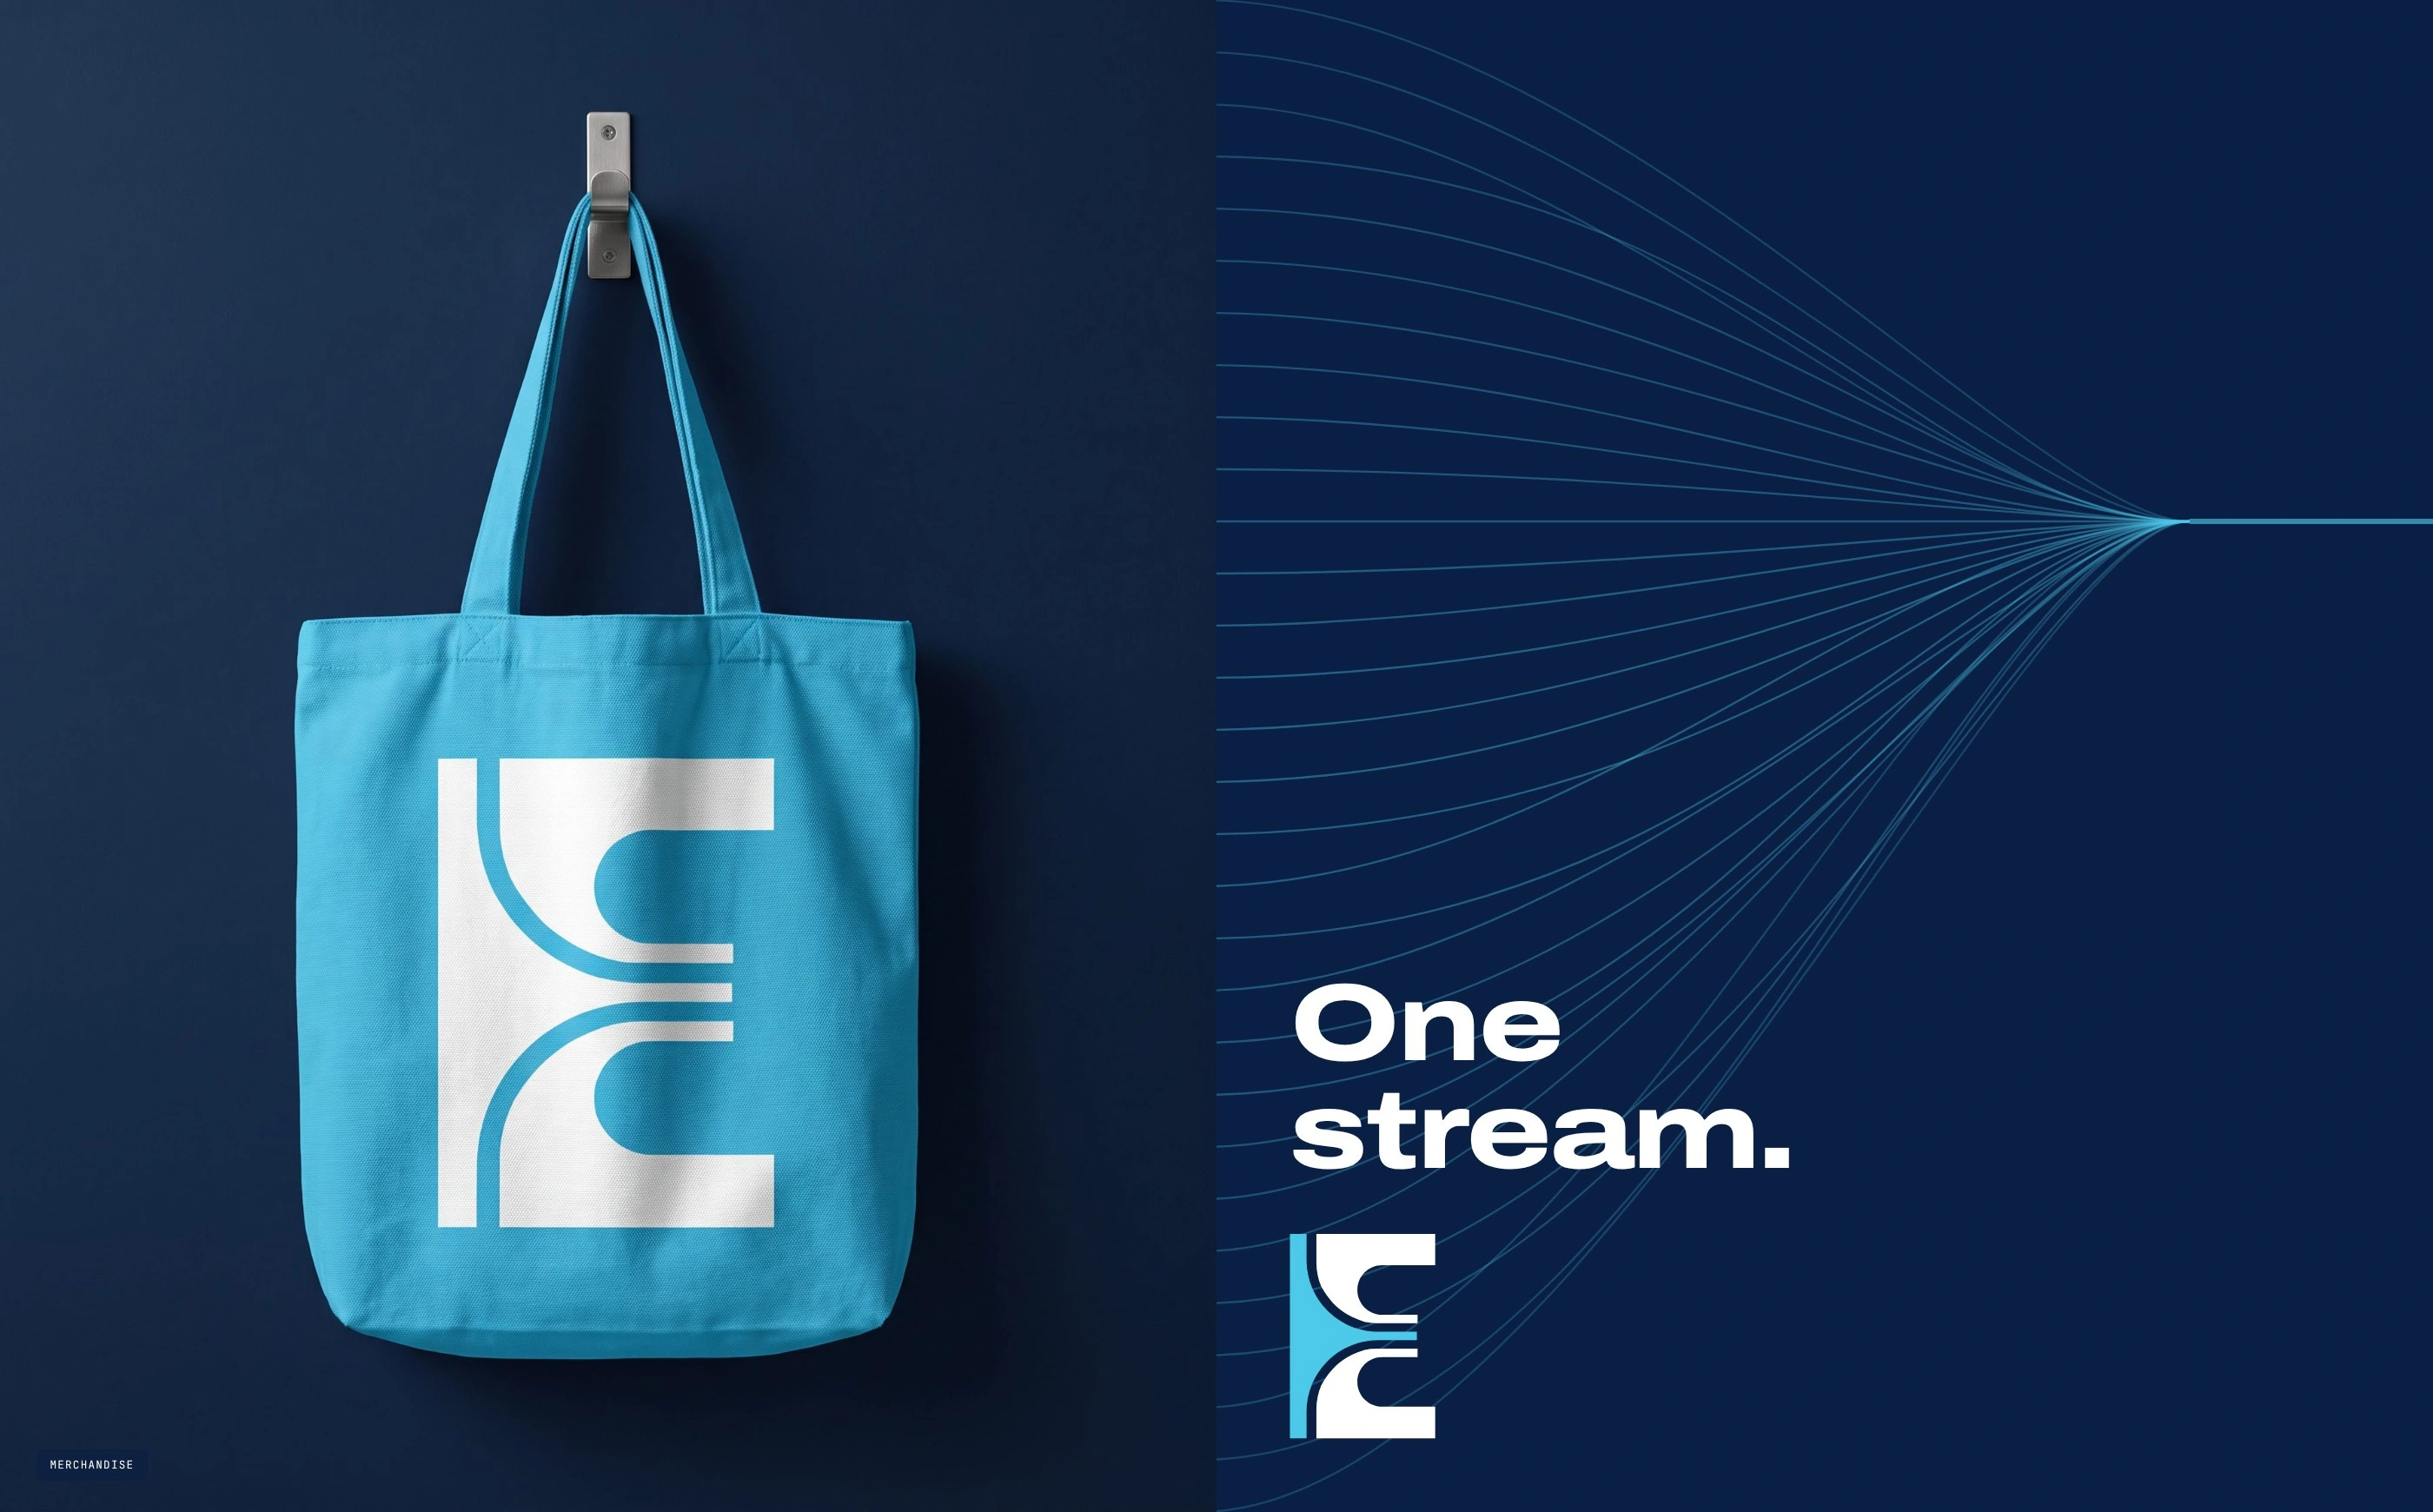
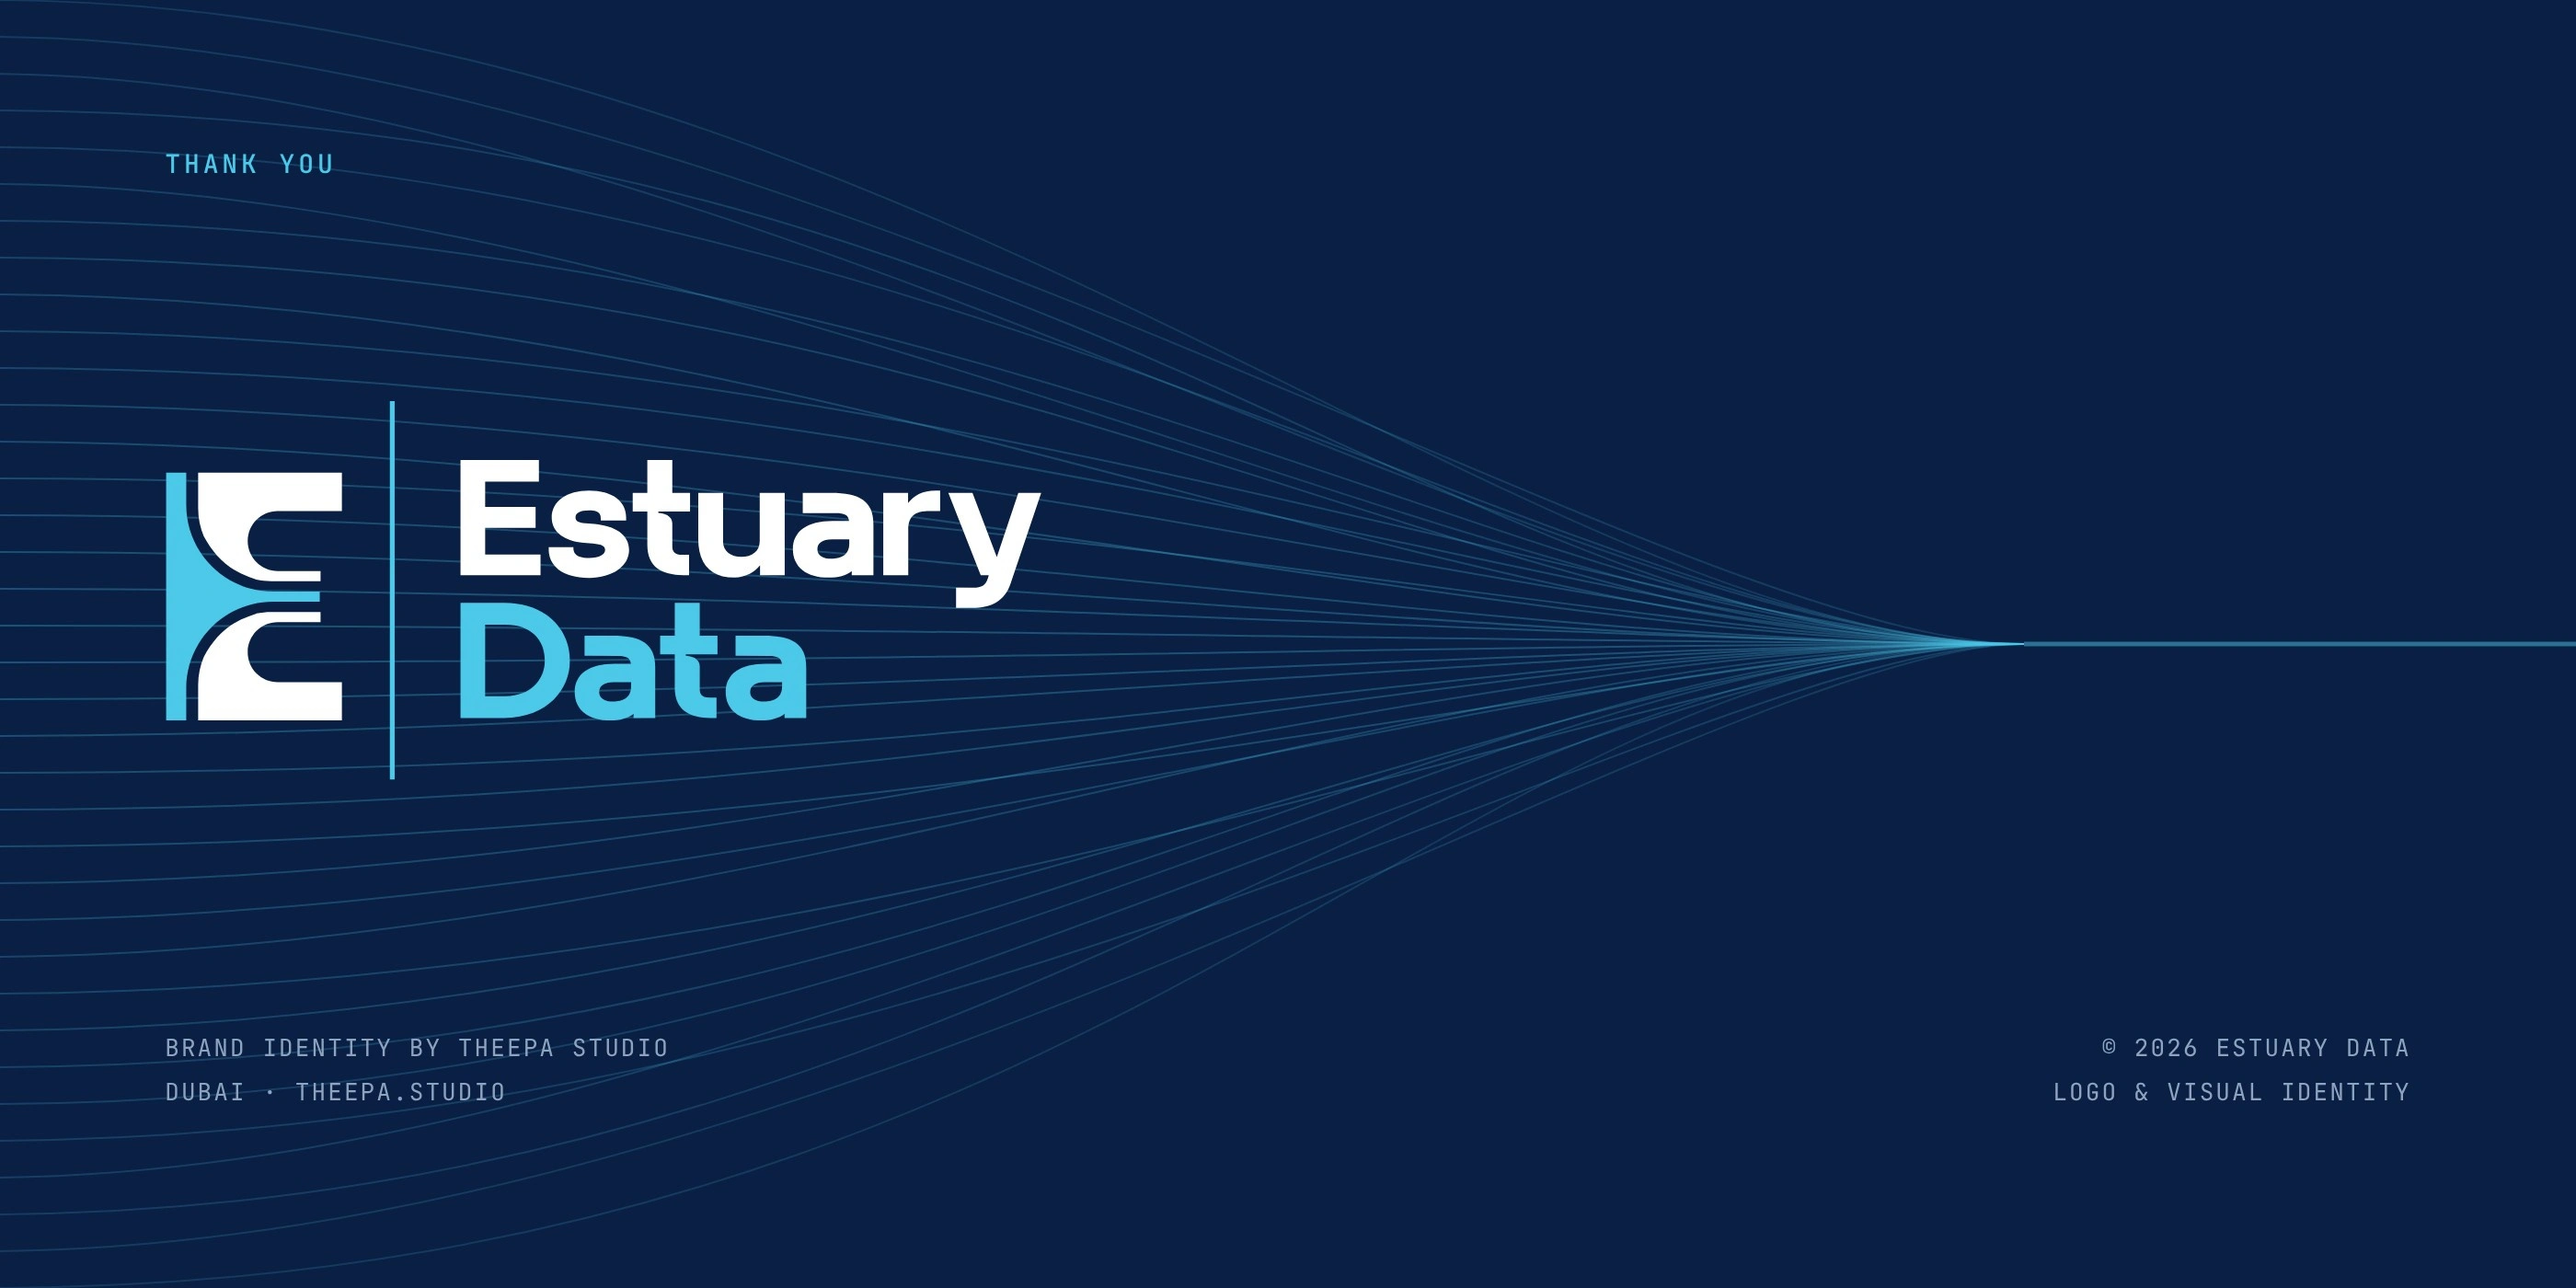
So the mark is built from three parts:
→ Sources: a cyan upright, everything flowing in
→ Channels: two forms cut like river banks
→ Confluence: one line where it all meets
Read together, they form an E.
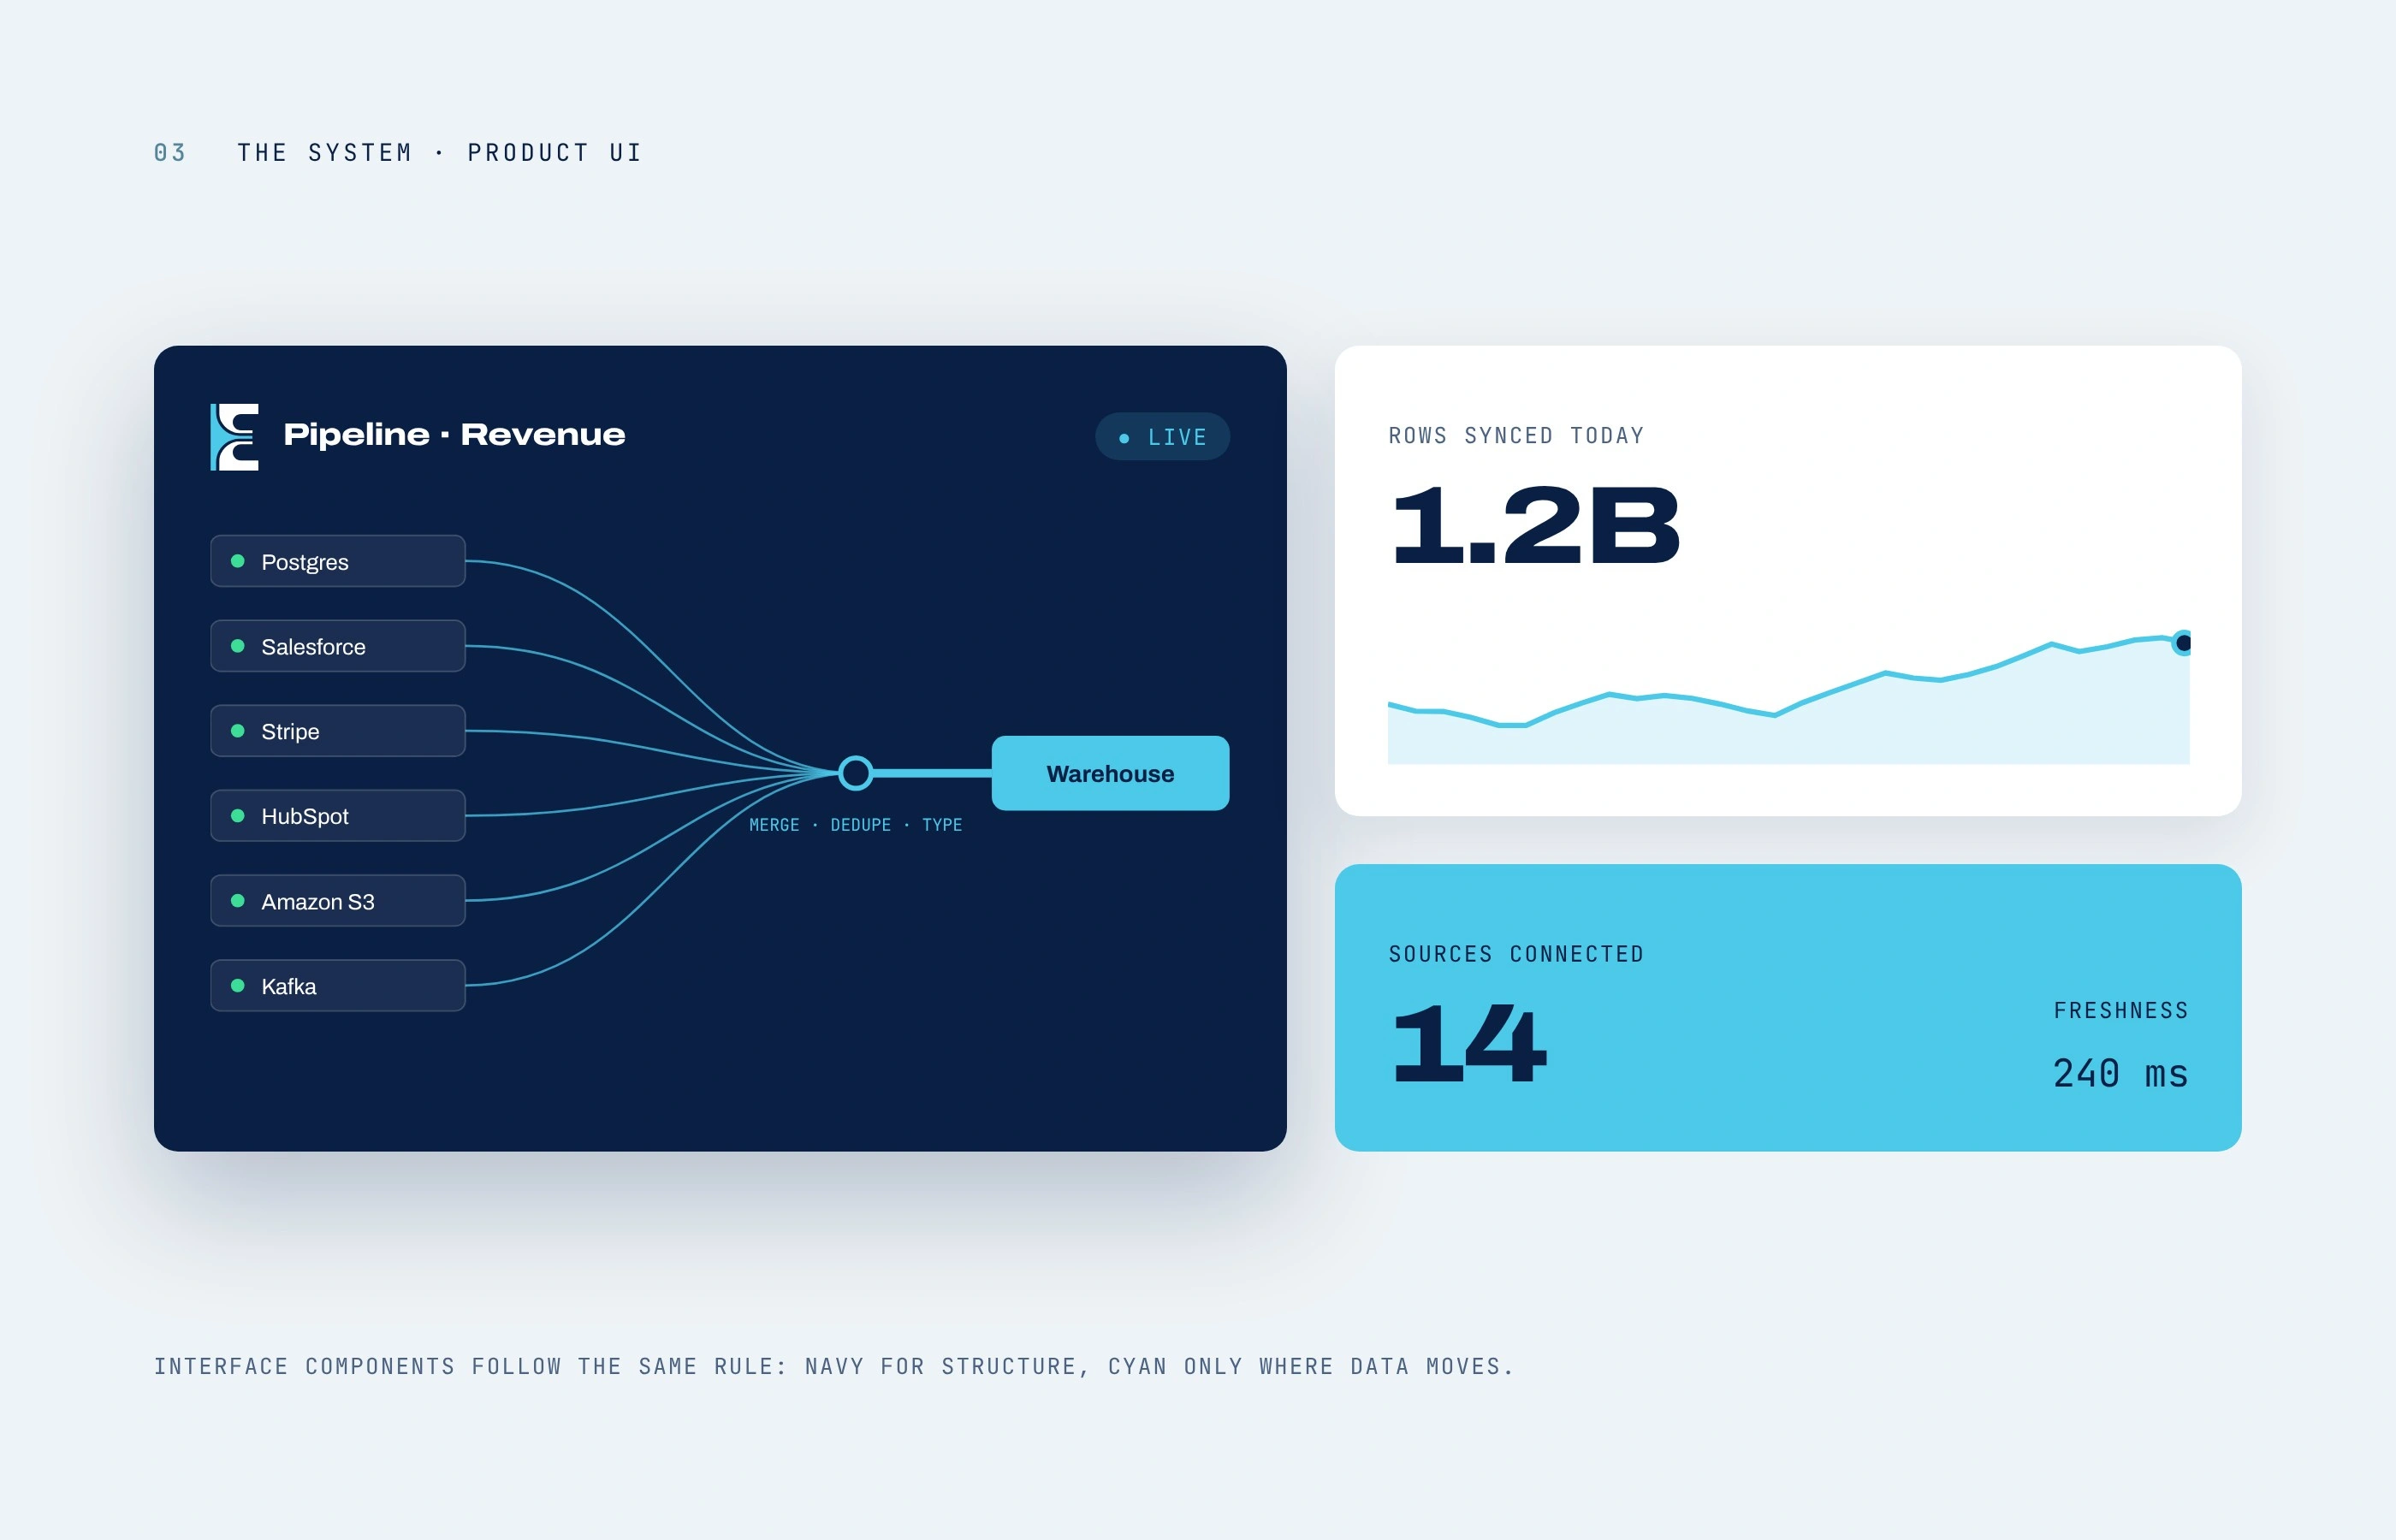
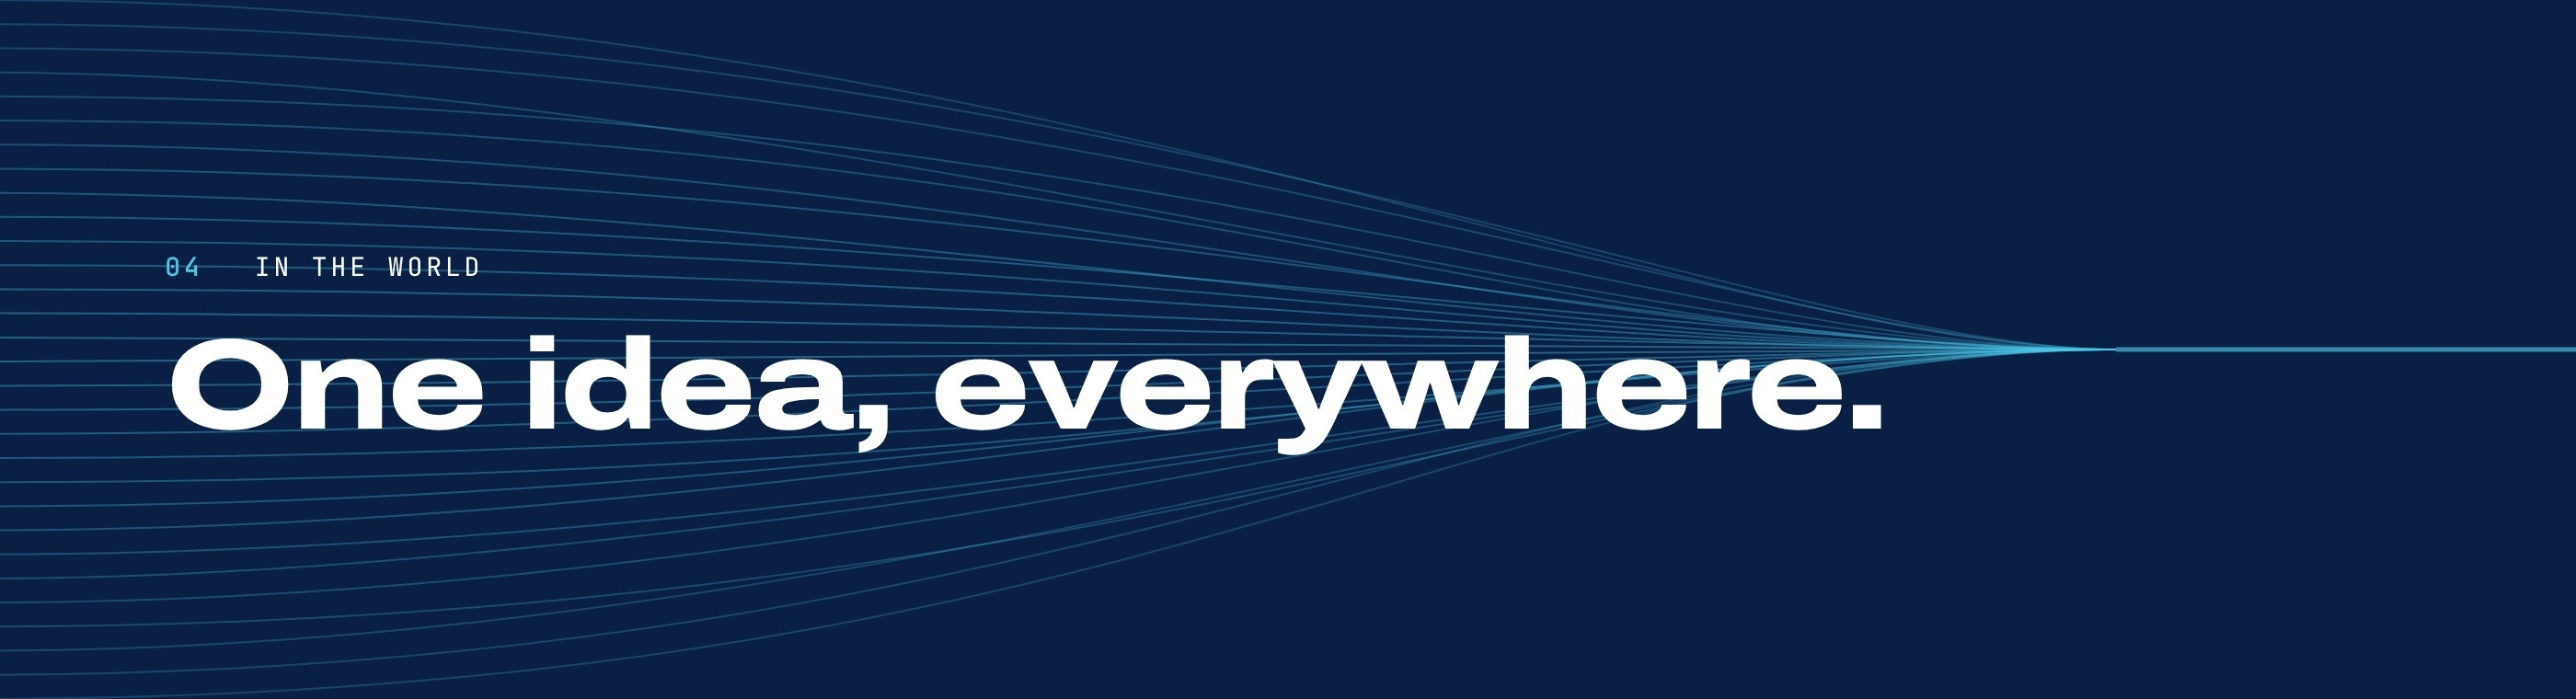
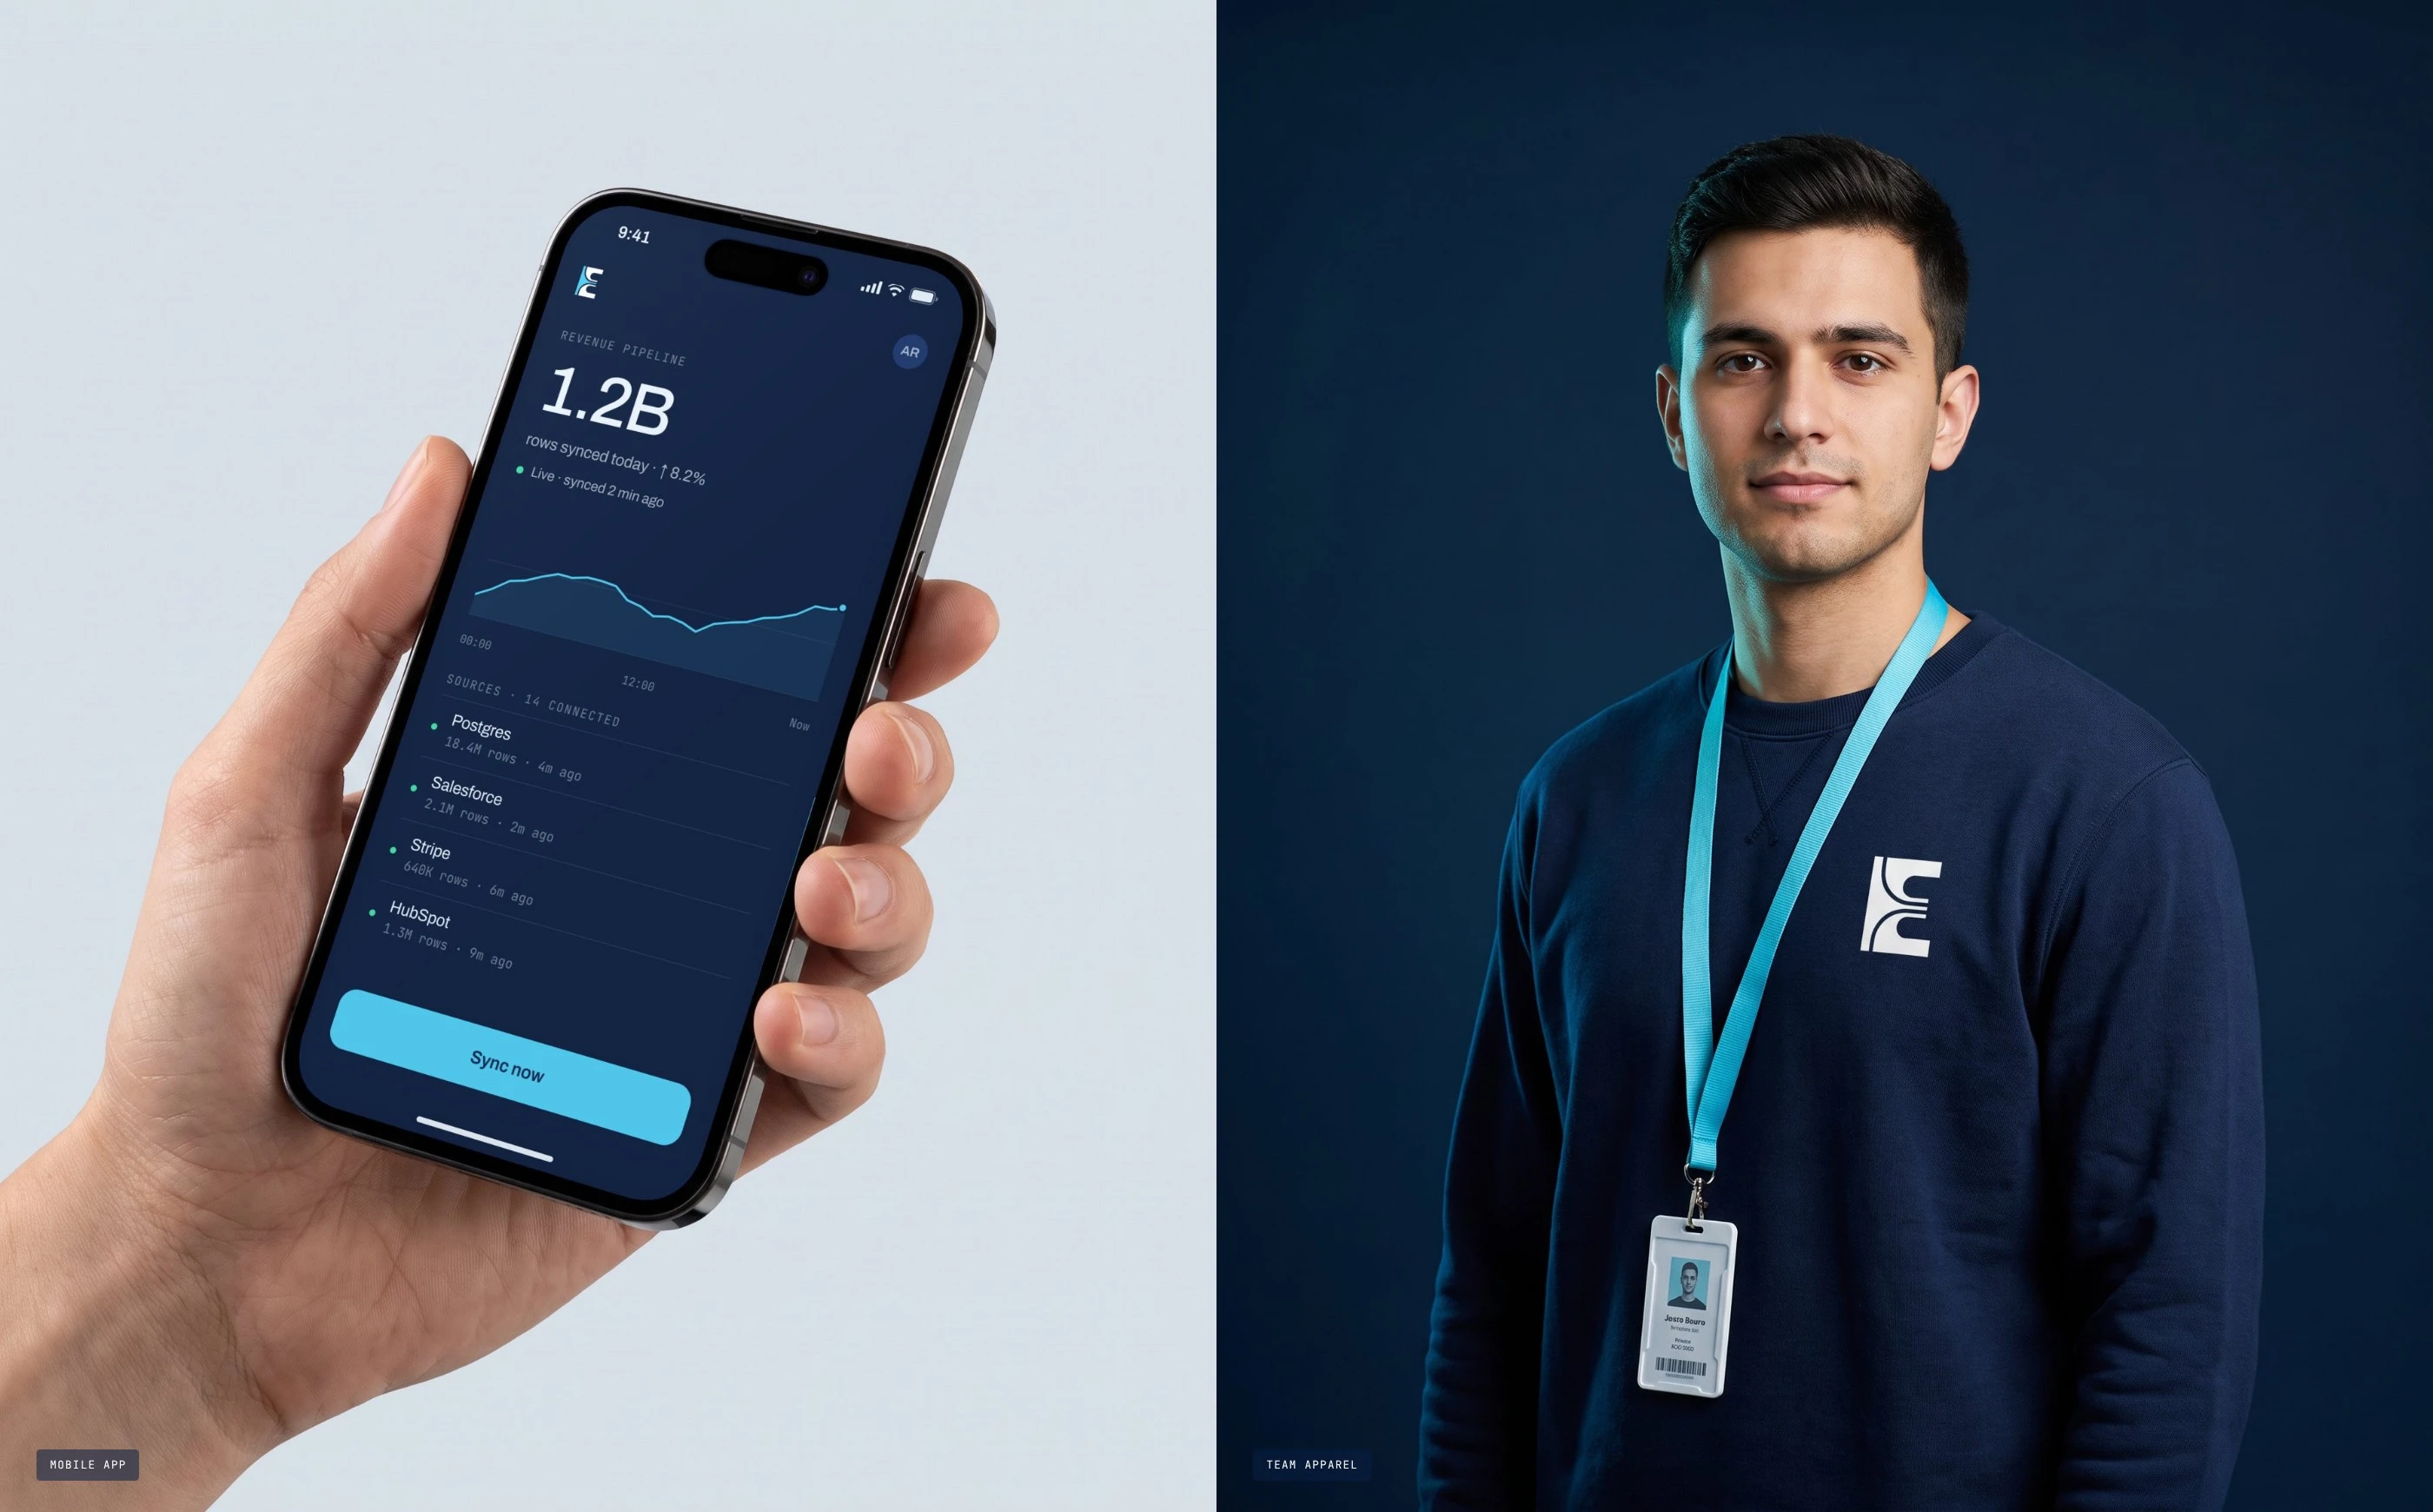
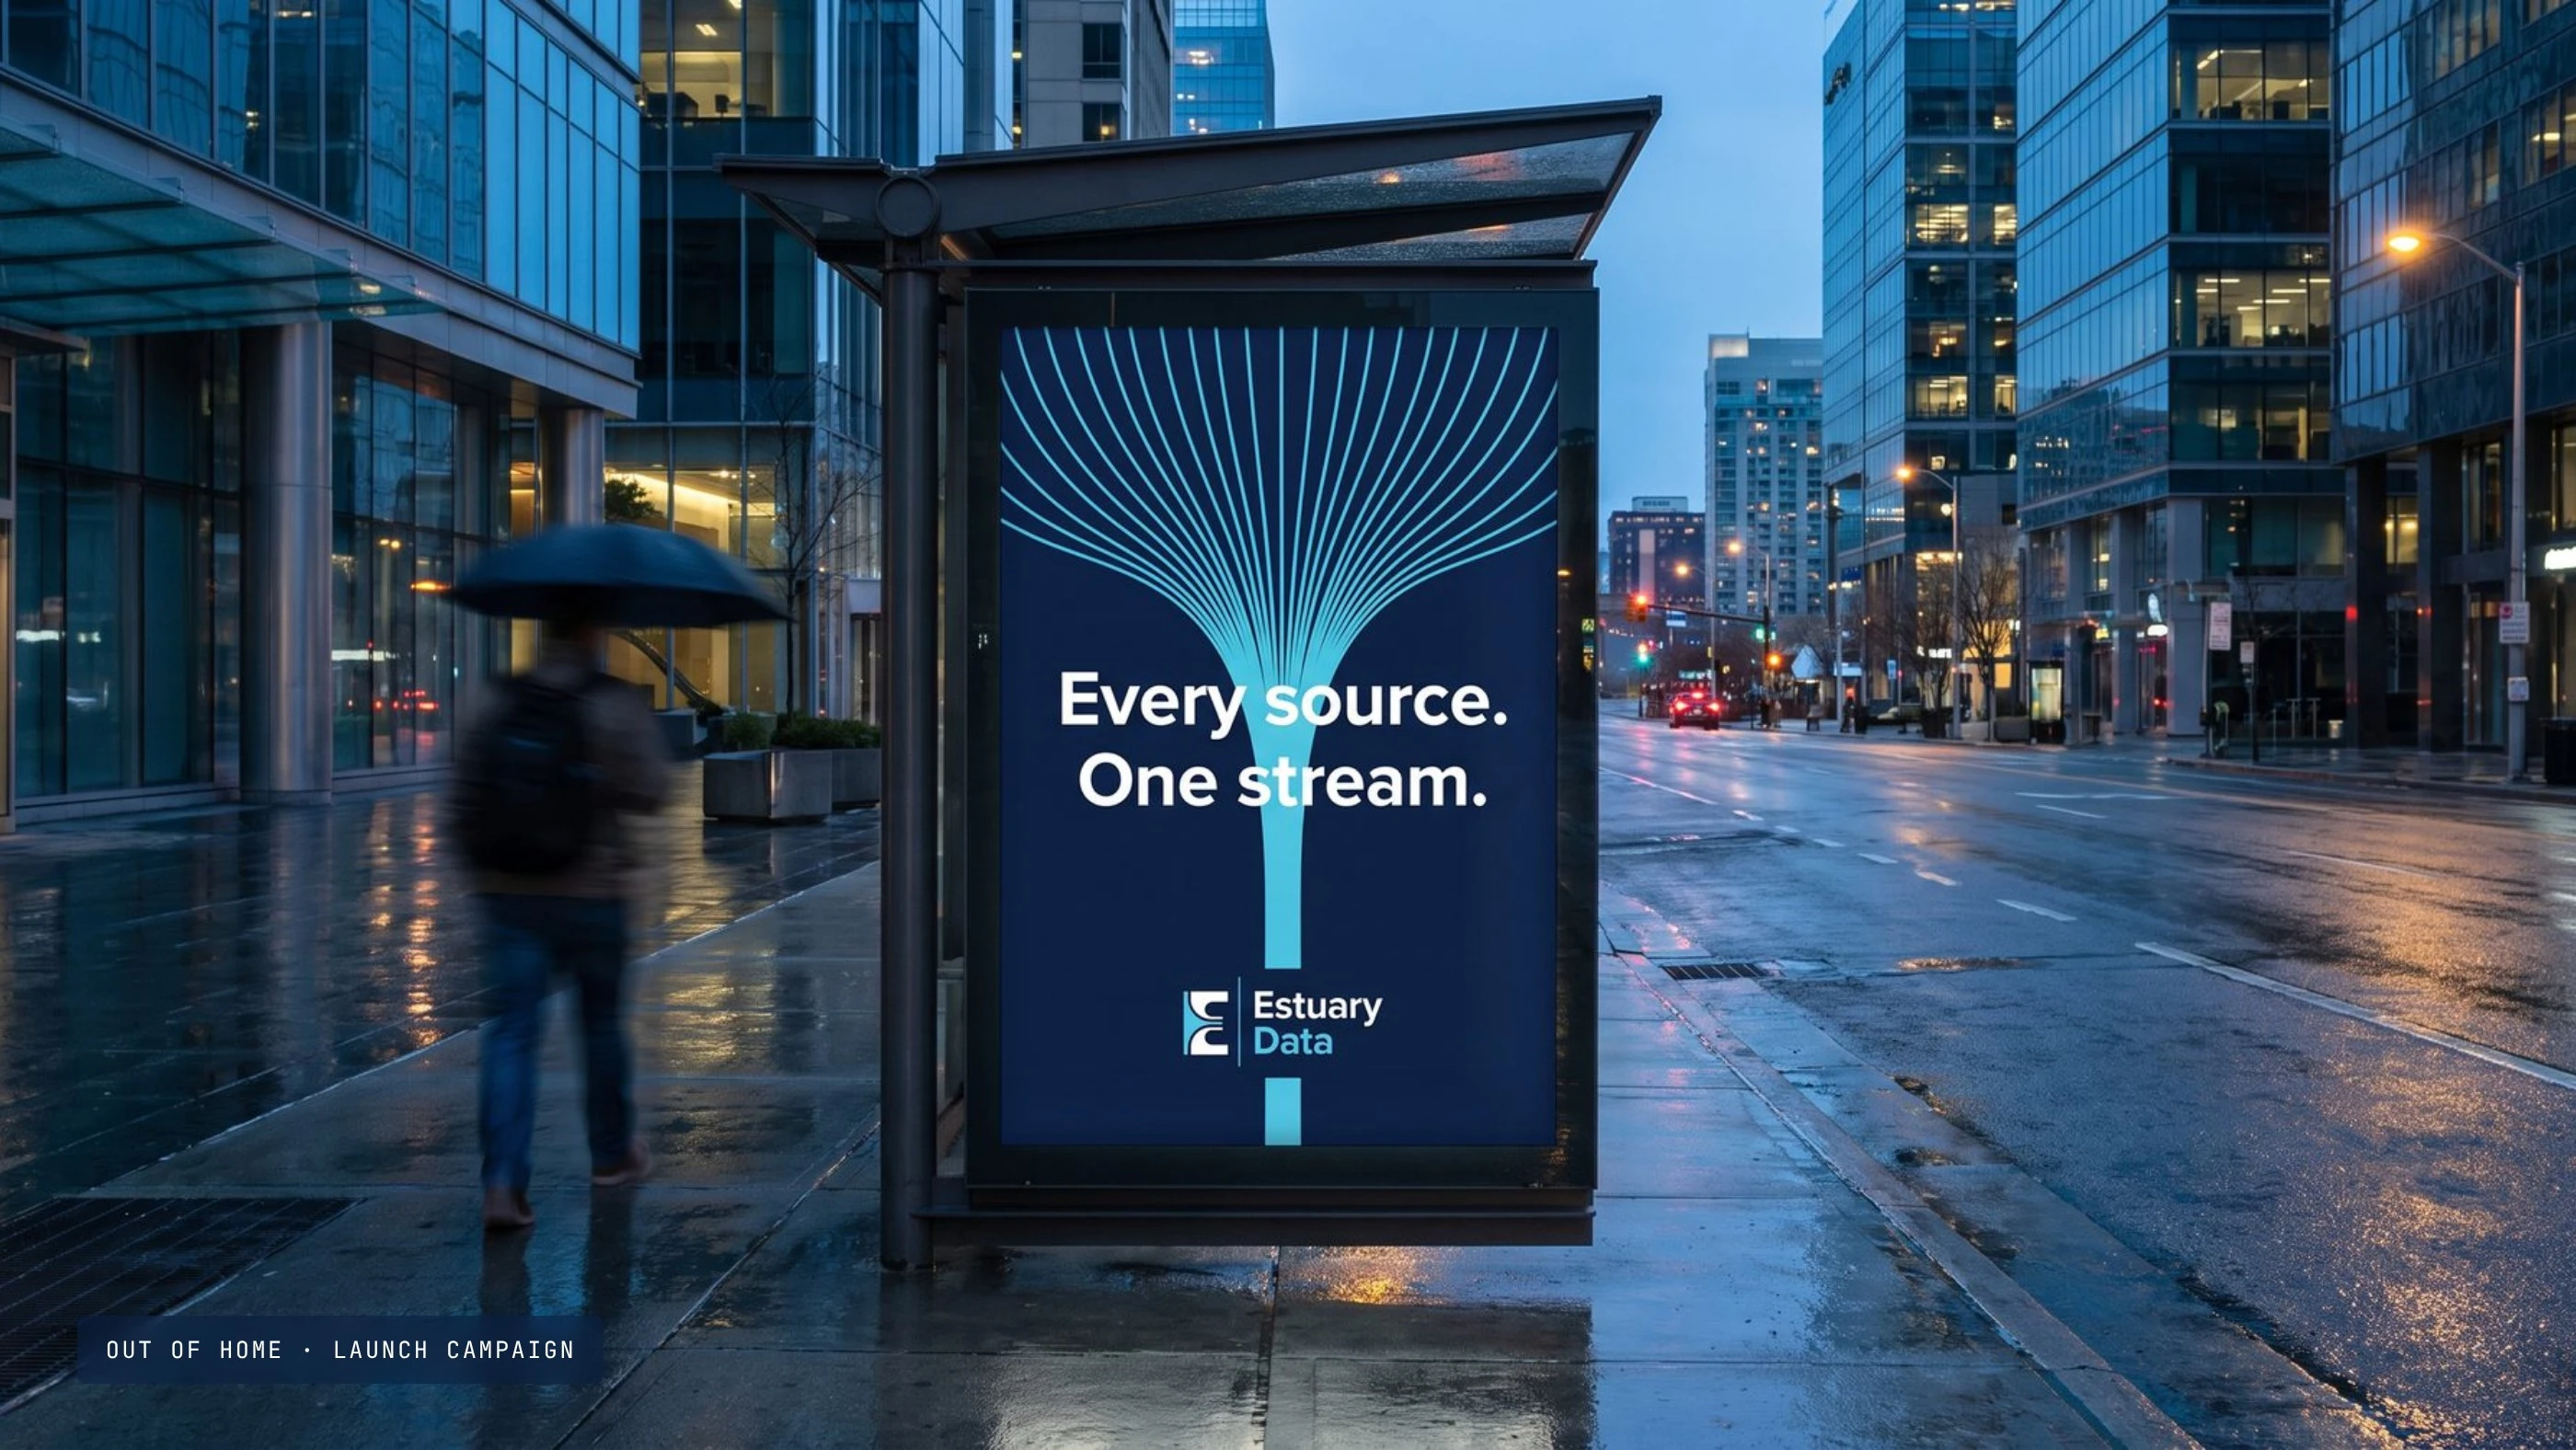
That single line then runs the whole system: a deep-water palette, a line pattern where many strokes resolve into one, a minimal product UI that uses cyan only where data moves, and a short brand film.
#branding #brandidentity #logodesign #saas #visualidentity
Like this project