Sensor Time-Series Data Visualization & Analysis
Ameer Hamza Qureshi
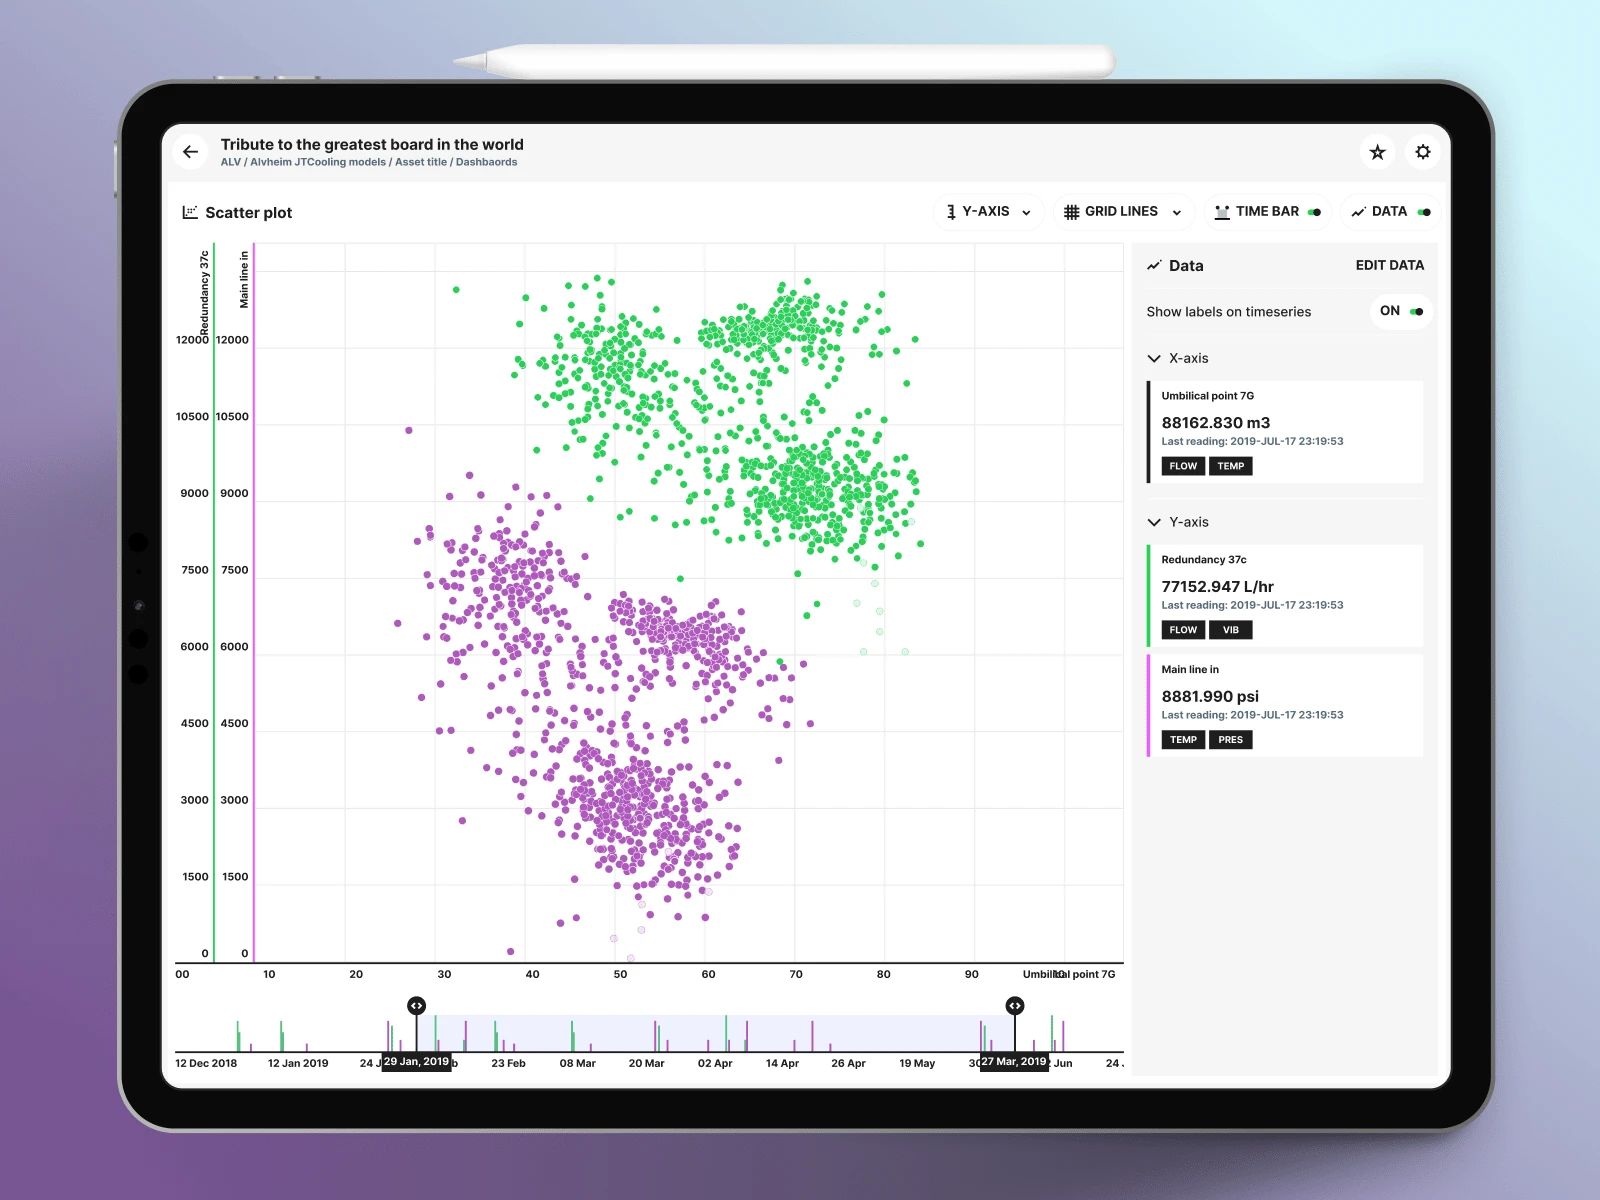
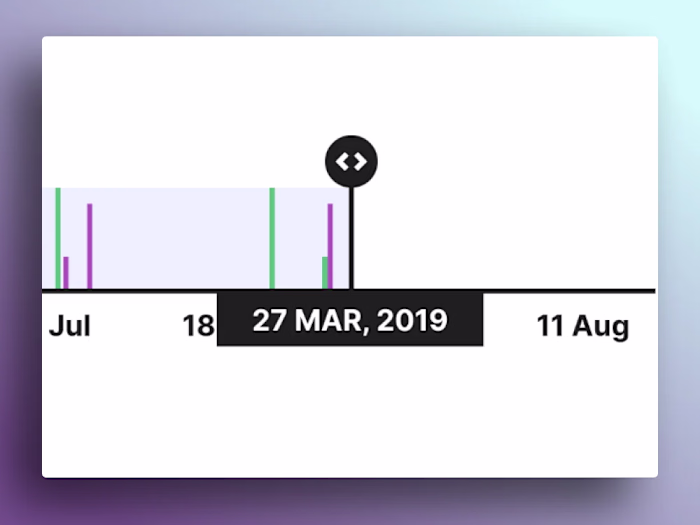
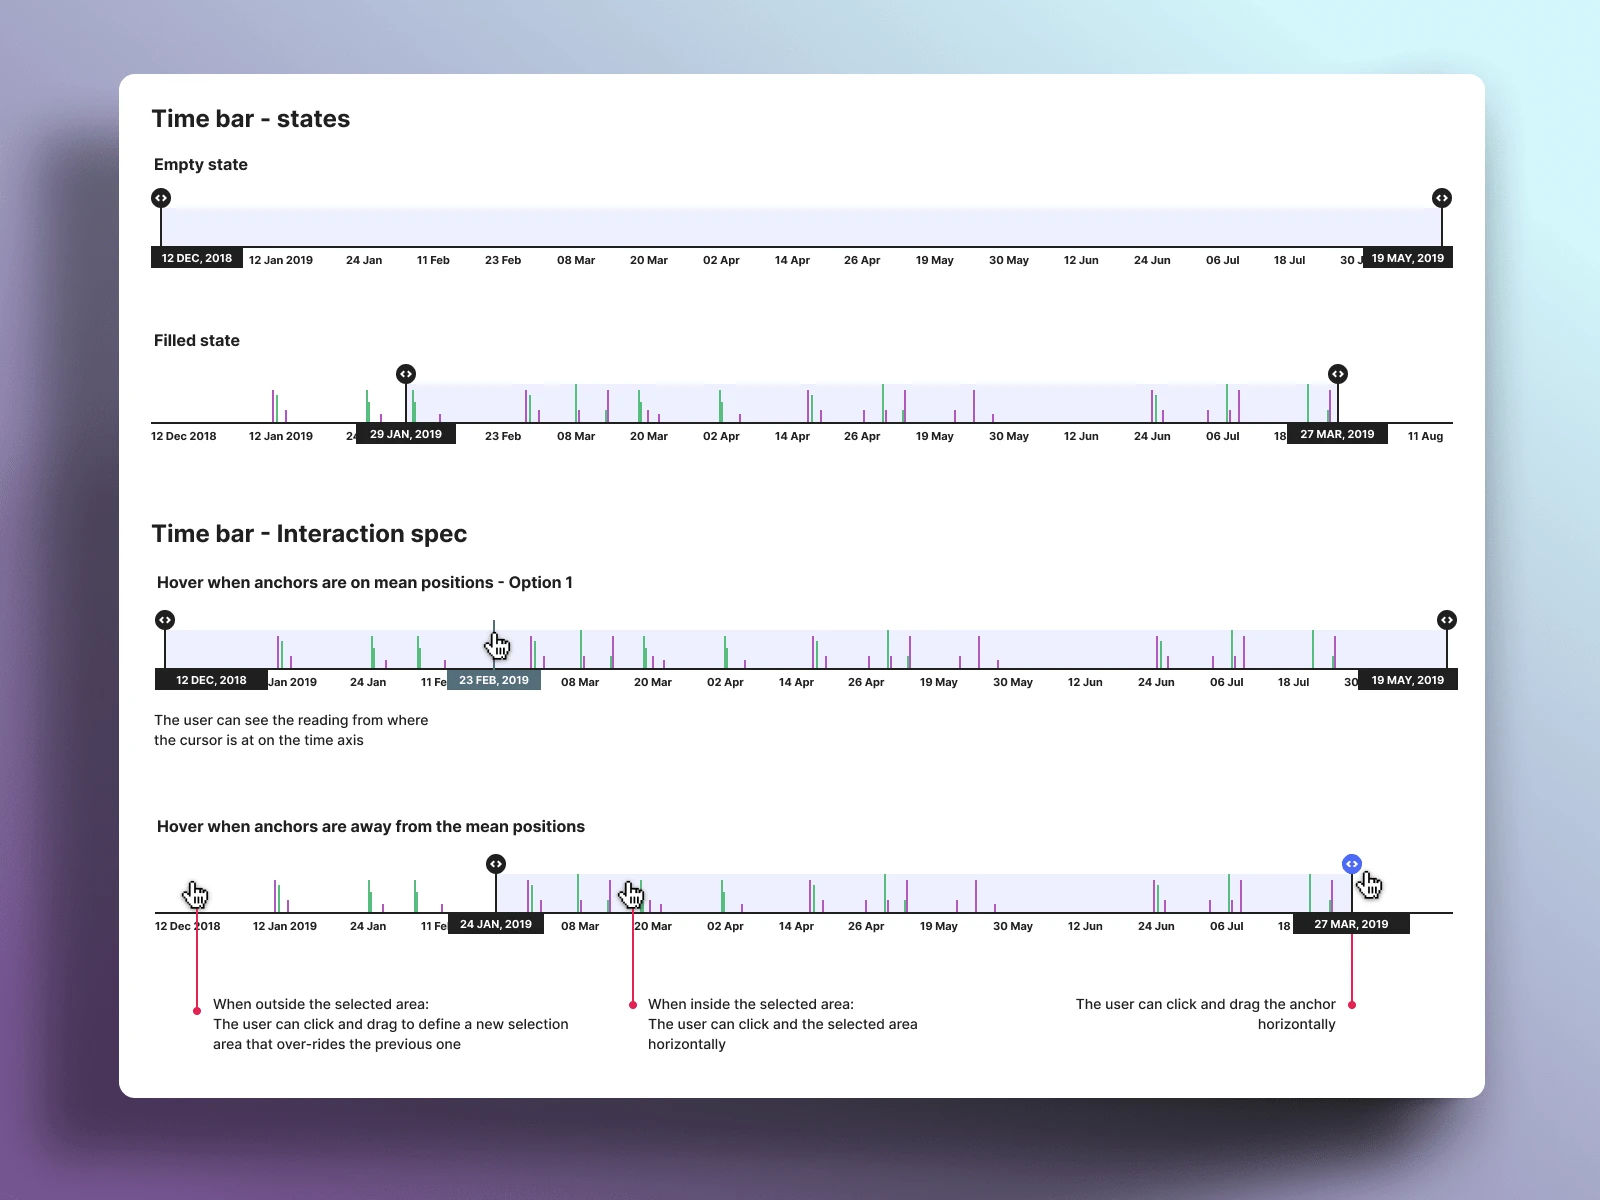
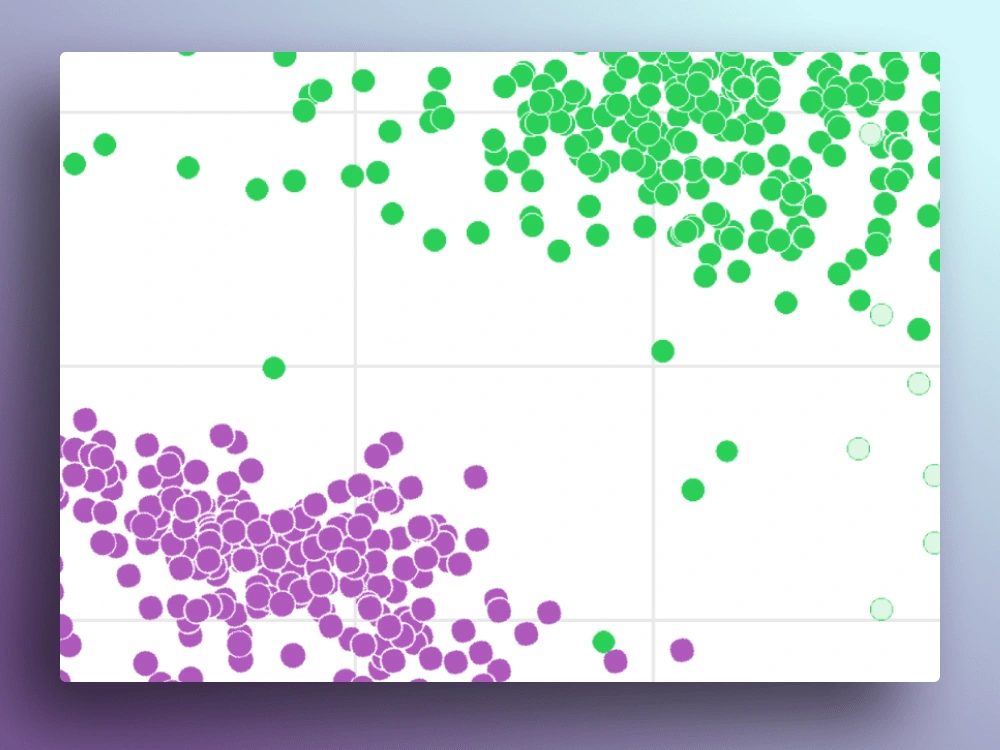
A scatter plot visualisation
MY ROLE: UI Designer (70%), UX Designer (20%), UX Researcher (10%)
TEAM: UX Designers, Front-end Engineers & Product Management
CLIENTS: Aker BP, Aker Solutions, TetraPak, +Others.
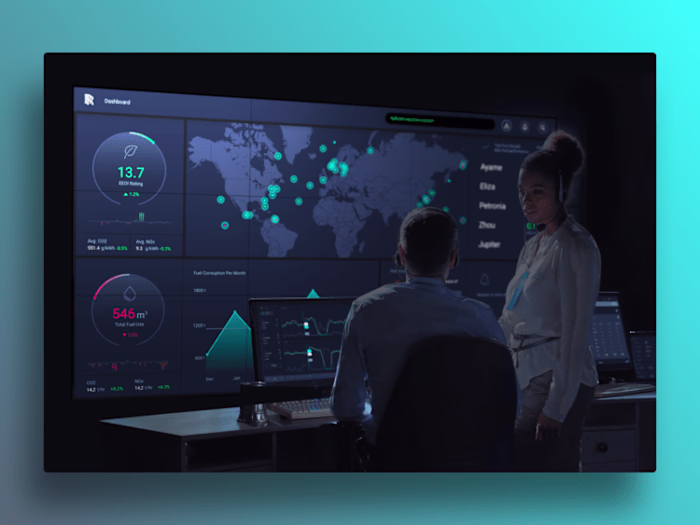
BACKGROUND: Heavy asset industries involve massive systems with electrical and mechanical equipment requiring constant monitoring. These systems are equipped with numerous sensors, resulting in a vast amount of time-series data. Different suppliers provide various digital tools for data access, creating a complex monitoring environment for engineers.
TASKS:
Understand the tasks of test groups of engineers and provide solutions through the Cognite Data Platform.
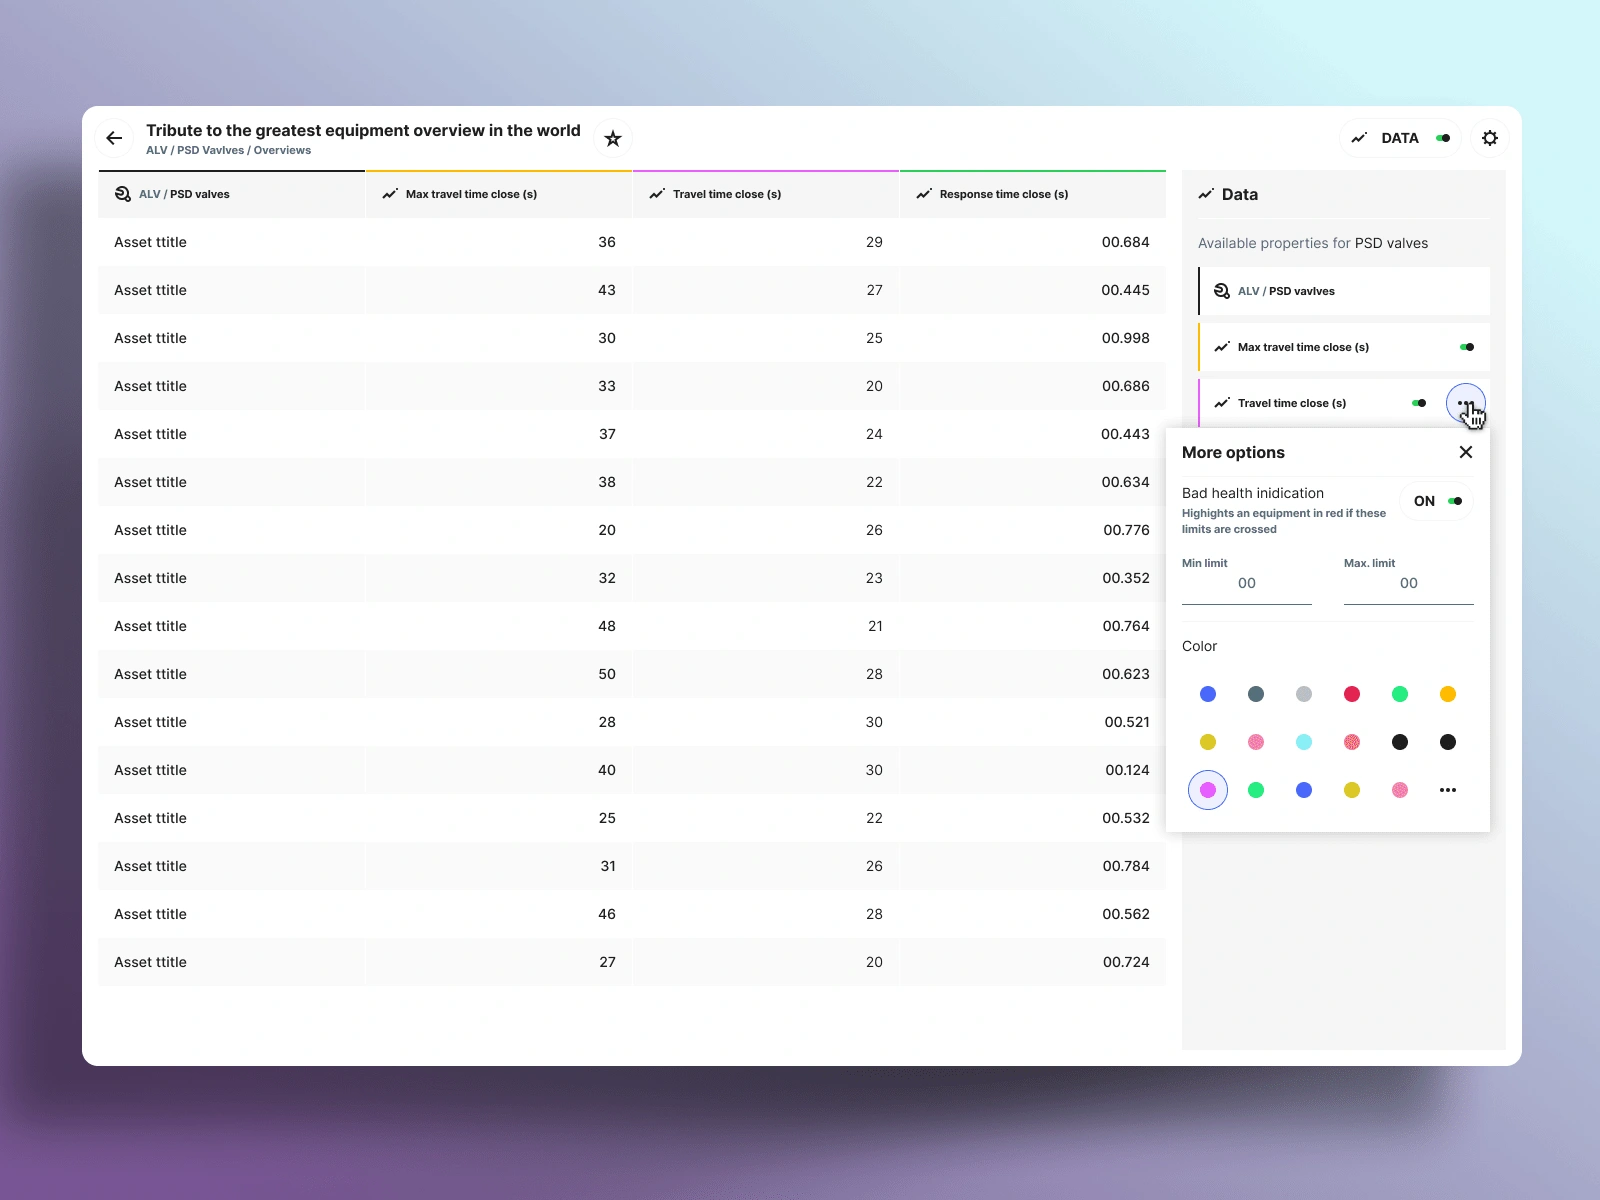
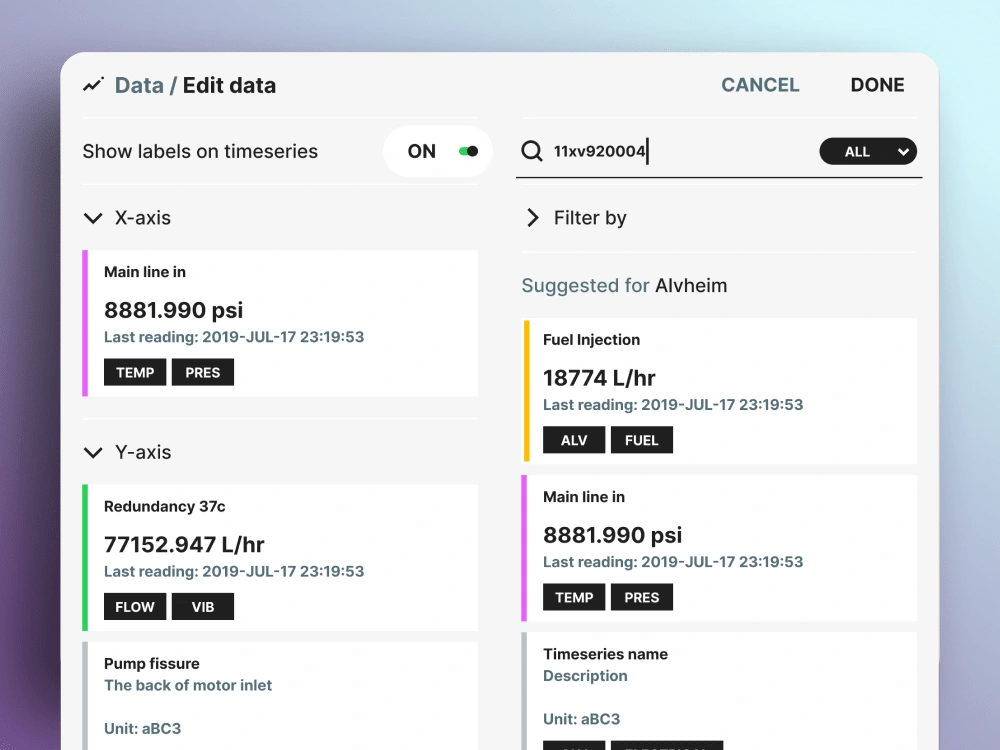
Provide access to time-series data from various systems and enable custom visualizations in dashboards.
Explore ways for the Cognite Data Platform to be beneficial to Aker BP.
CHALLENGES:
Designing a one-size-fits-all solution was impossible due to the complexity of tasks, even with daily feedback, shadow sessions, and site visits.
The lack of standard sensor naming across systems made data standardization difficult.
The project lacked a clear mission, making it more of an R&D exercise.
Like this project
Posted Jul 7, 2024
Understand the tasks of engineers and provide solutions through the Cognite Data Platform. Provide access to time-series data from various systems.
Likes
0
Views
21
Clients
Cognite