Mapping Writers in Chris Carter's TV Universe
Ihar Yanouski

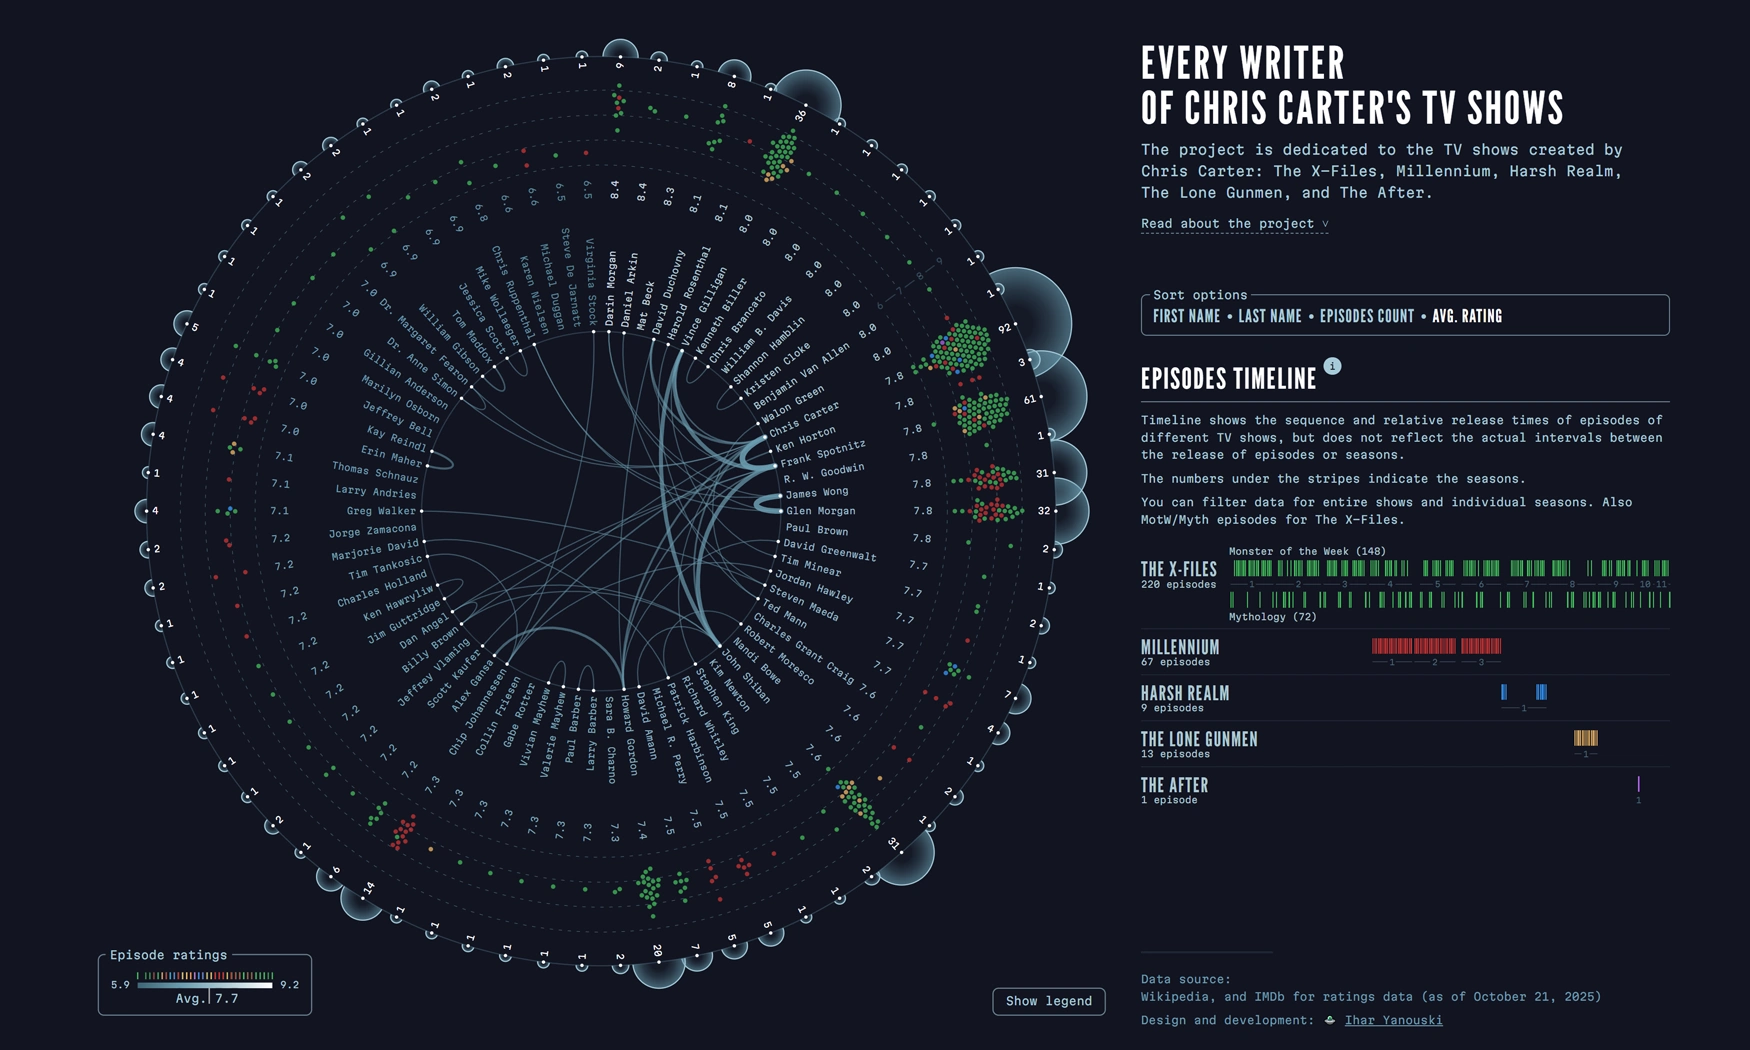
The interactive data visualization maps every writer who contributed to Chris Carter’s television universe. By connecting episodes to their authors across four major series, the project reveals patterns of collaboration, frequency of contribution, and cross-series involvement.
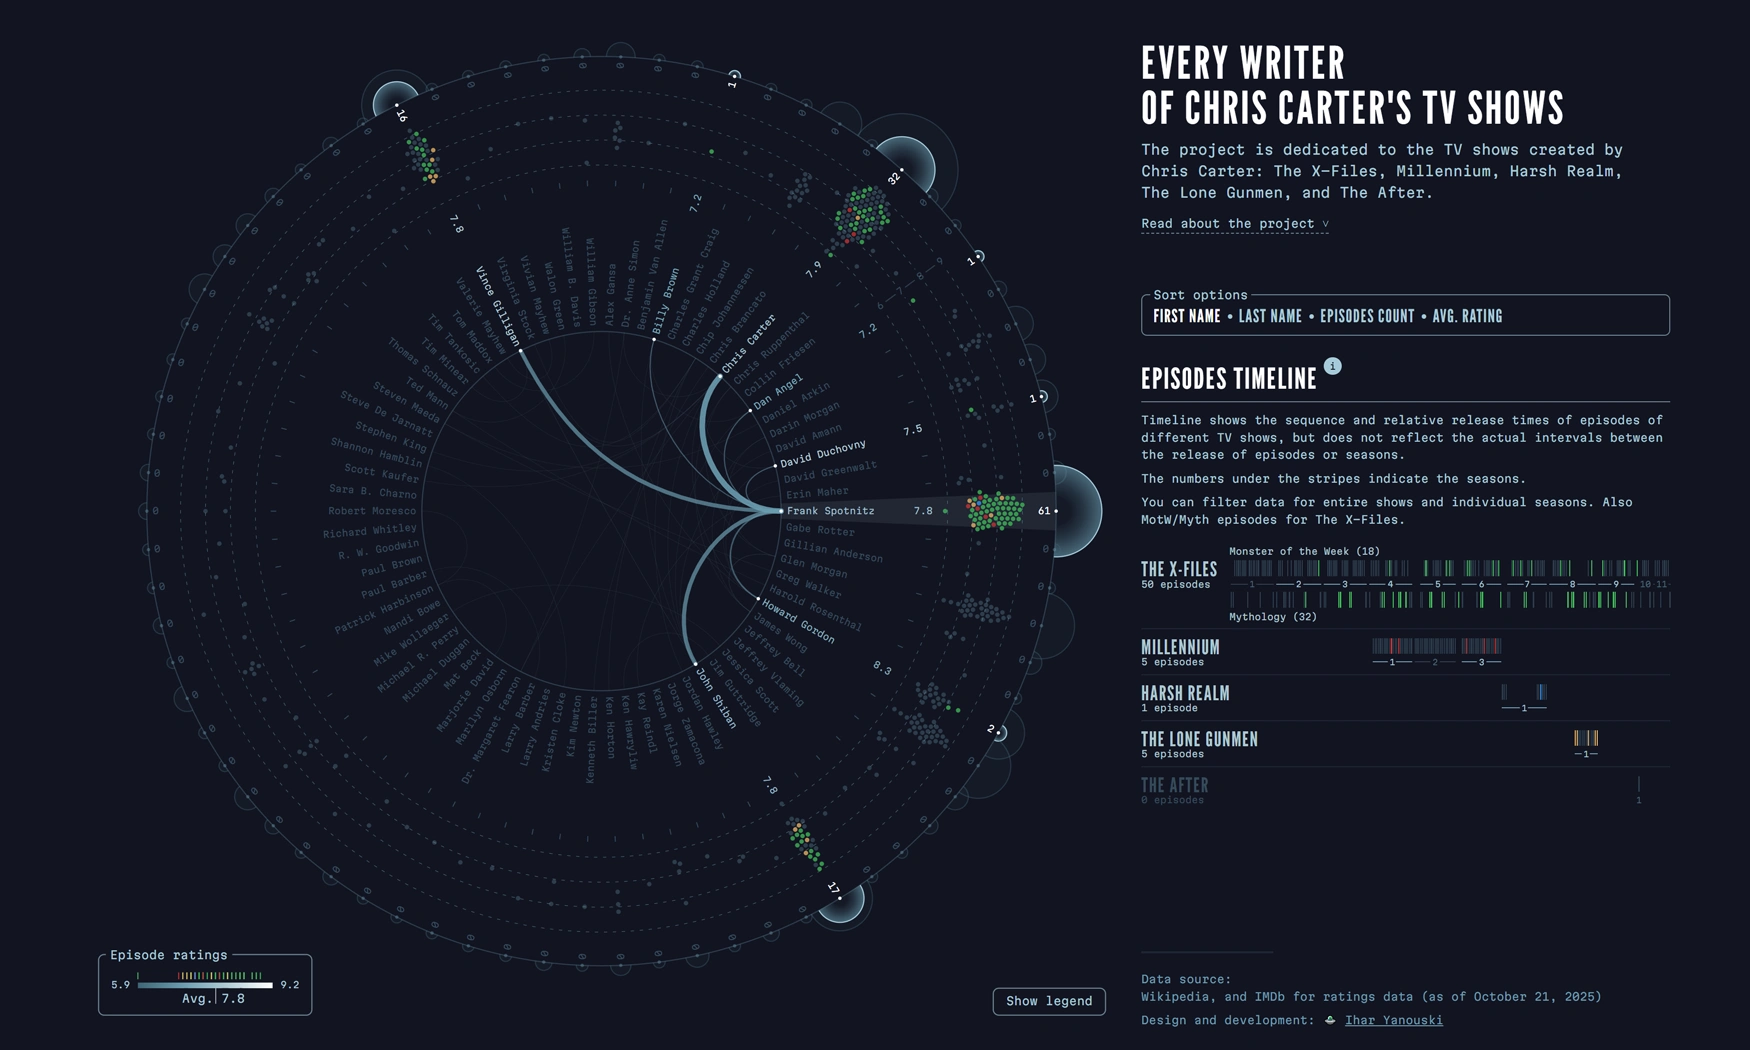
Desktop preview of the data visualization about The X-Files writers
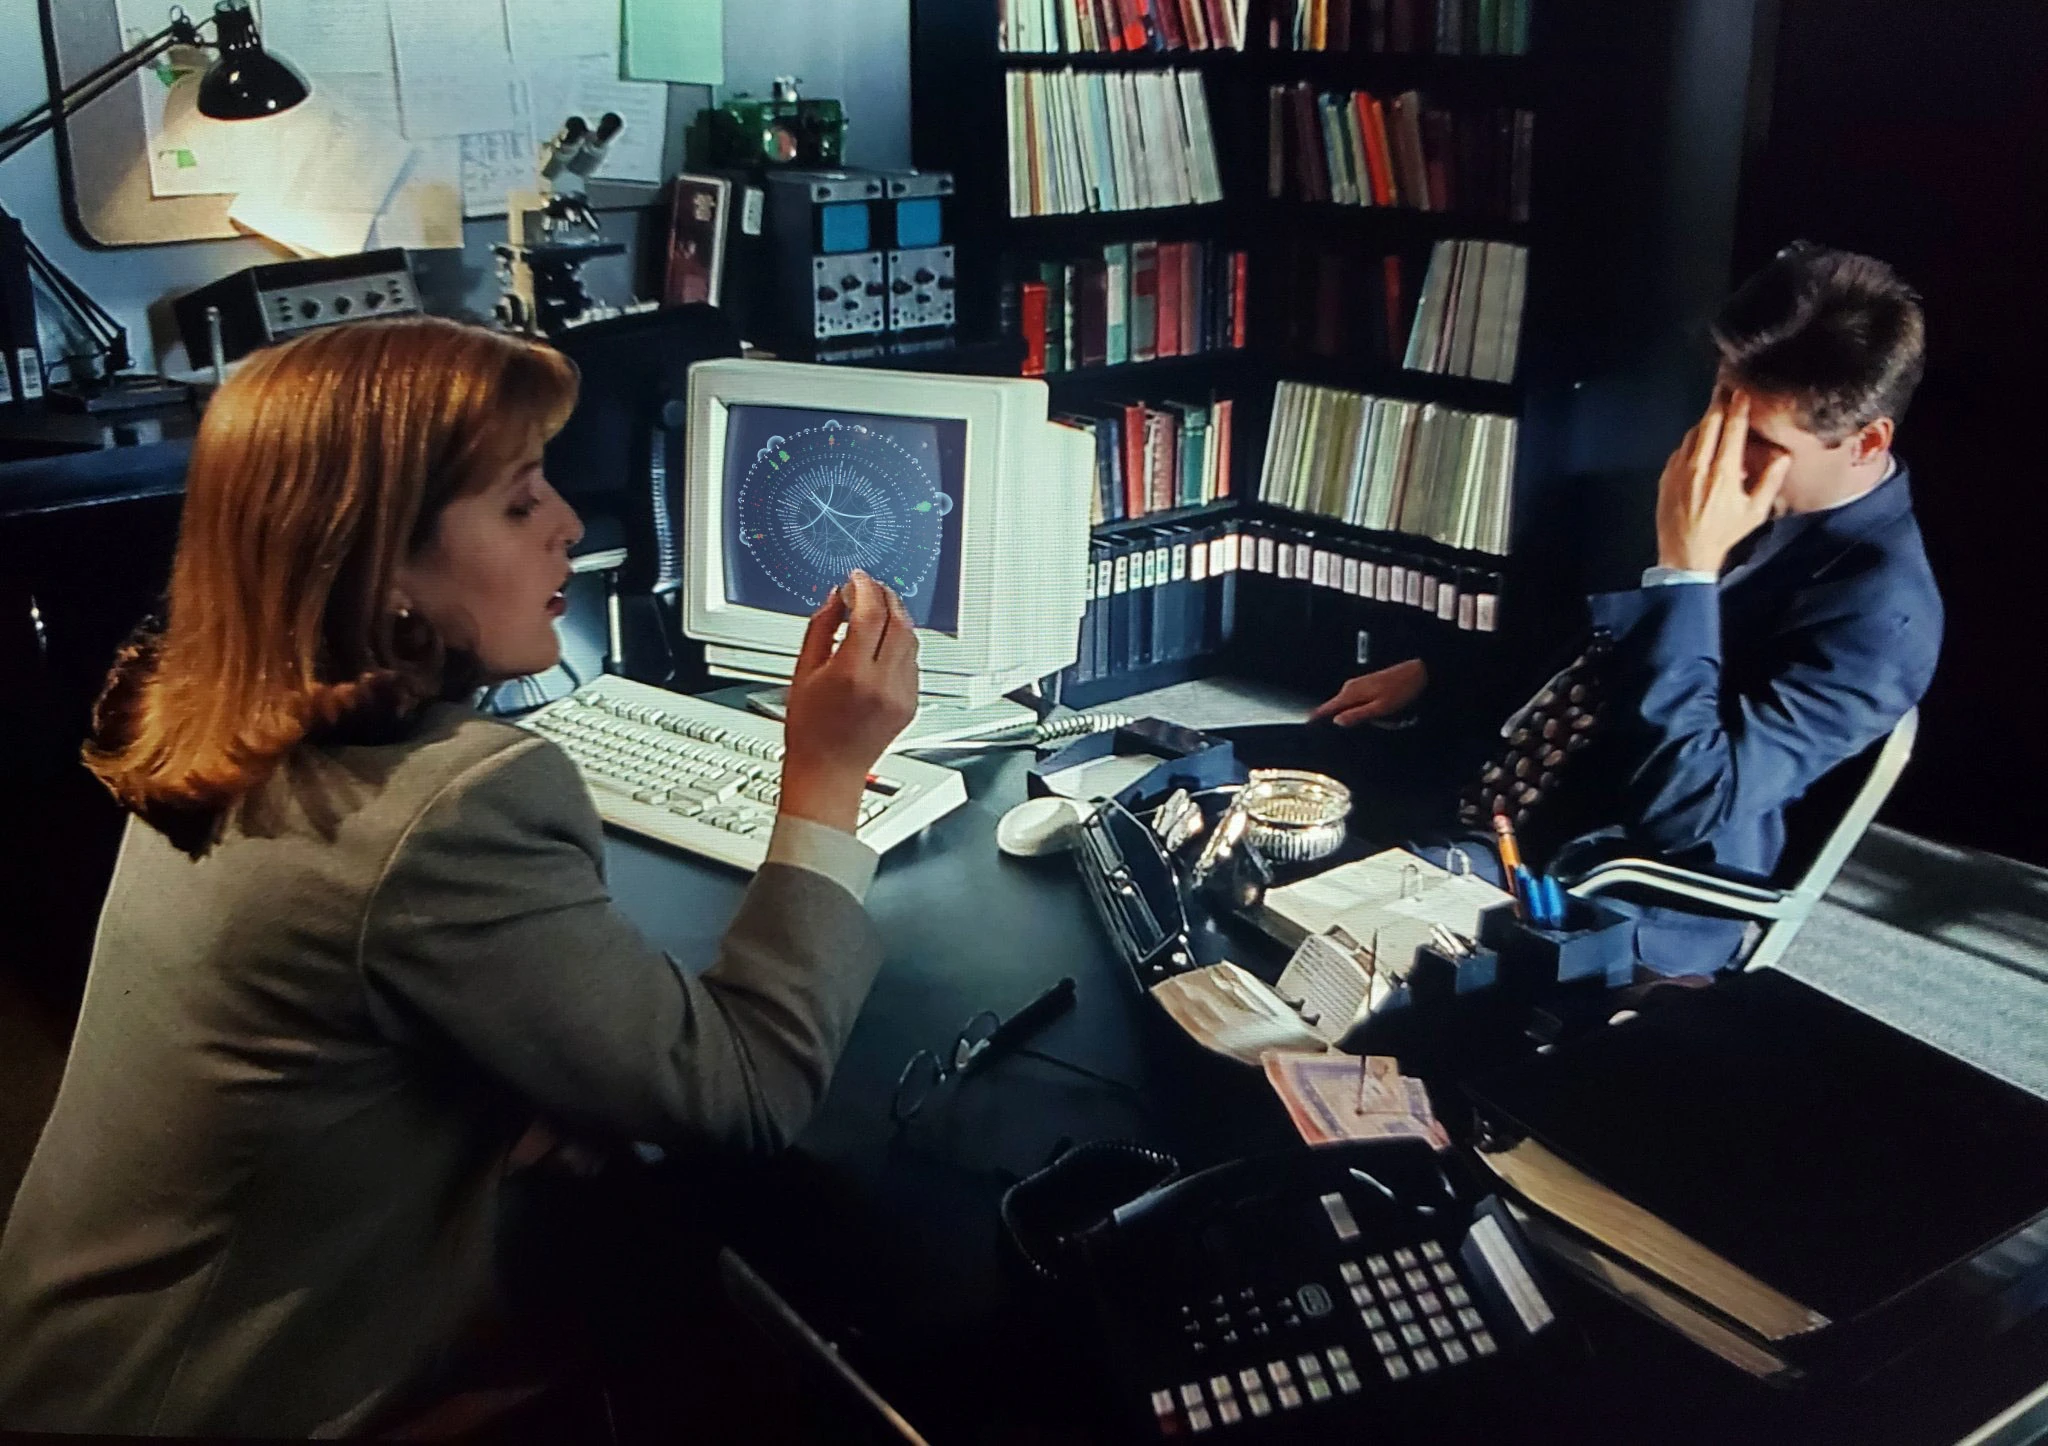
FBI agents at work: making sense of a mysterious round object
Interaction options allow for detailed exploration of individual screenwriters

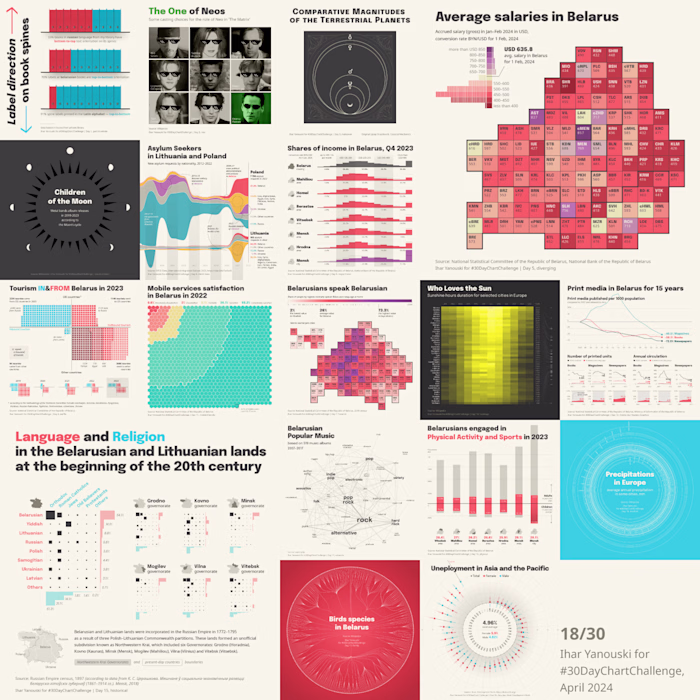
Different states of a circular chart
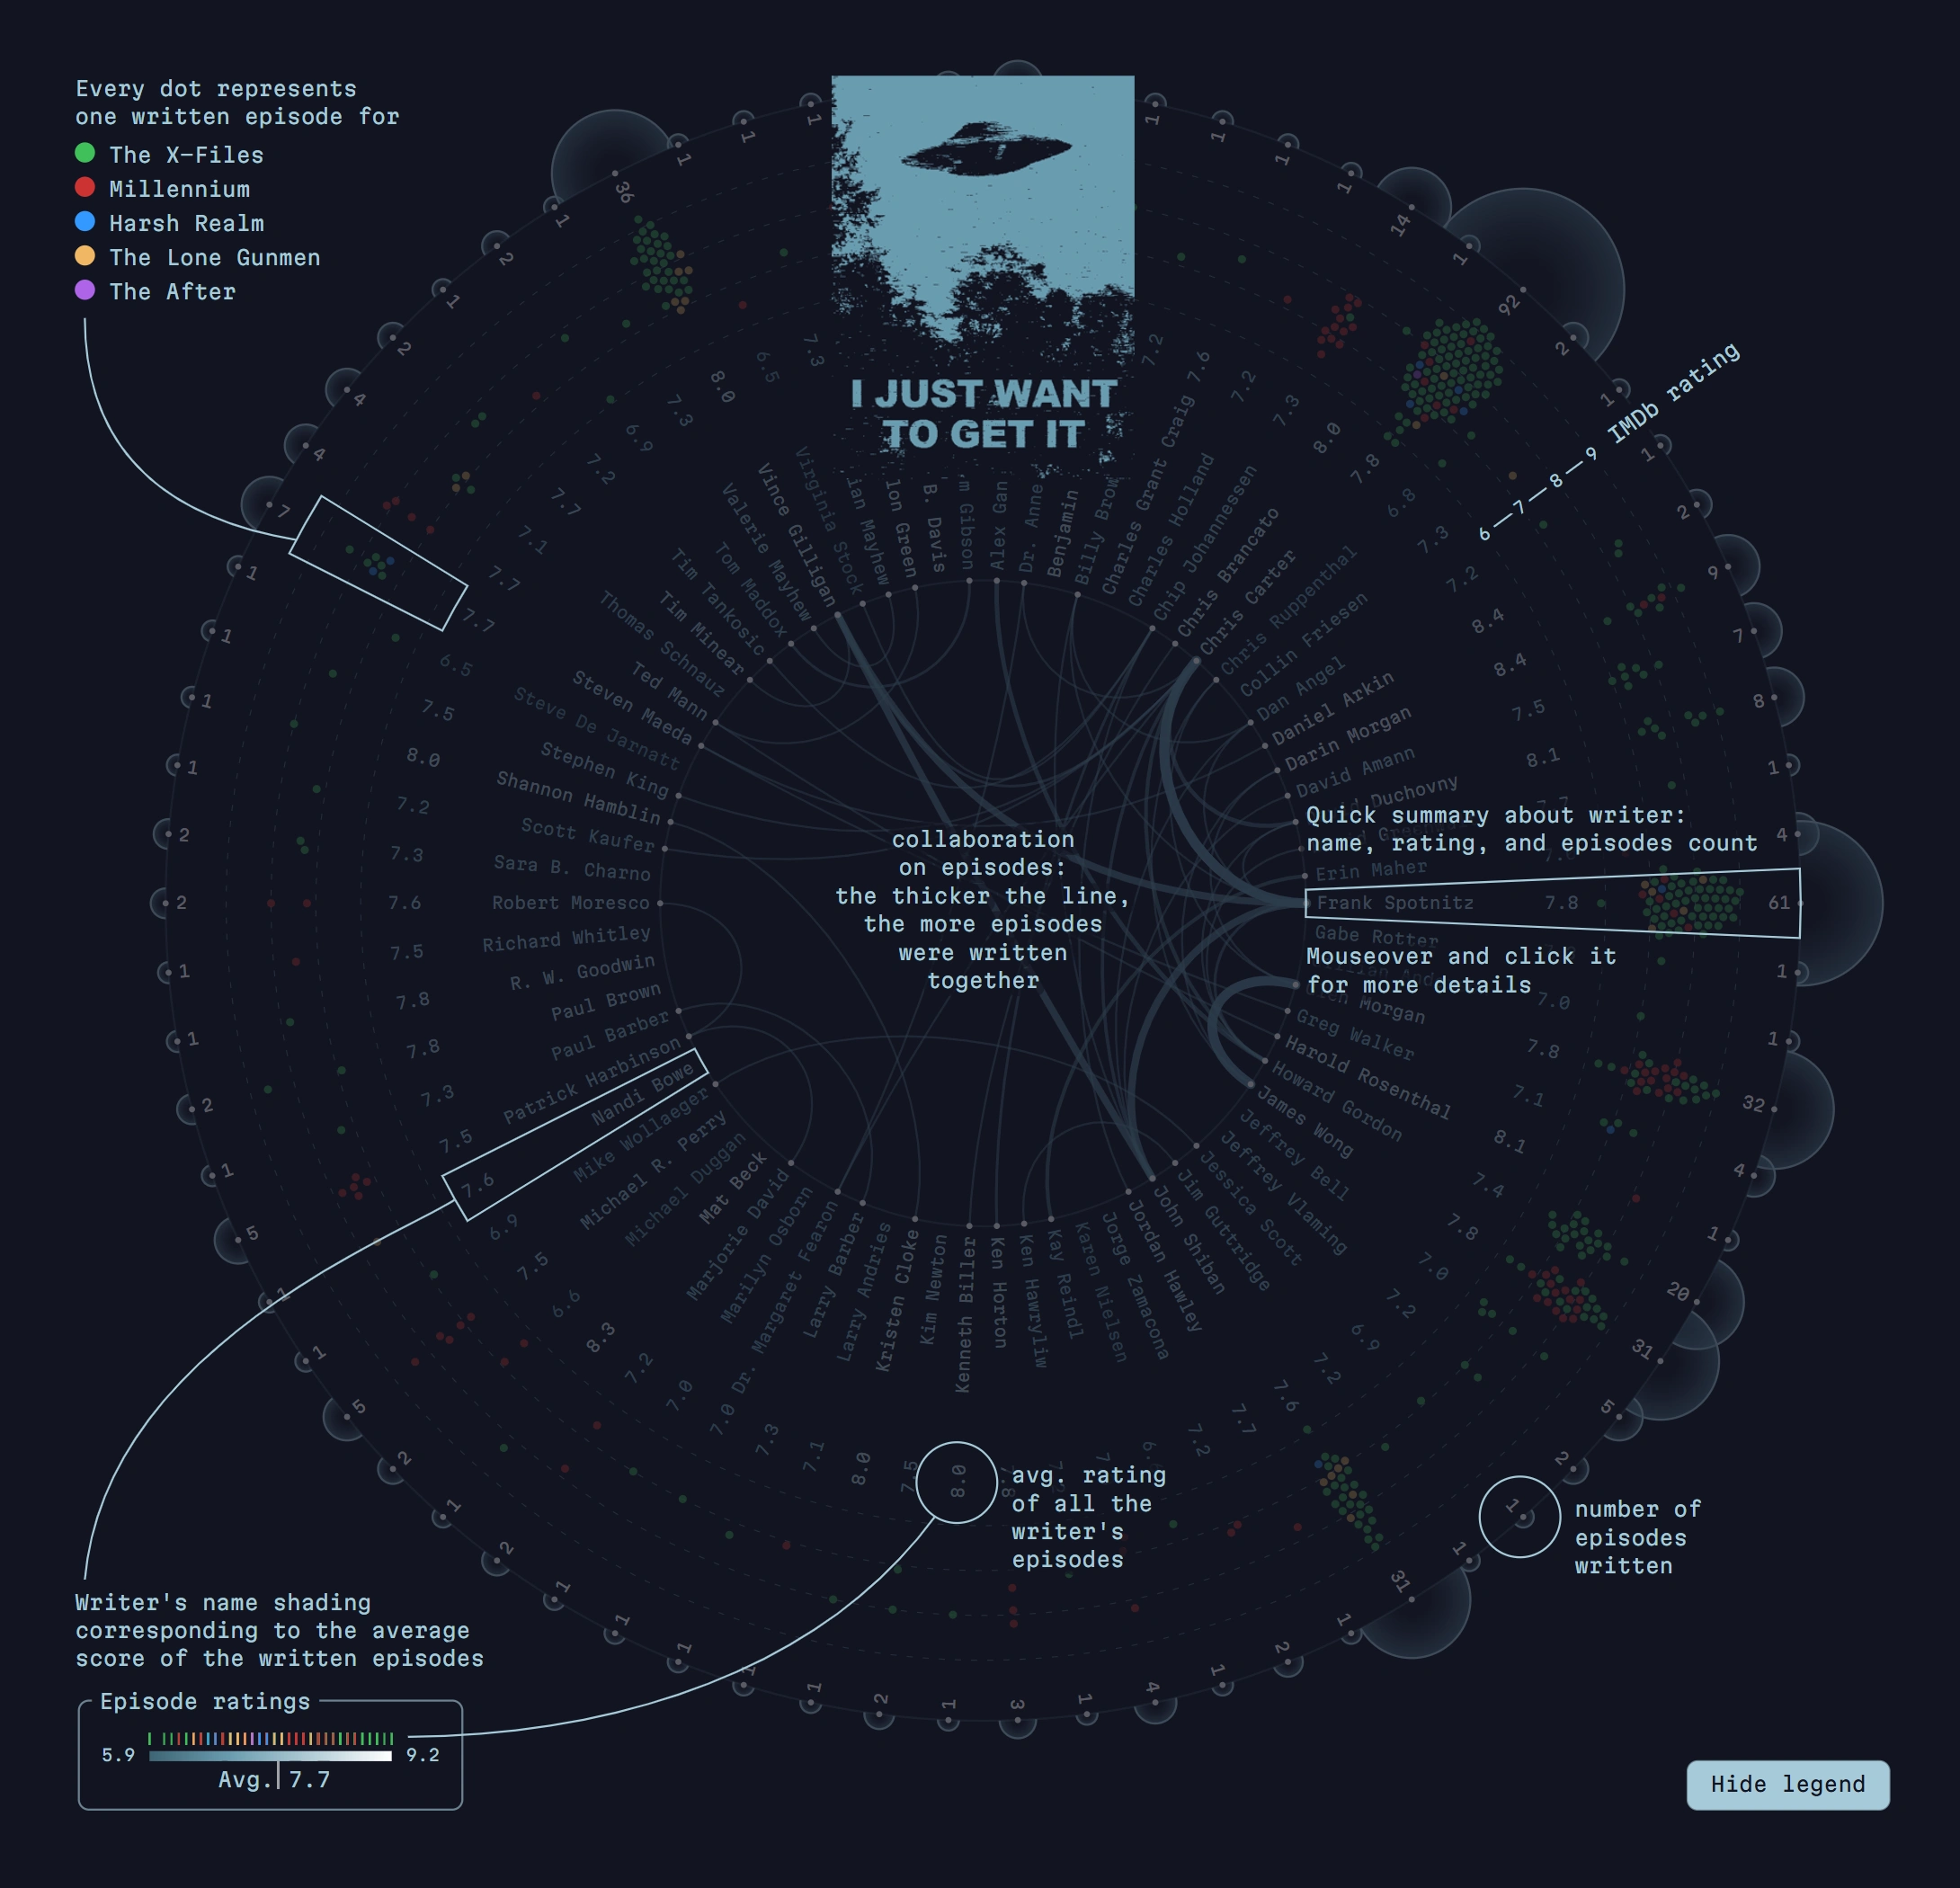
Chart legend for the complex data visualization, which displays the collaboration of the screenwriters of Chris Carter's TV shows: X-Files, Millennium, Harsh Realm, and The Lone Gunmen
Data sources: Wikipedia, IMDb
My role: concept, data curation and research, design, and development
Tools used: Svelte and D3.js
Find more about the project at https://yanouski.com/work/xfiles-writers/
—Mulder? It's me.
Like this project
Posted Oct 30, 2025
Interactive visualization mapping writers in Chris Carter's TV universe.
Likes
0
Views
10