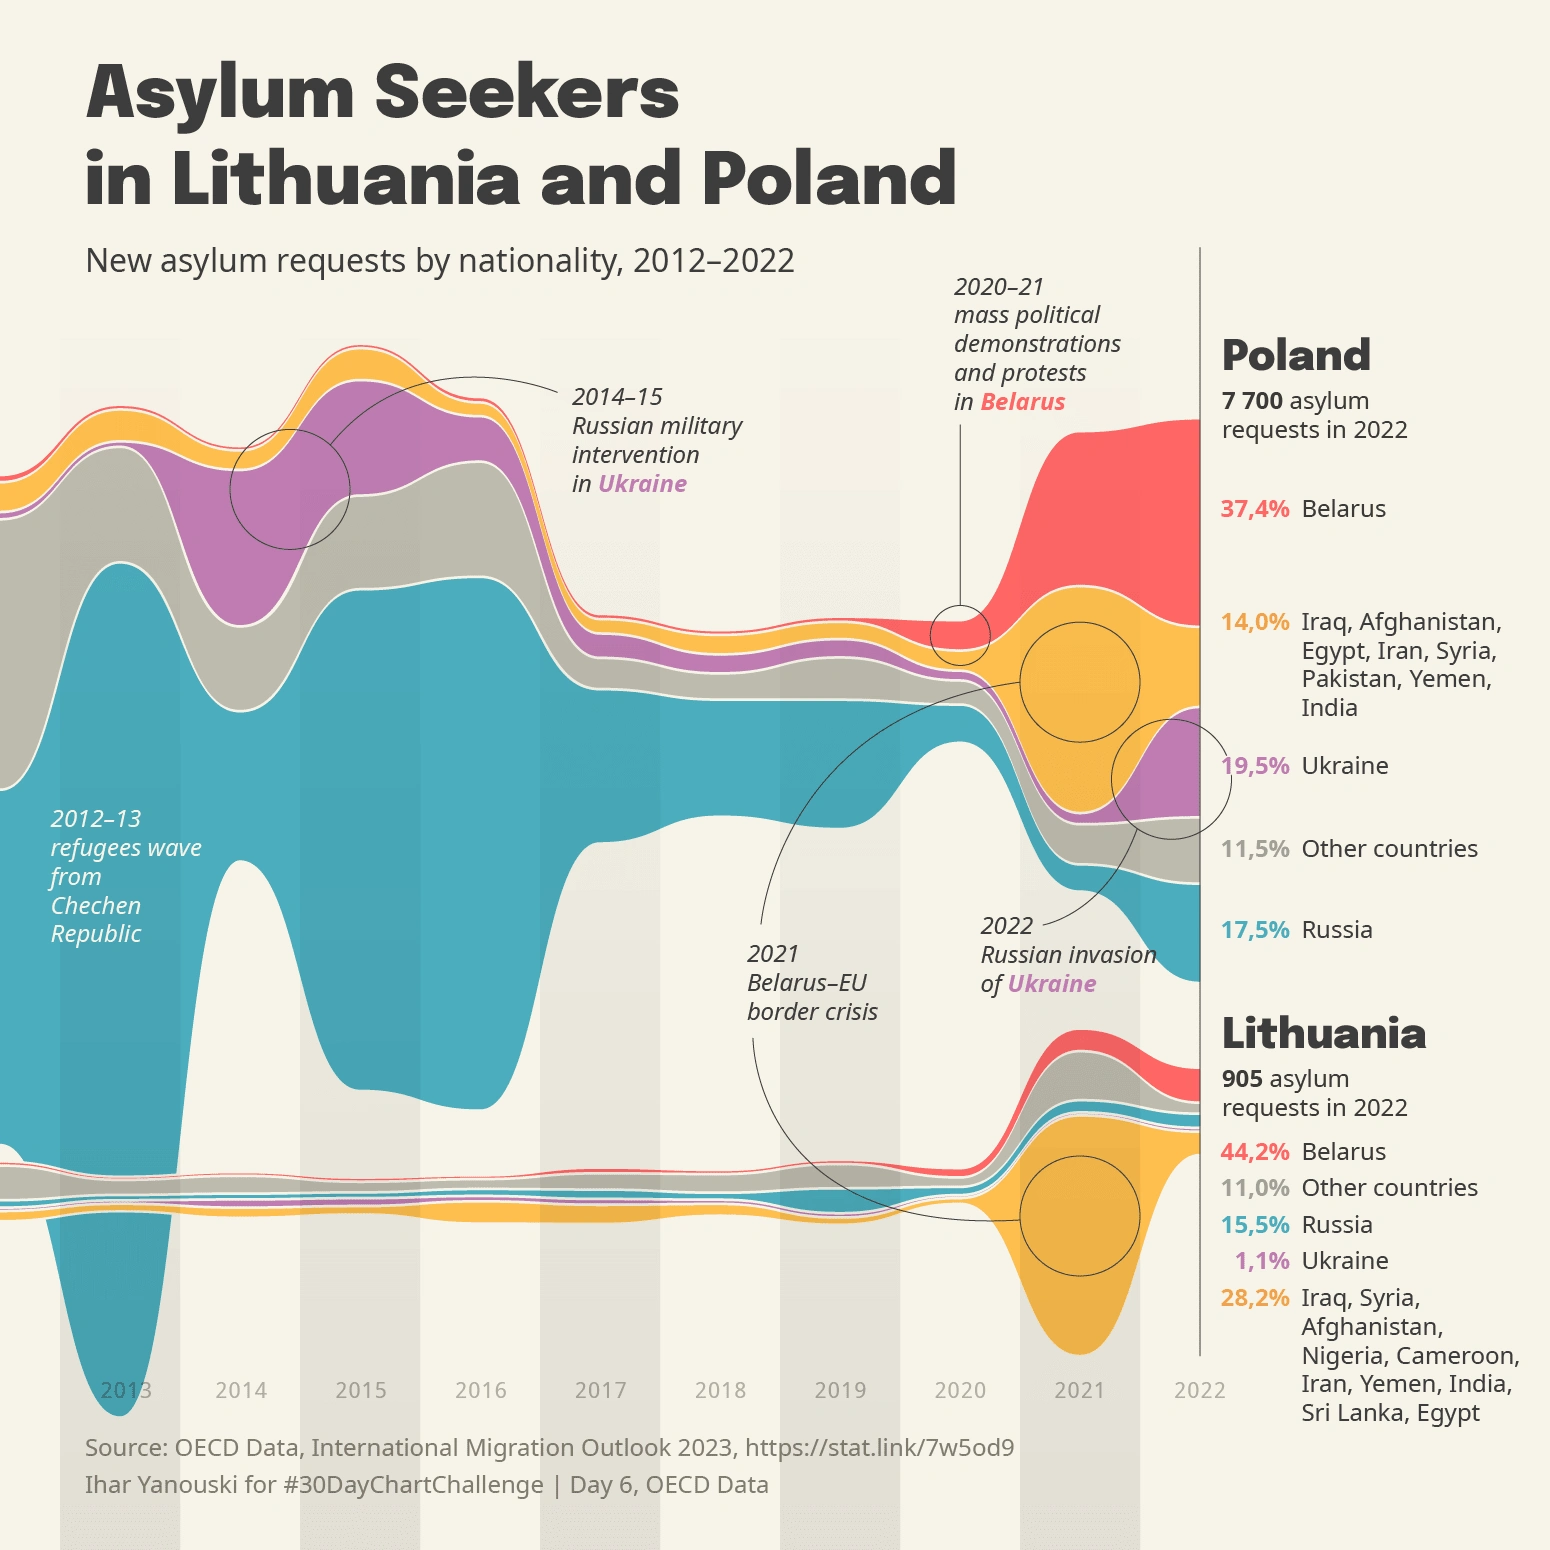
#30DaysChartChallenge
Ihar Yanouski
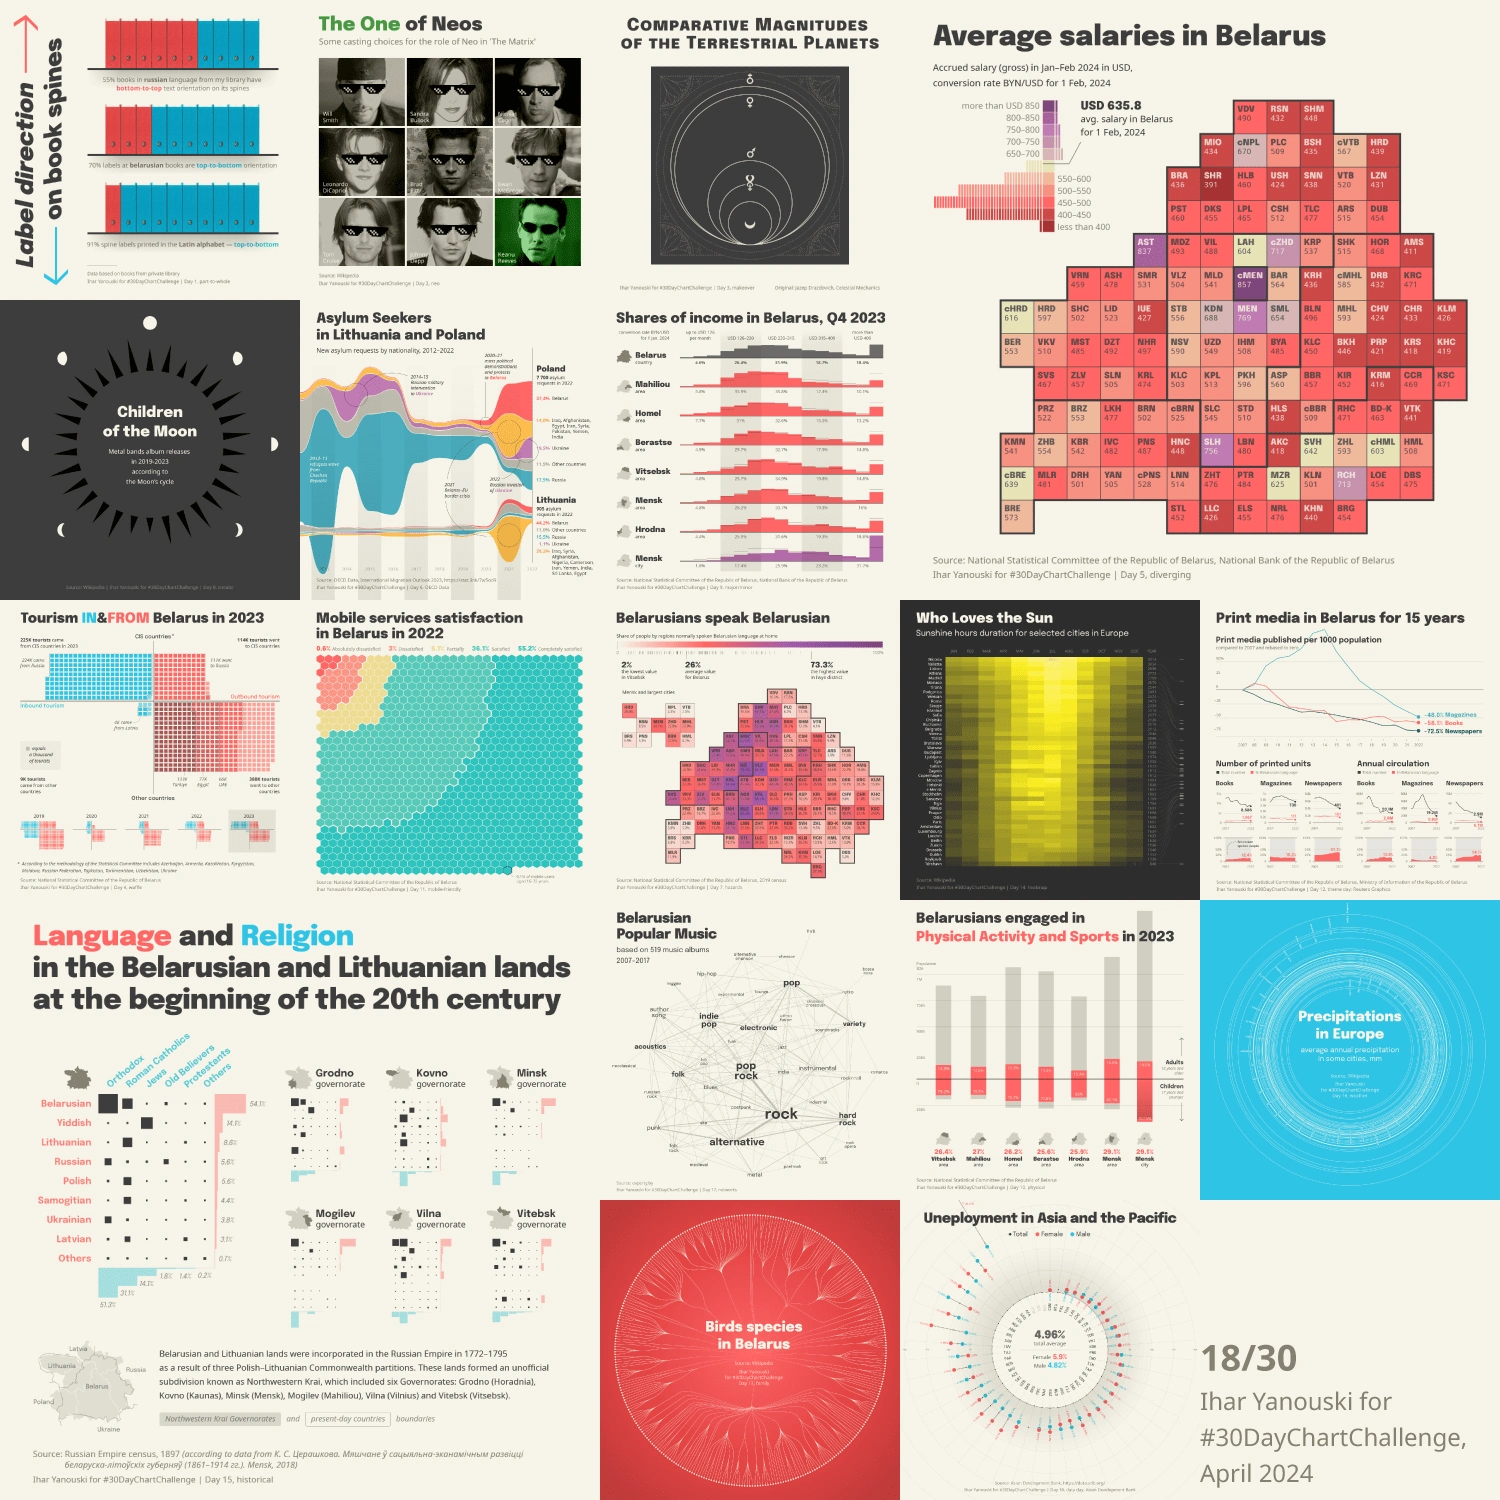
Static charts that were made in April 2024 based on the daily prompts as a contribution to the #30DayChartChallenge.
You are welcome to see other pieces following the link below:
https://yanouski.com/work/30-days-chart-challenge-2024/
Like this project
Posted Jul 17, 2024
Static charts that were made based on the daily prompts as a contribution to the challenge
Likes
0
Views
22