Interactive charts for devby media
Ihar Yanouski
devby media publishes news and stories about Belarusian Tech industry. Among other things it conducts research, surveys the community and publishes the results.
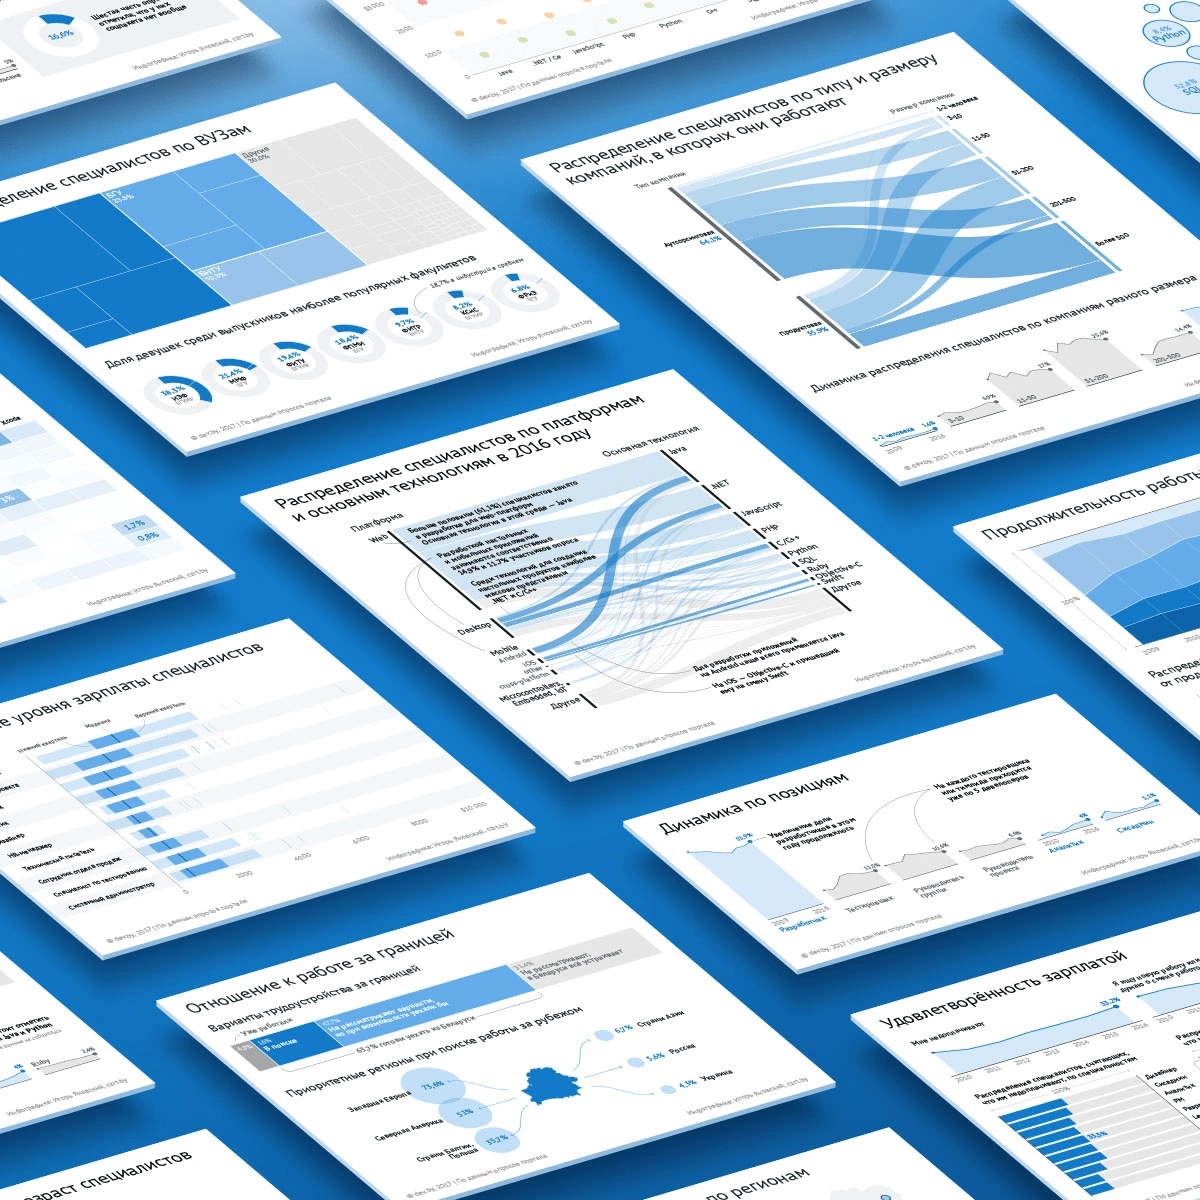
I was contributed to design and develop interactive charts for the annual state of industry publication. Started with a raw csv I
processed the data,
designed charts and developed templates,
built interactive modules, and
provided optimised static data visualizations for mobile view.
Like this project
Posted Jul 17, 2024
Interactive data visualization modules for annual state of Belarus Tech industry report
Likes
1
Views
21