FIRST QUARTER, 2023 SUMMARY SALES REPORT
Fayomi Dele
PROJECT SUMMARY
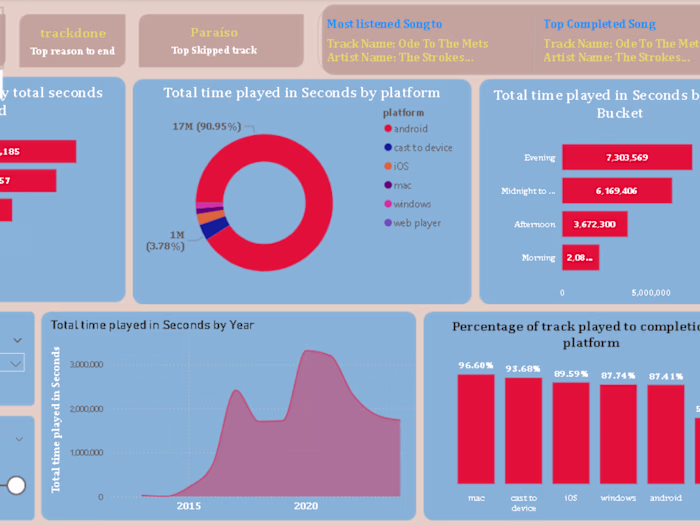
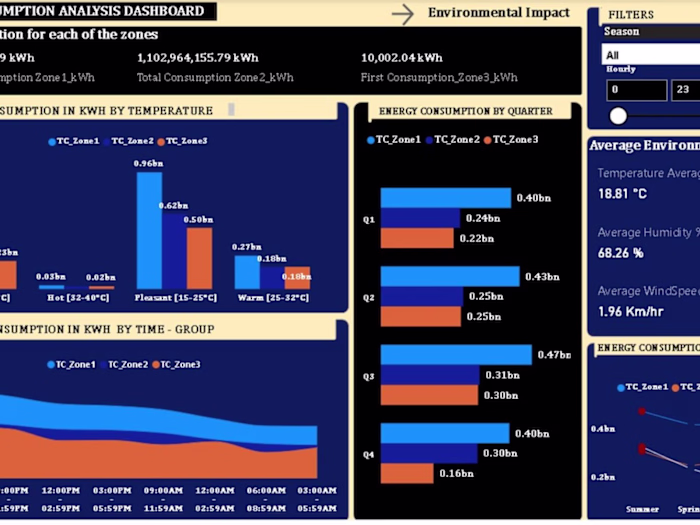
This dashboard provides a comprehensive overview of the restaurant's performance during the first quarter of 2023. It offers valuable insights into sales trends, customer preferences by cuisine type, and peak sales periods, which can be used to make informed business decisions. With the inclusion of interactive filters, users can explore the data from different perspectives, allowing for more flexible and in-depth analysis.
Like this project
Posted Jan 8, 2025
Analyzed and visualized the sales data for Q1 2023 using Power BI. Created dashboards to highlight key metrics such as total revenue, sales trends and the likes