E-commerce Sales & Profitability Dashboard

Timur Chanaev

The Challenge
Raw order data showed sales, but not which channels, product categories, or customer segments were actually driving profitable growth. The goal was to turn order-level data into a clear view of revenue, contribution profit, returns, and customer behavior.
The Solution
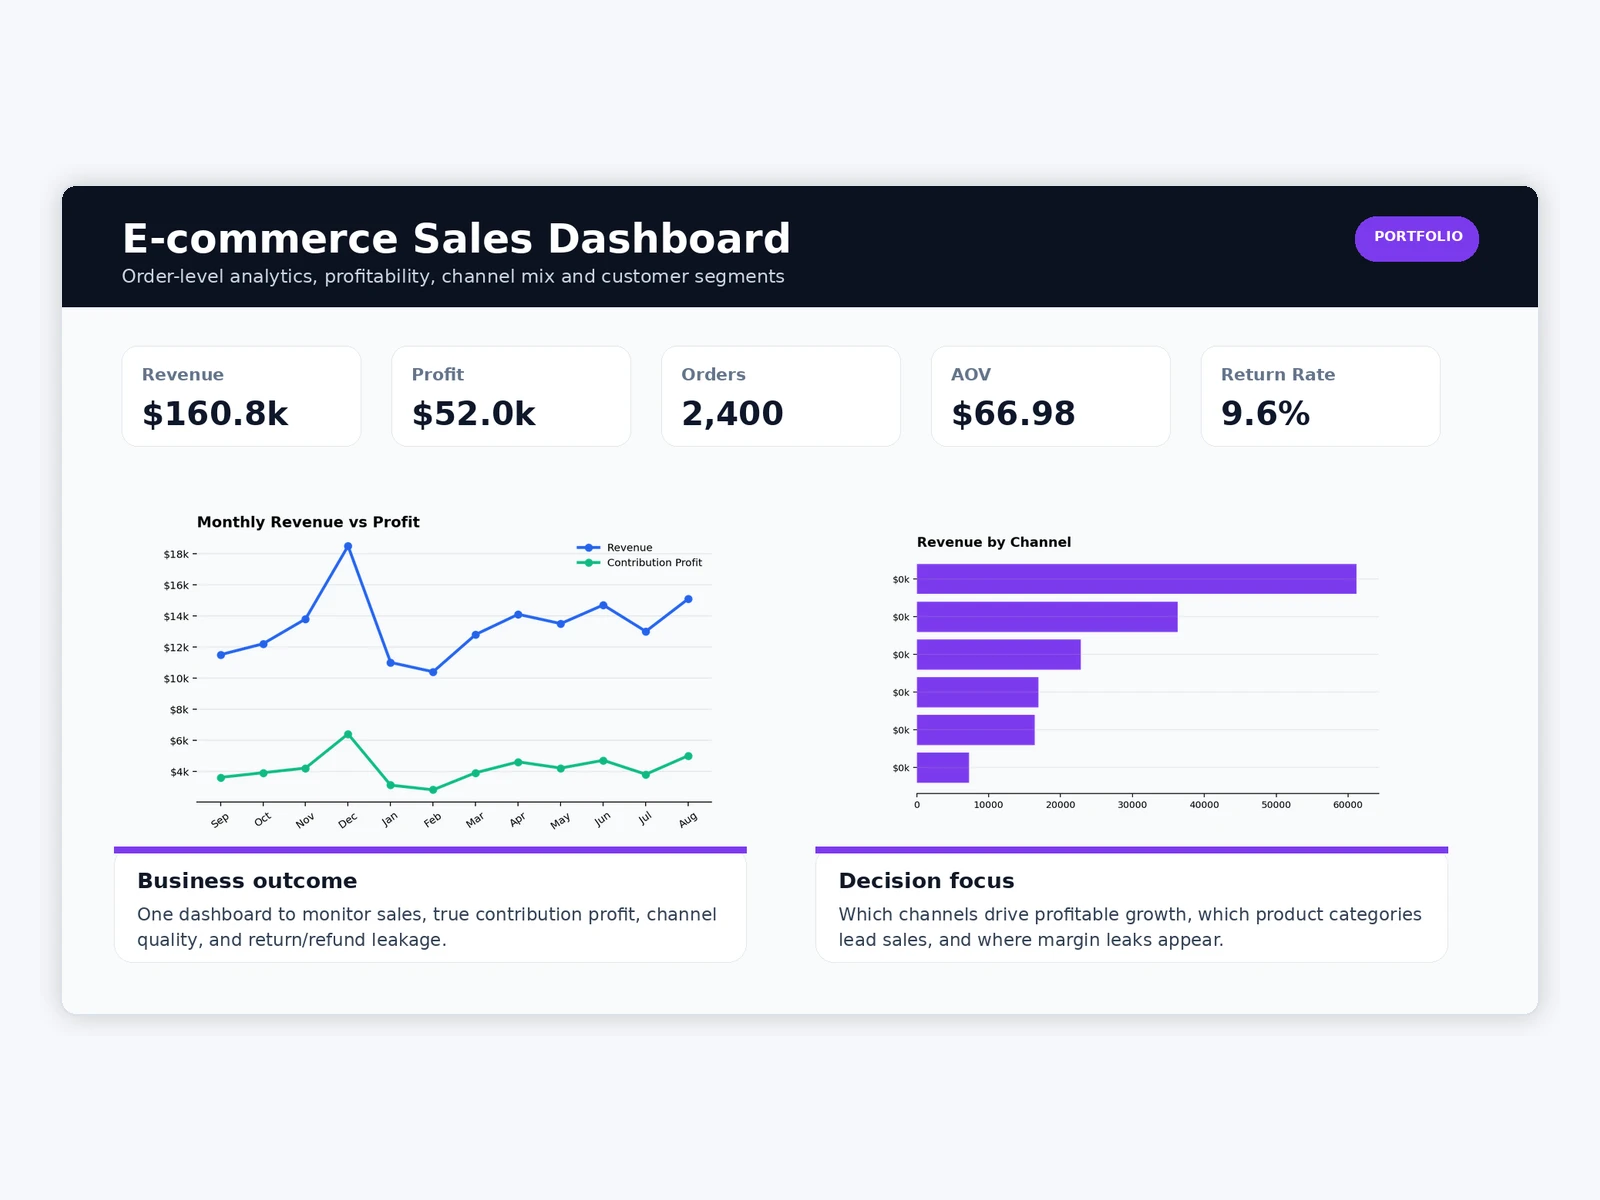
I cleaned and structured the order-level data, built profitability logic, and created an Excel dashboard that combines revenue, contribution profit, order volume, average order value, return rate, channel performance, and customer segments in one decision-ready view.
Revenue & Profit Trends
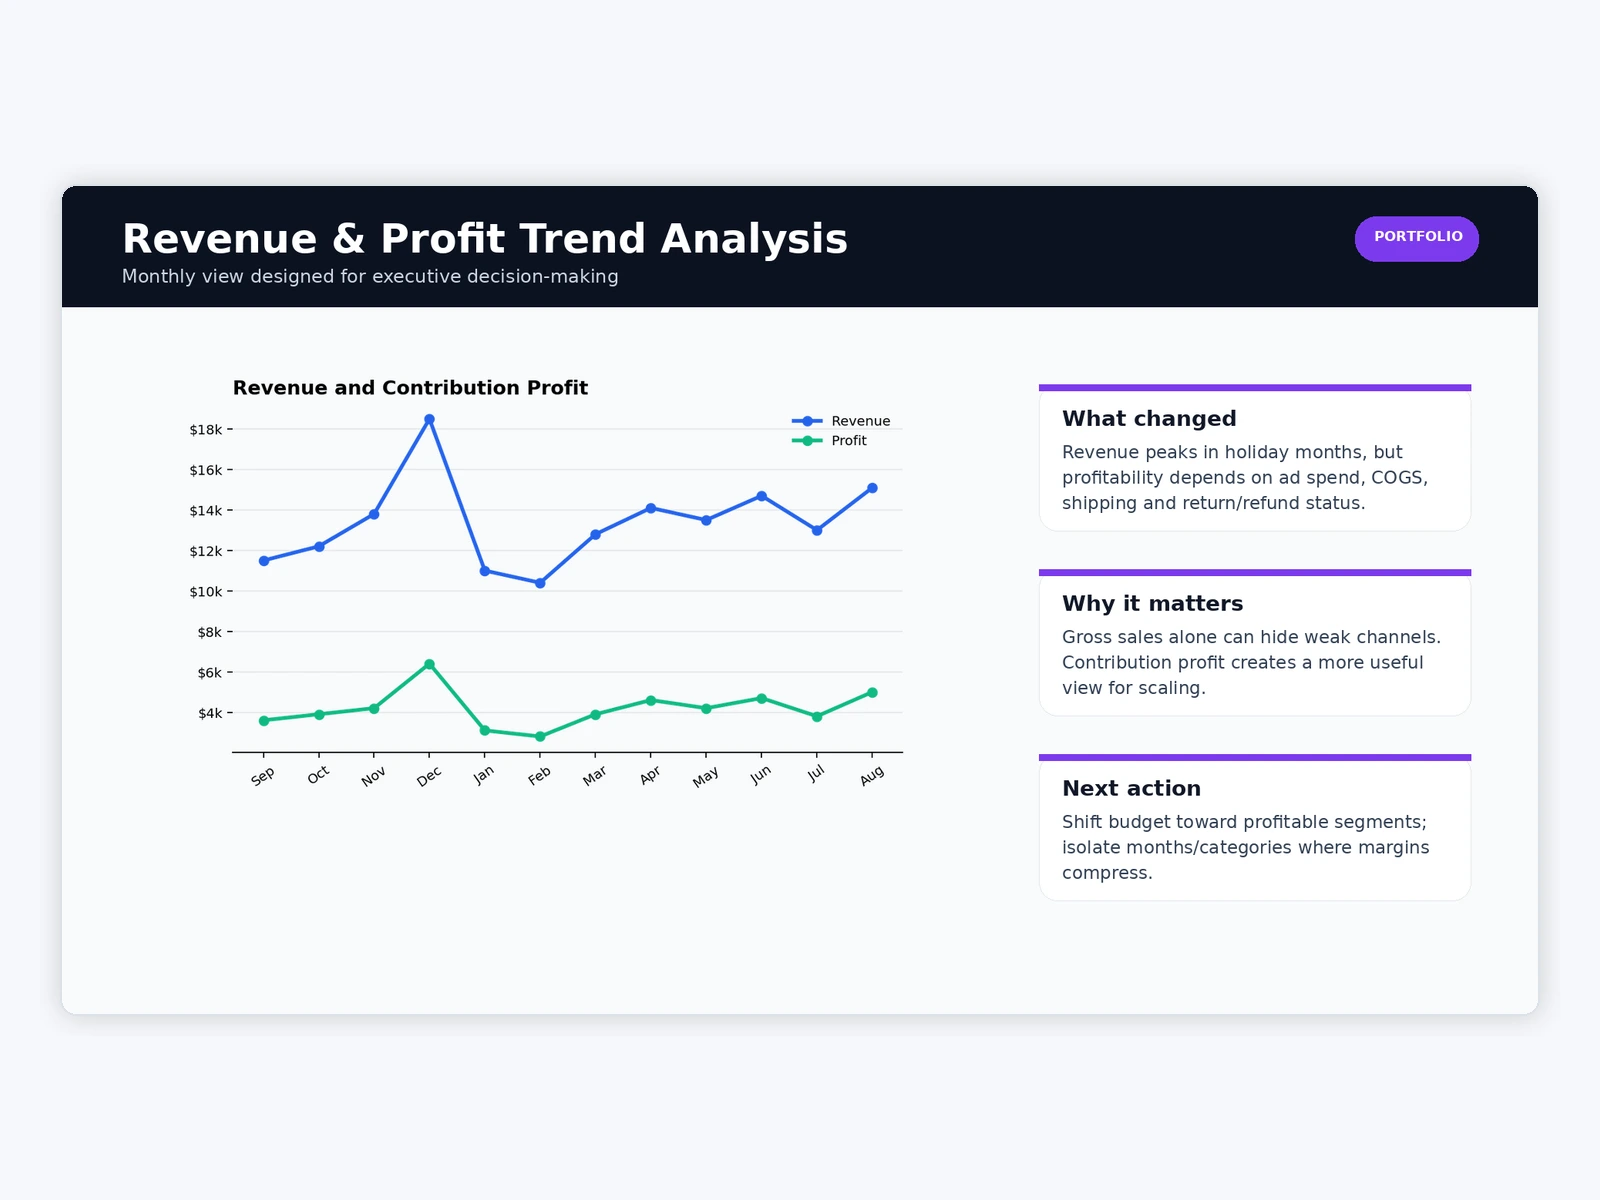
Monthly revenue is compared with contribution profit so growth can be evaluated together with actual profitability rather than sales volume alone.
Channel Economics
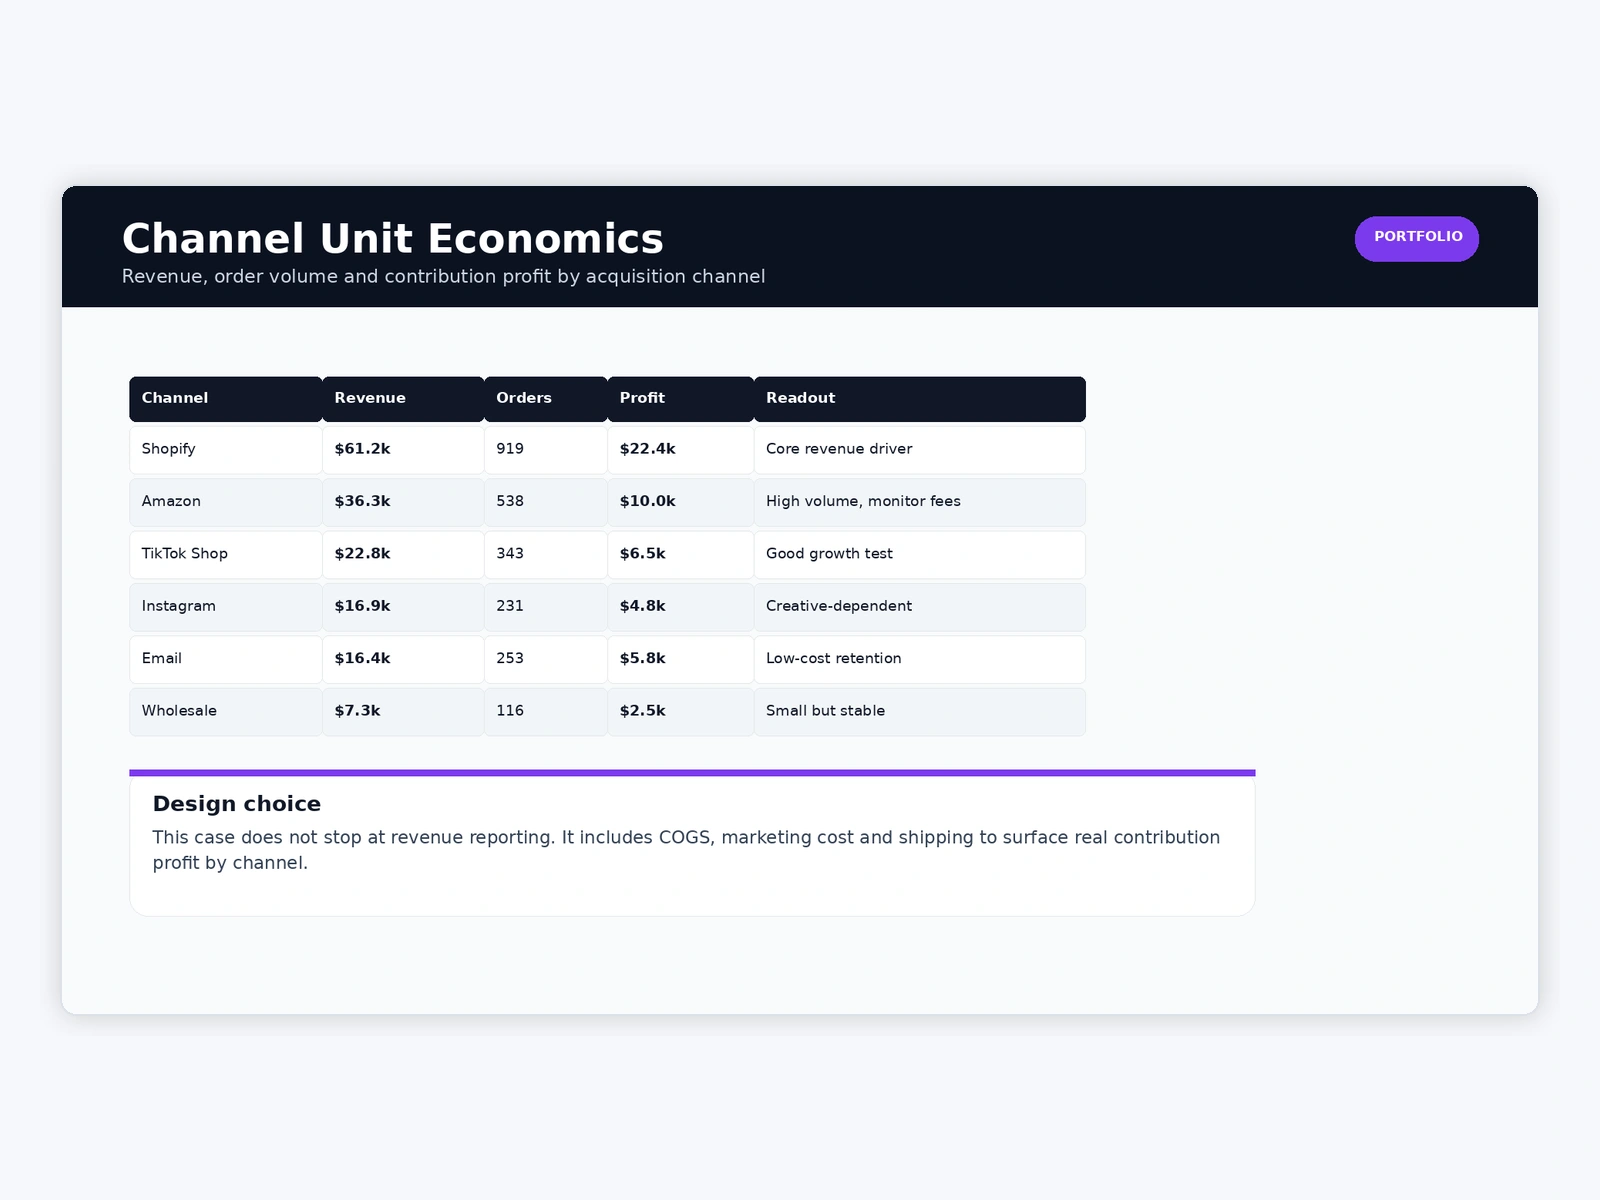
Channel-level analysis compares revenue, contribution profit, and order volume to identify which acquisition channels create sustainable growth and which ones dilute margin.
Customer Segments
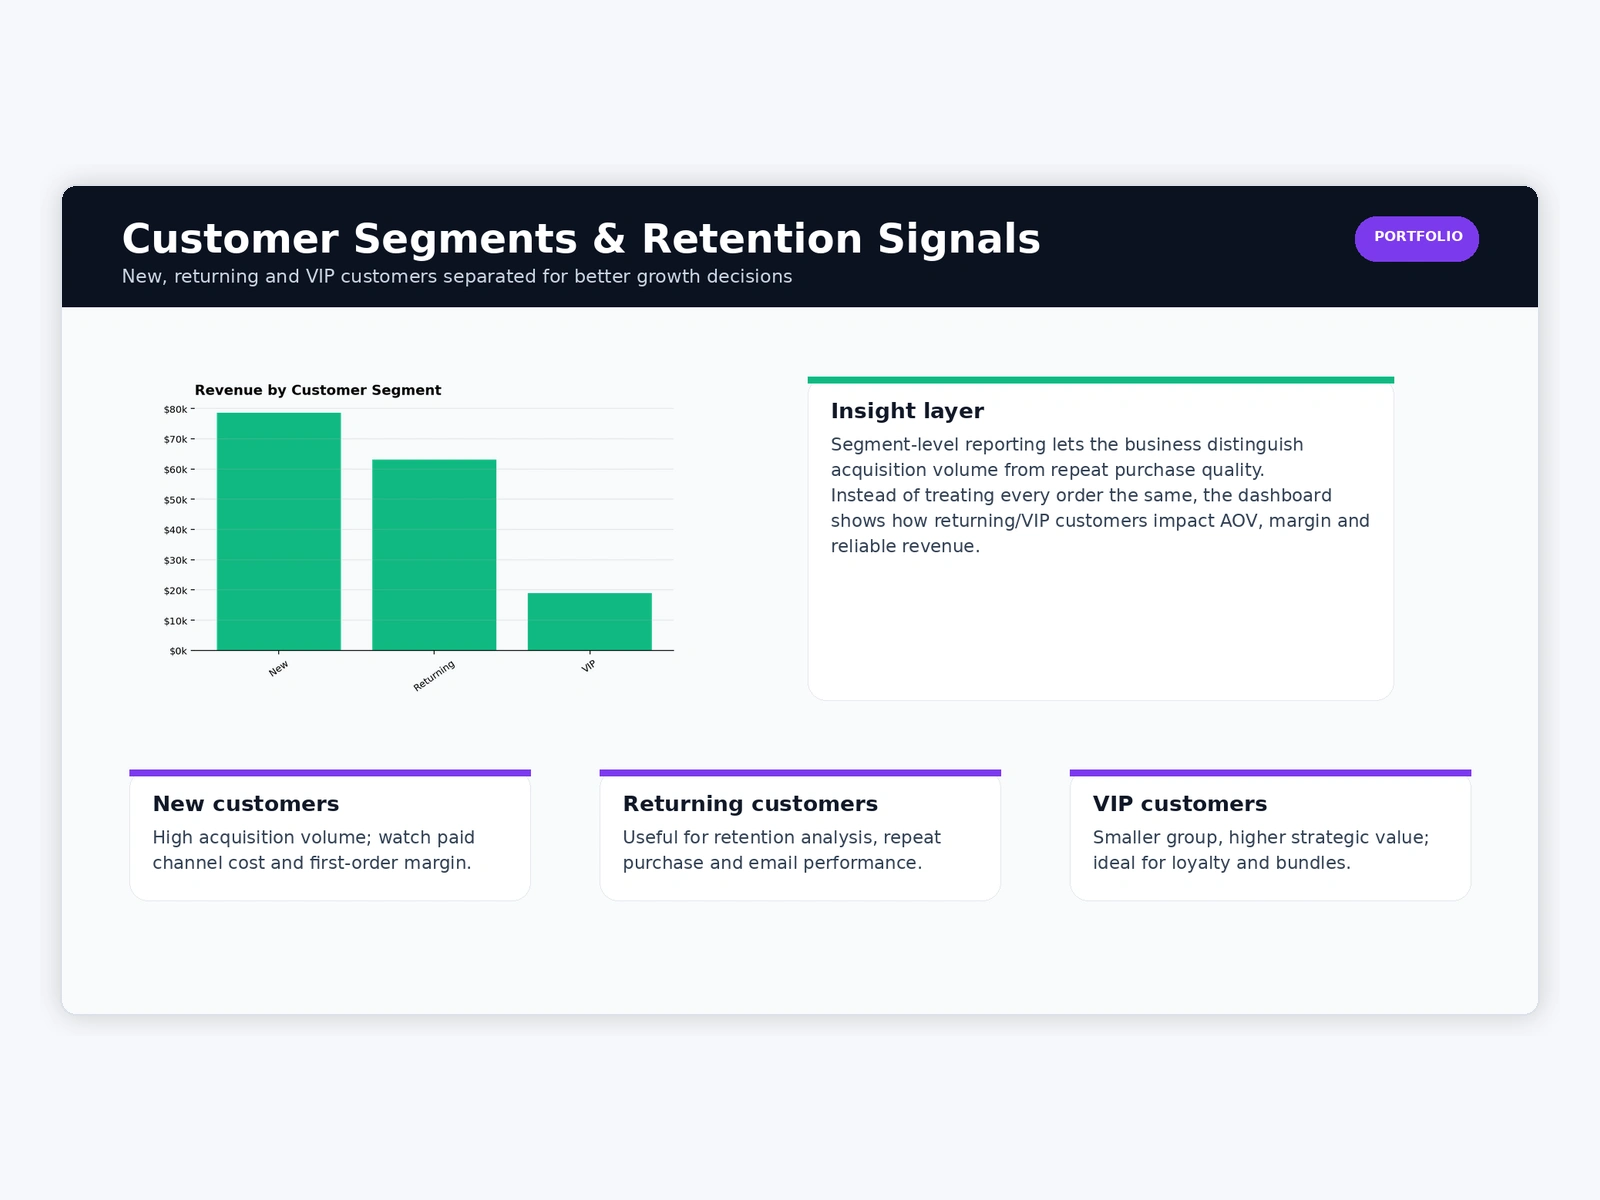
Customer segmentation separates new, returning, and VIP customers to show how acquisition, retention, and high-value buyers contribute differently to revenue and profitability.
Business Outcome
The final dashboard brings revenue, contribution profit, channel performance, returns, and customer behavior into one decision-ready view, making it easier to identify profitable growth opportunities and margin leakage.
Project Context
Independent portfolio case study built with synthetic e-commerce data to demonstrate Excel-based sales analysis, profitability modeling, customer segmentation, and dashboard design.
Like this project
Posted Sep 21, 2026
Built an Excel dashboard to analyze revenue, contribution profit, channel performance, returns, and customer segments across 2,400 orders.