Inventory Analytics & Reorder Dashboard

Timur Chanaev

The Challenge
Managing 1,250 SKUs in a flat spreadsheet made it difficult to quickly identify stockout risk, cash tied up in inventory, and purchase-order priorities. The goal was to turn raw inventory data into a clear decision-making system.
The Solution
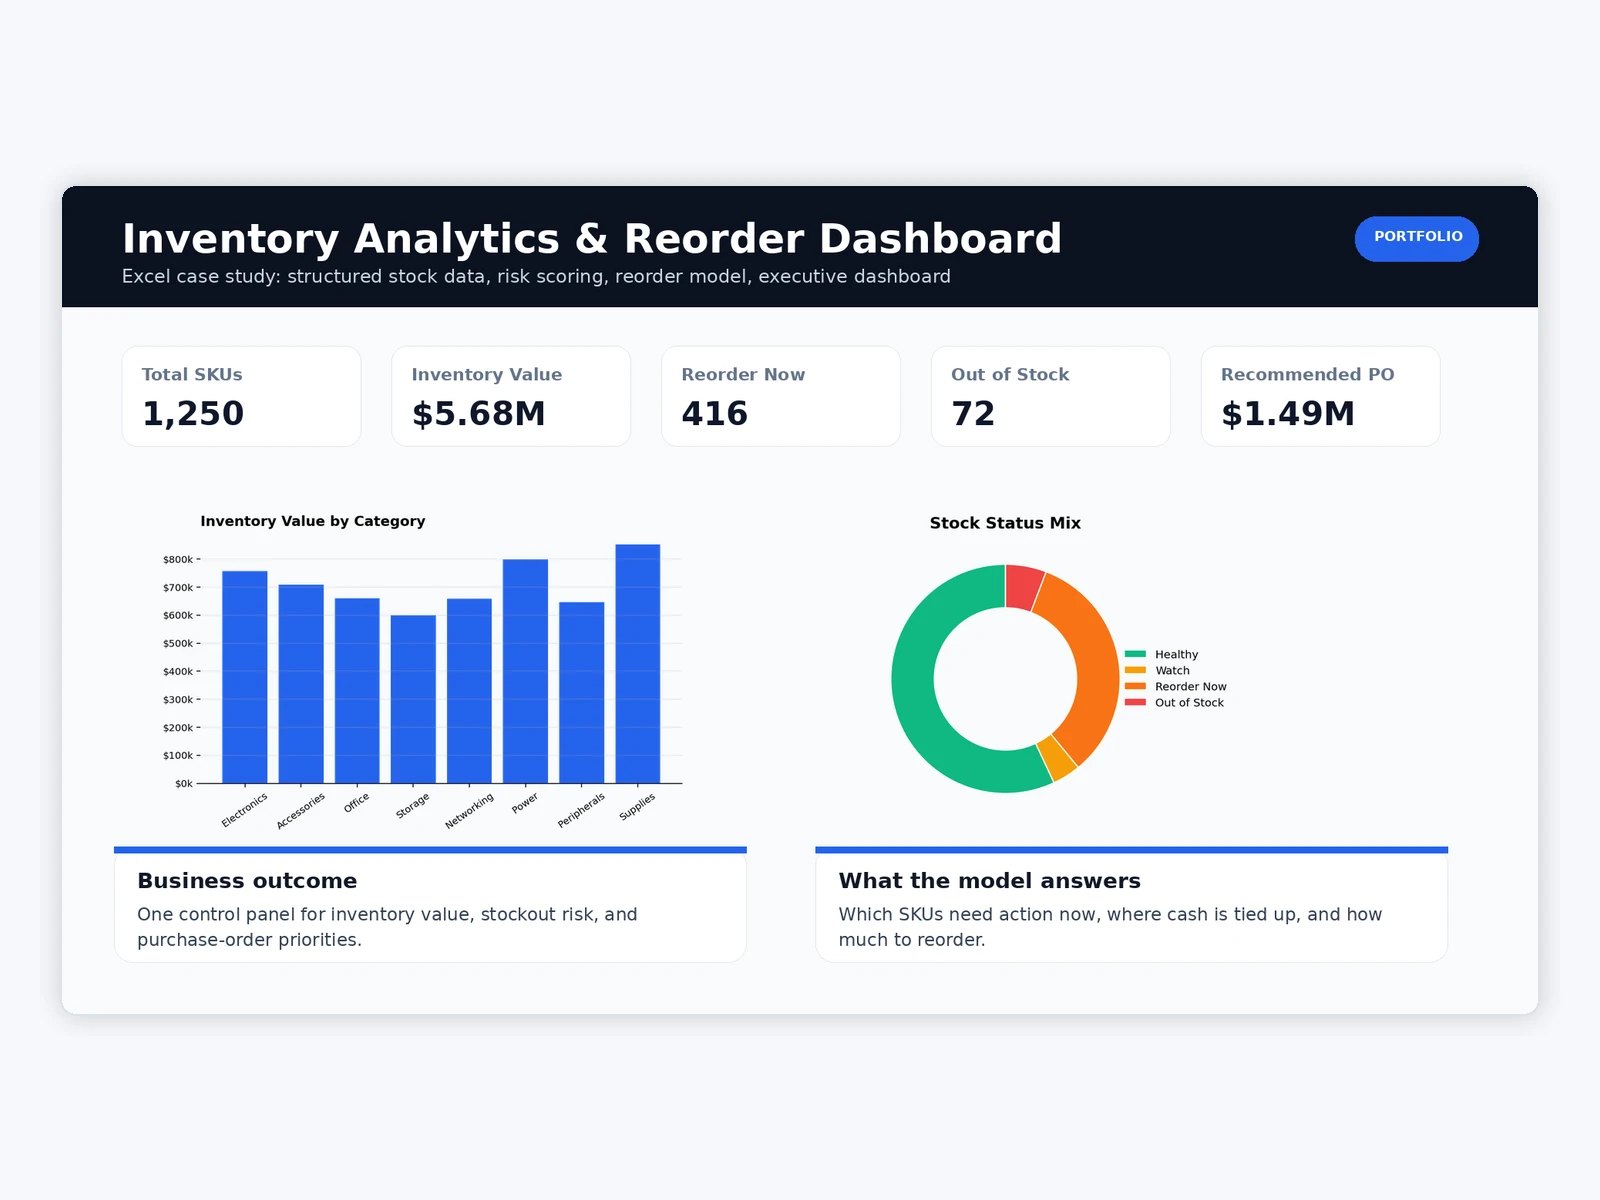
I structured the inventory data, created stock-status and reorder logic, and built an executive Excel dashboard that surfaces inventory value, reorder priorities, stockout exposure, and recommended purchase orders in one view.
Reorder Logic
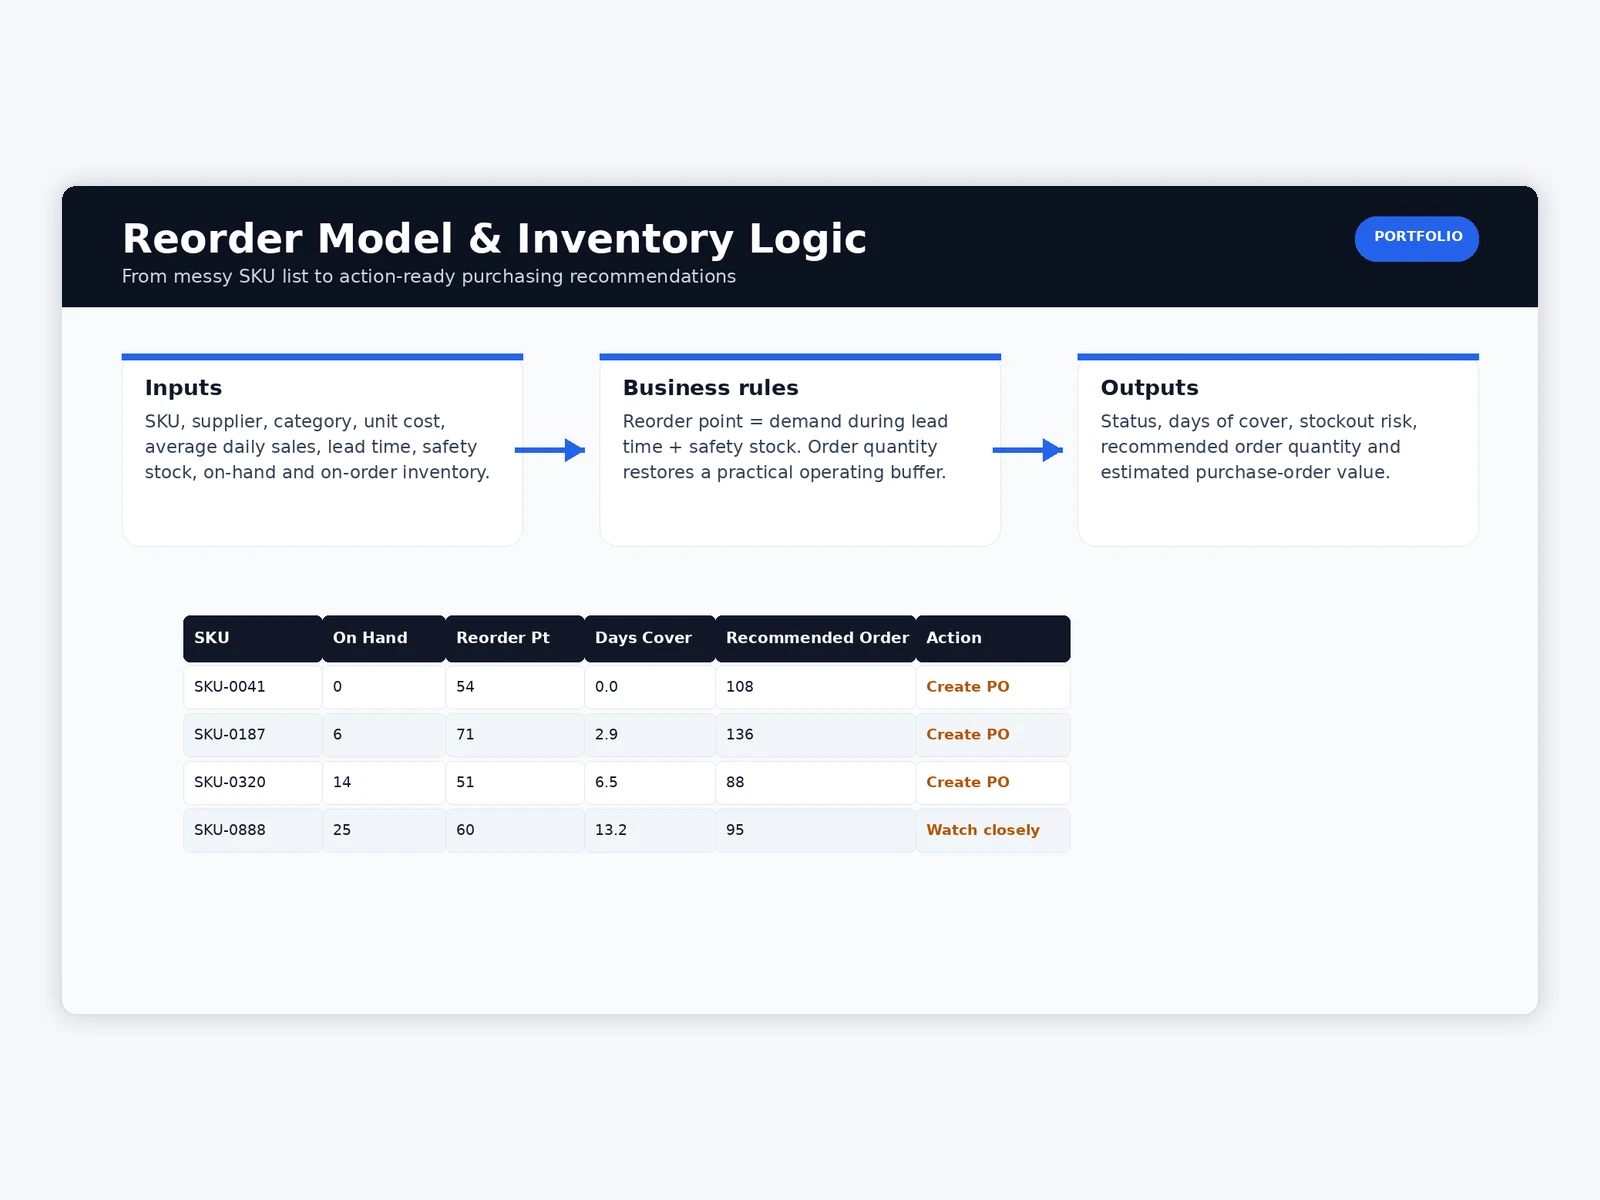
Each SKU is evaluated against current stock, reorder thresholds, and replenishment requirements. The model highlights items requiring action and calculates recommended purchase quantities to support faster purchasing decisions.
Stockout Risk
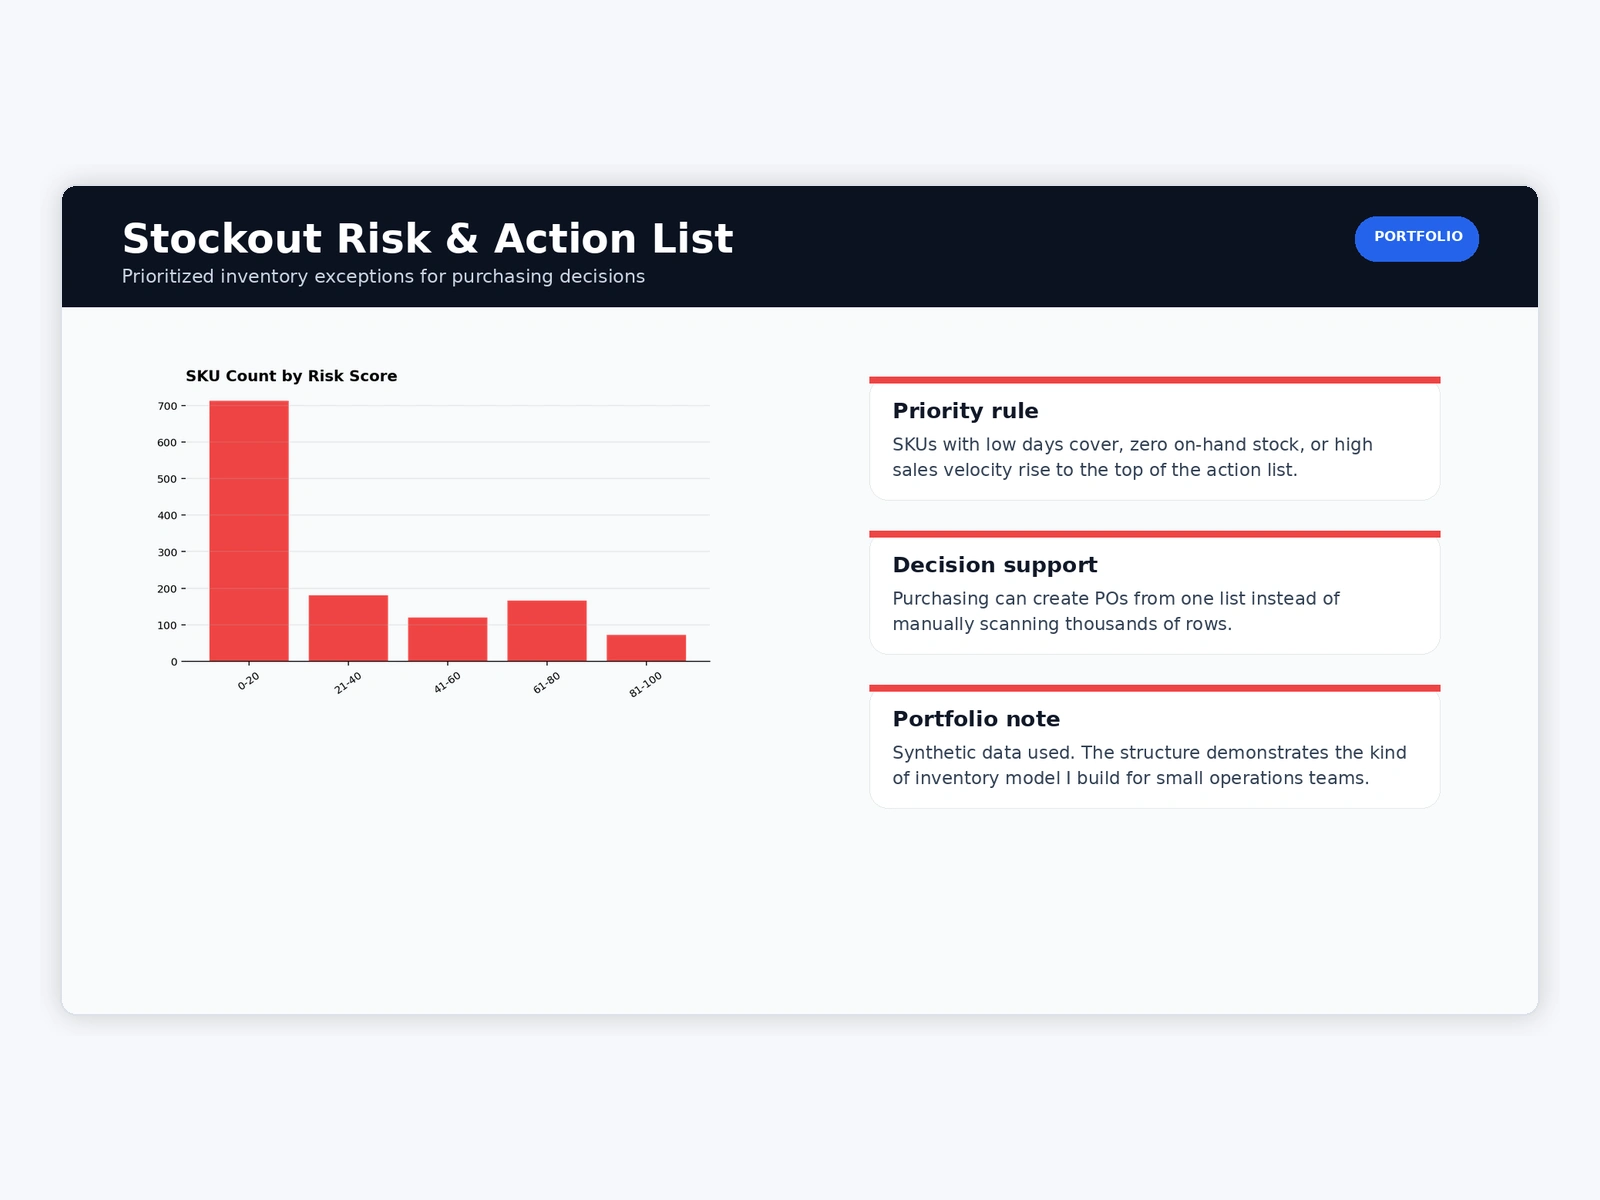
The dashboard separates healthy inventory from watch, reorder-now, and out-of-stock items so operational risk is visible immediately instead of being buried in raw rows.
From Raw Data to Decision System
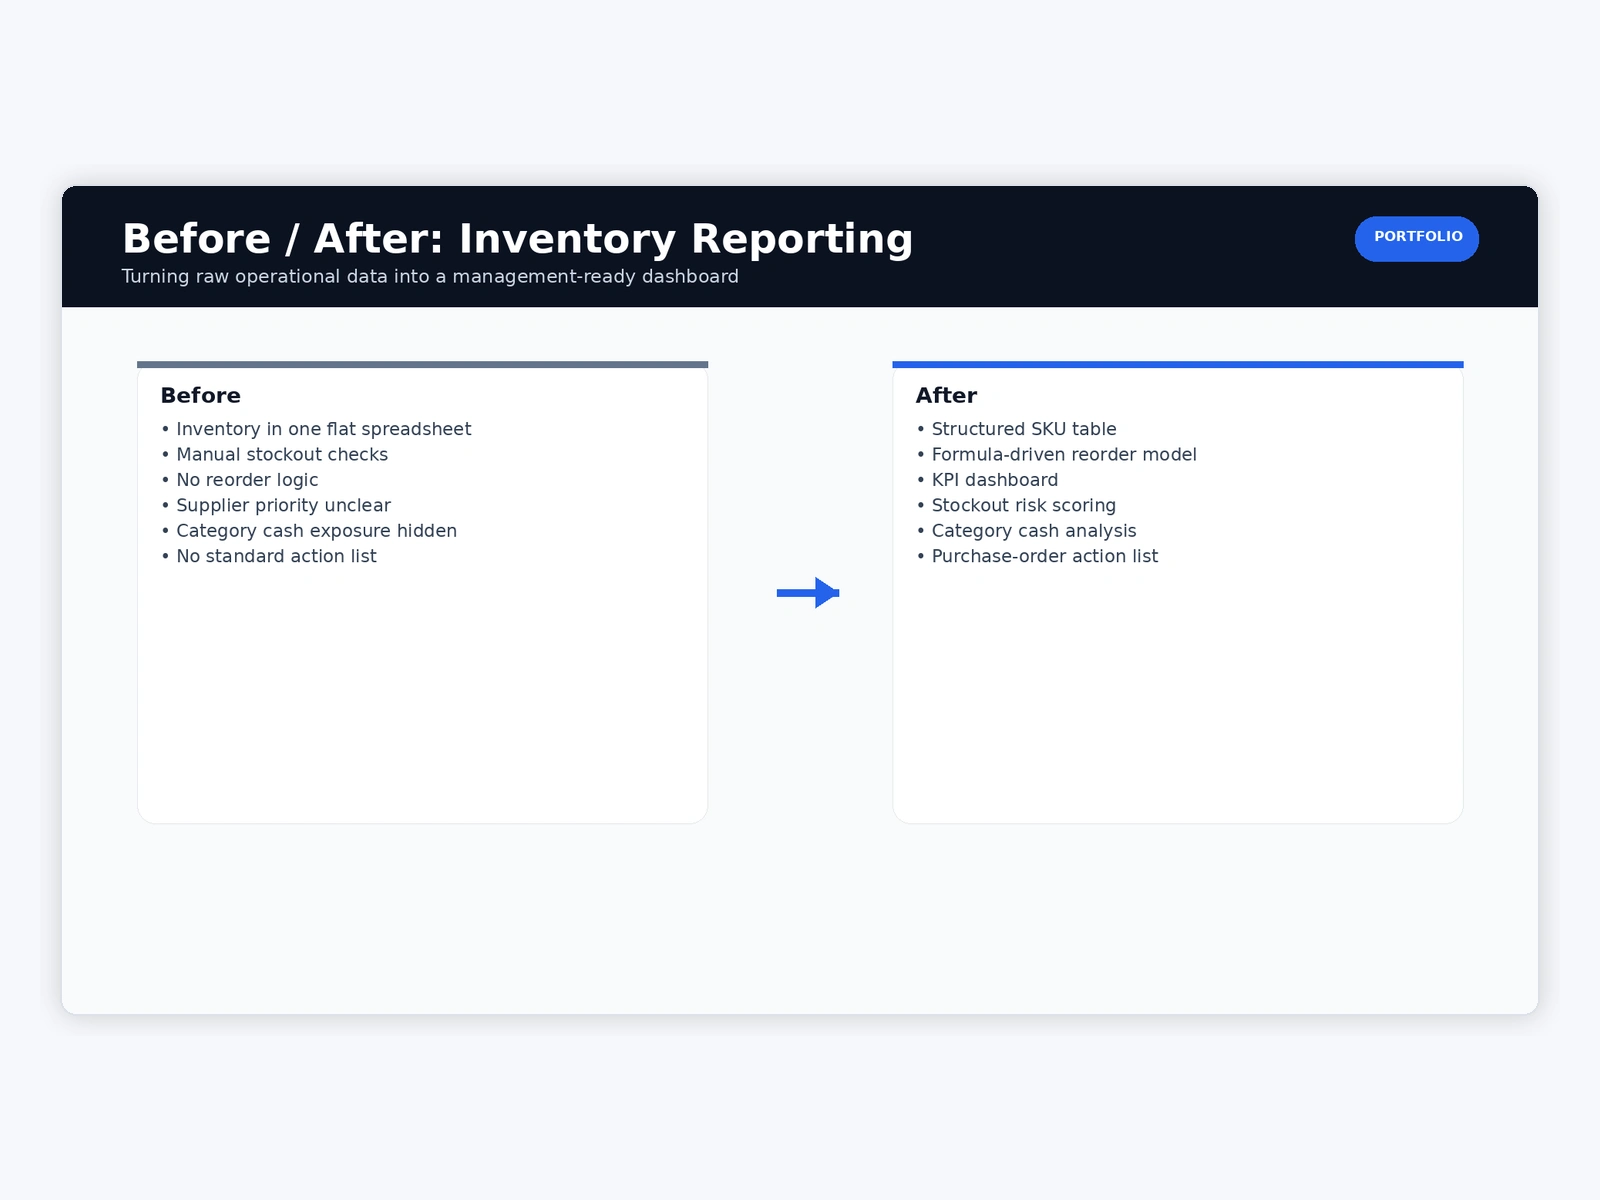
The final workbook converts a large inventory table into a compact operational view with KPIs, category-level inventory value, stock-status distribution, reorder recommendations, and recent transaction visibility.
Business Outcome
The finished workbook provides a single operational view for inventory value, stockout exposure, reorder priorities, and purchase-order planning. Instead of manually scanning thousands of rows, decision-makers can quickly identify which SKUs require action and where inventory capital is concentrated.
Project Context
Independent portfolio case study built with synthetic inventory data to demonstrate Excel-based inventory analysis, decision logic, and dashboard design.
Like this project
Posted Sep 21, 2026
Built an Excel inventory dashboard to surface stockout risk, reorder priorities, inventory value, and recommended purchase orders across 1,250 SKUs.