Ebenezer Somado - Netflix History | Information Design
Ebenezer Somado
Overview
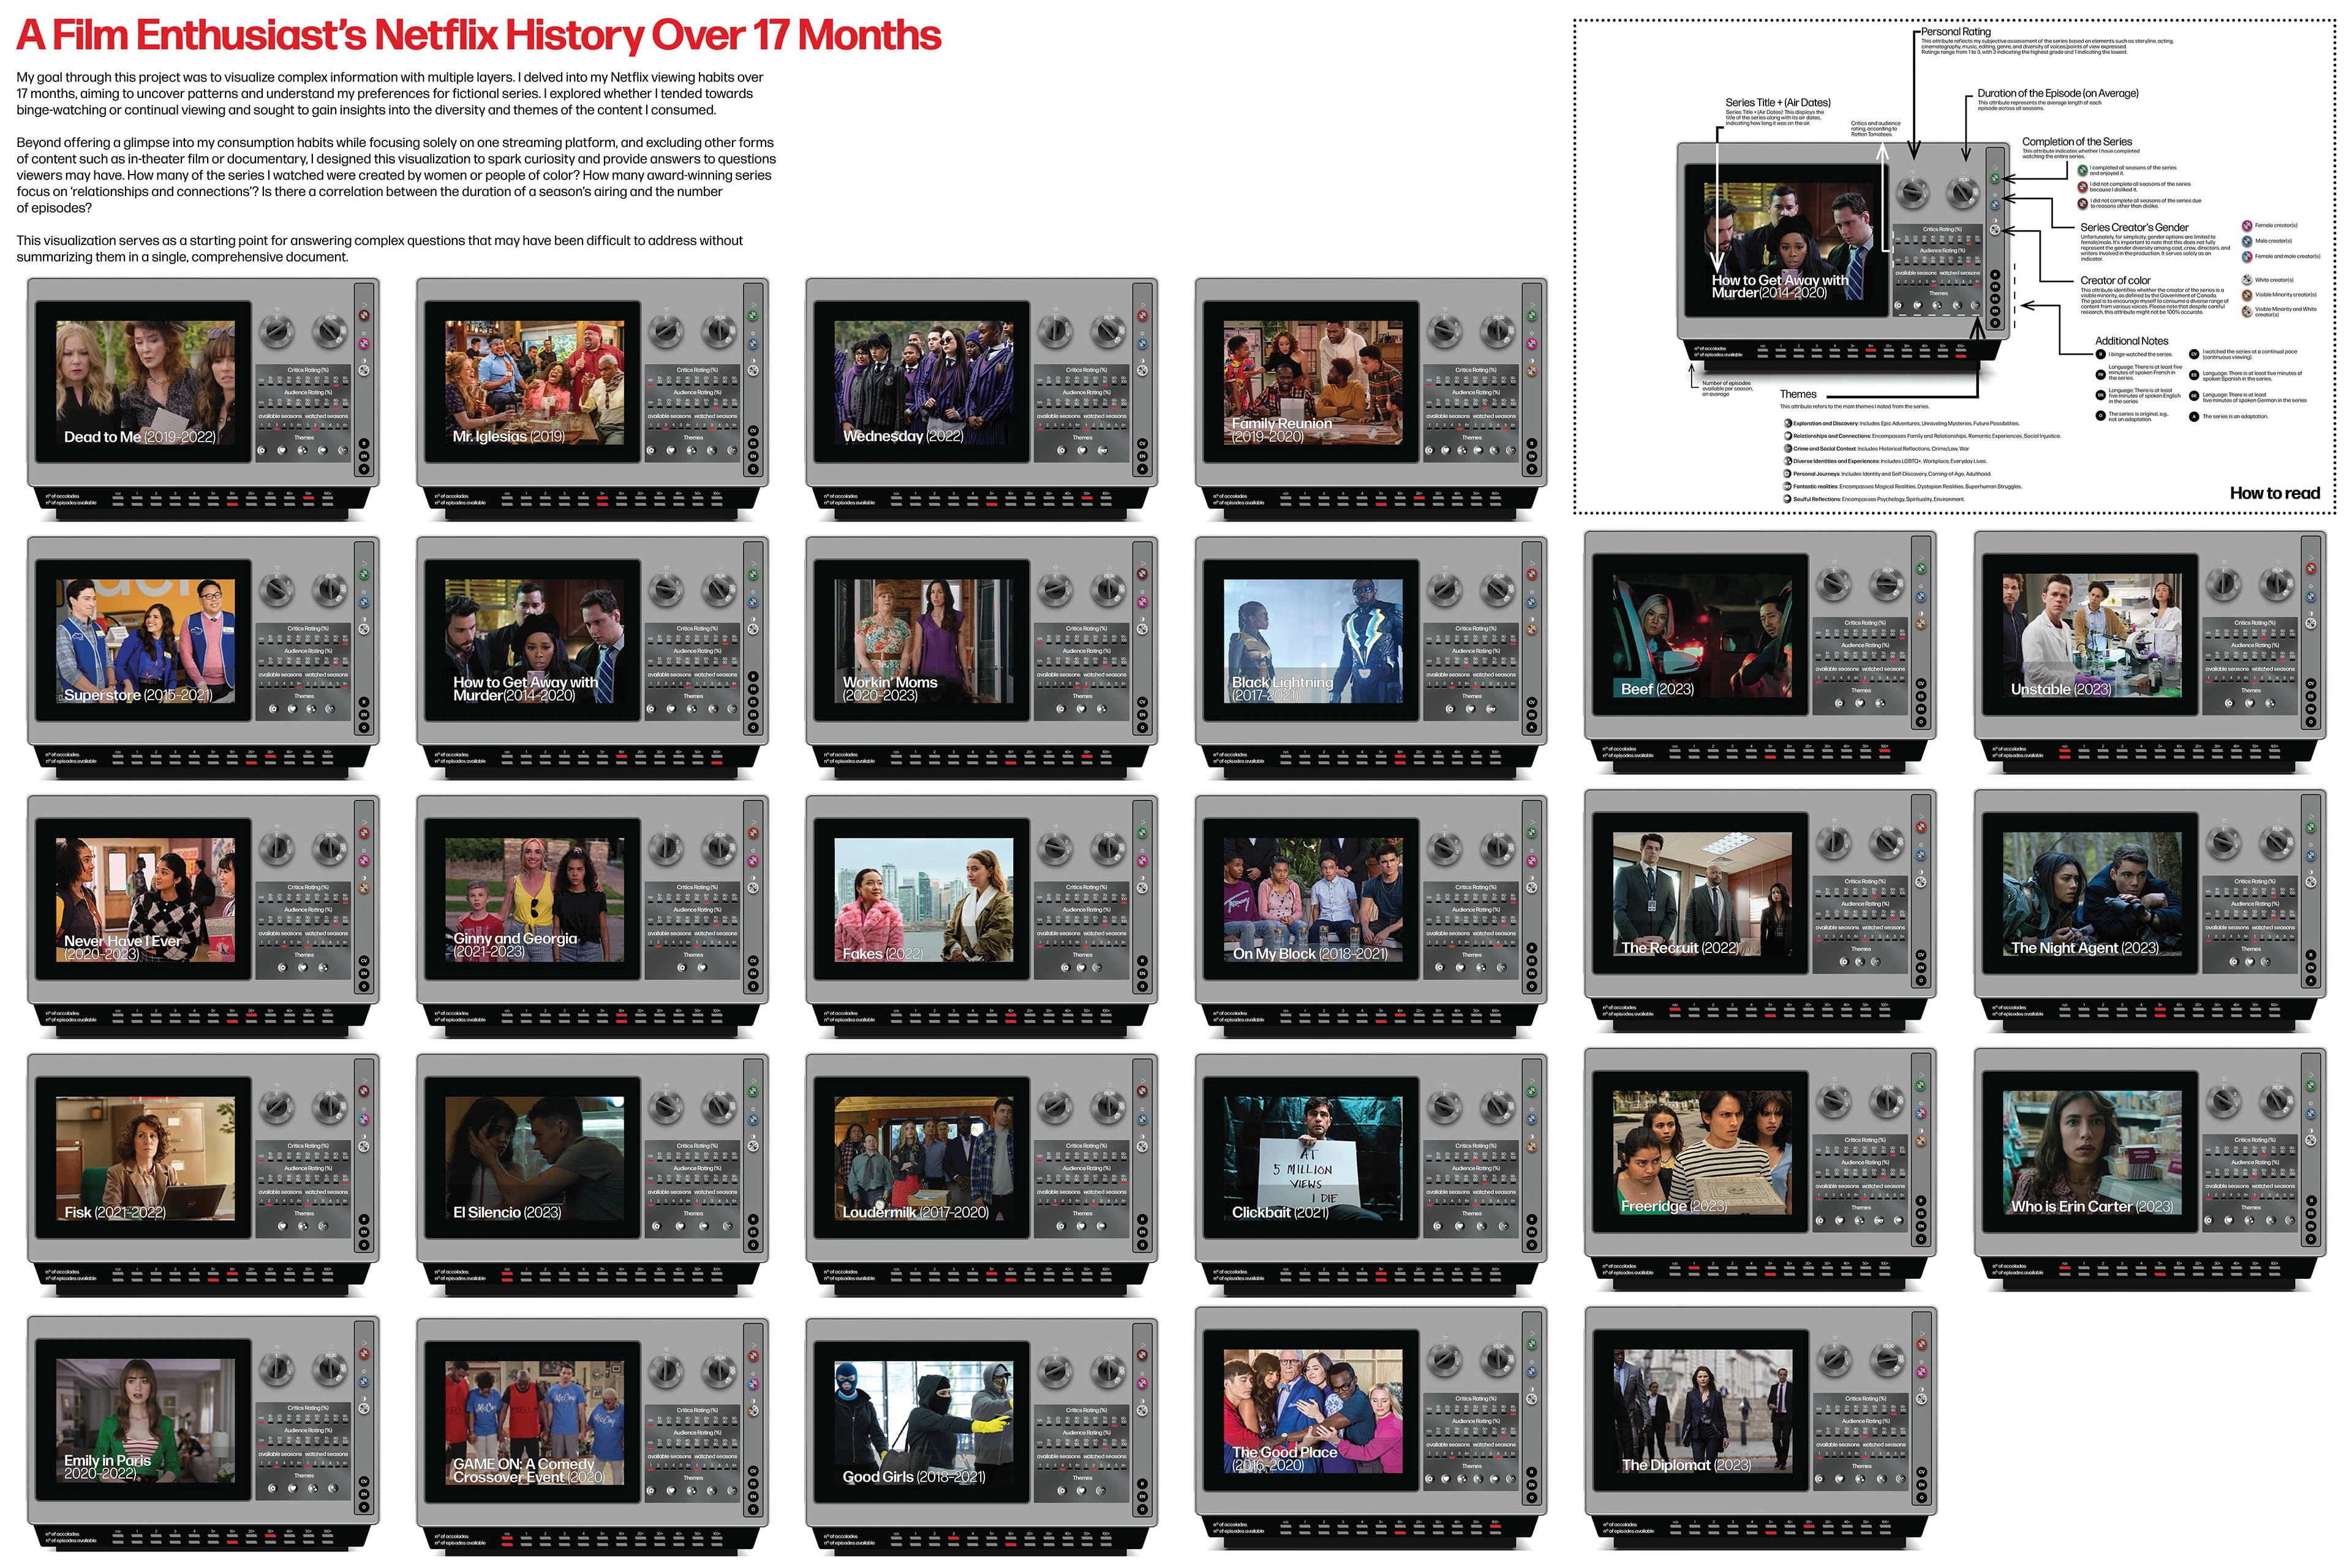
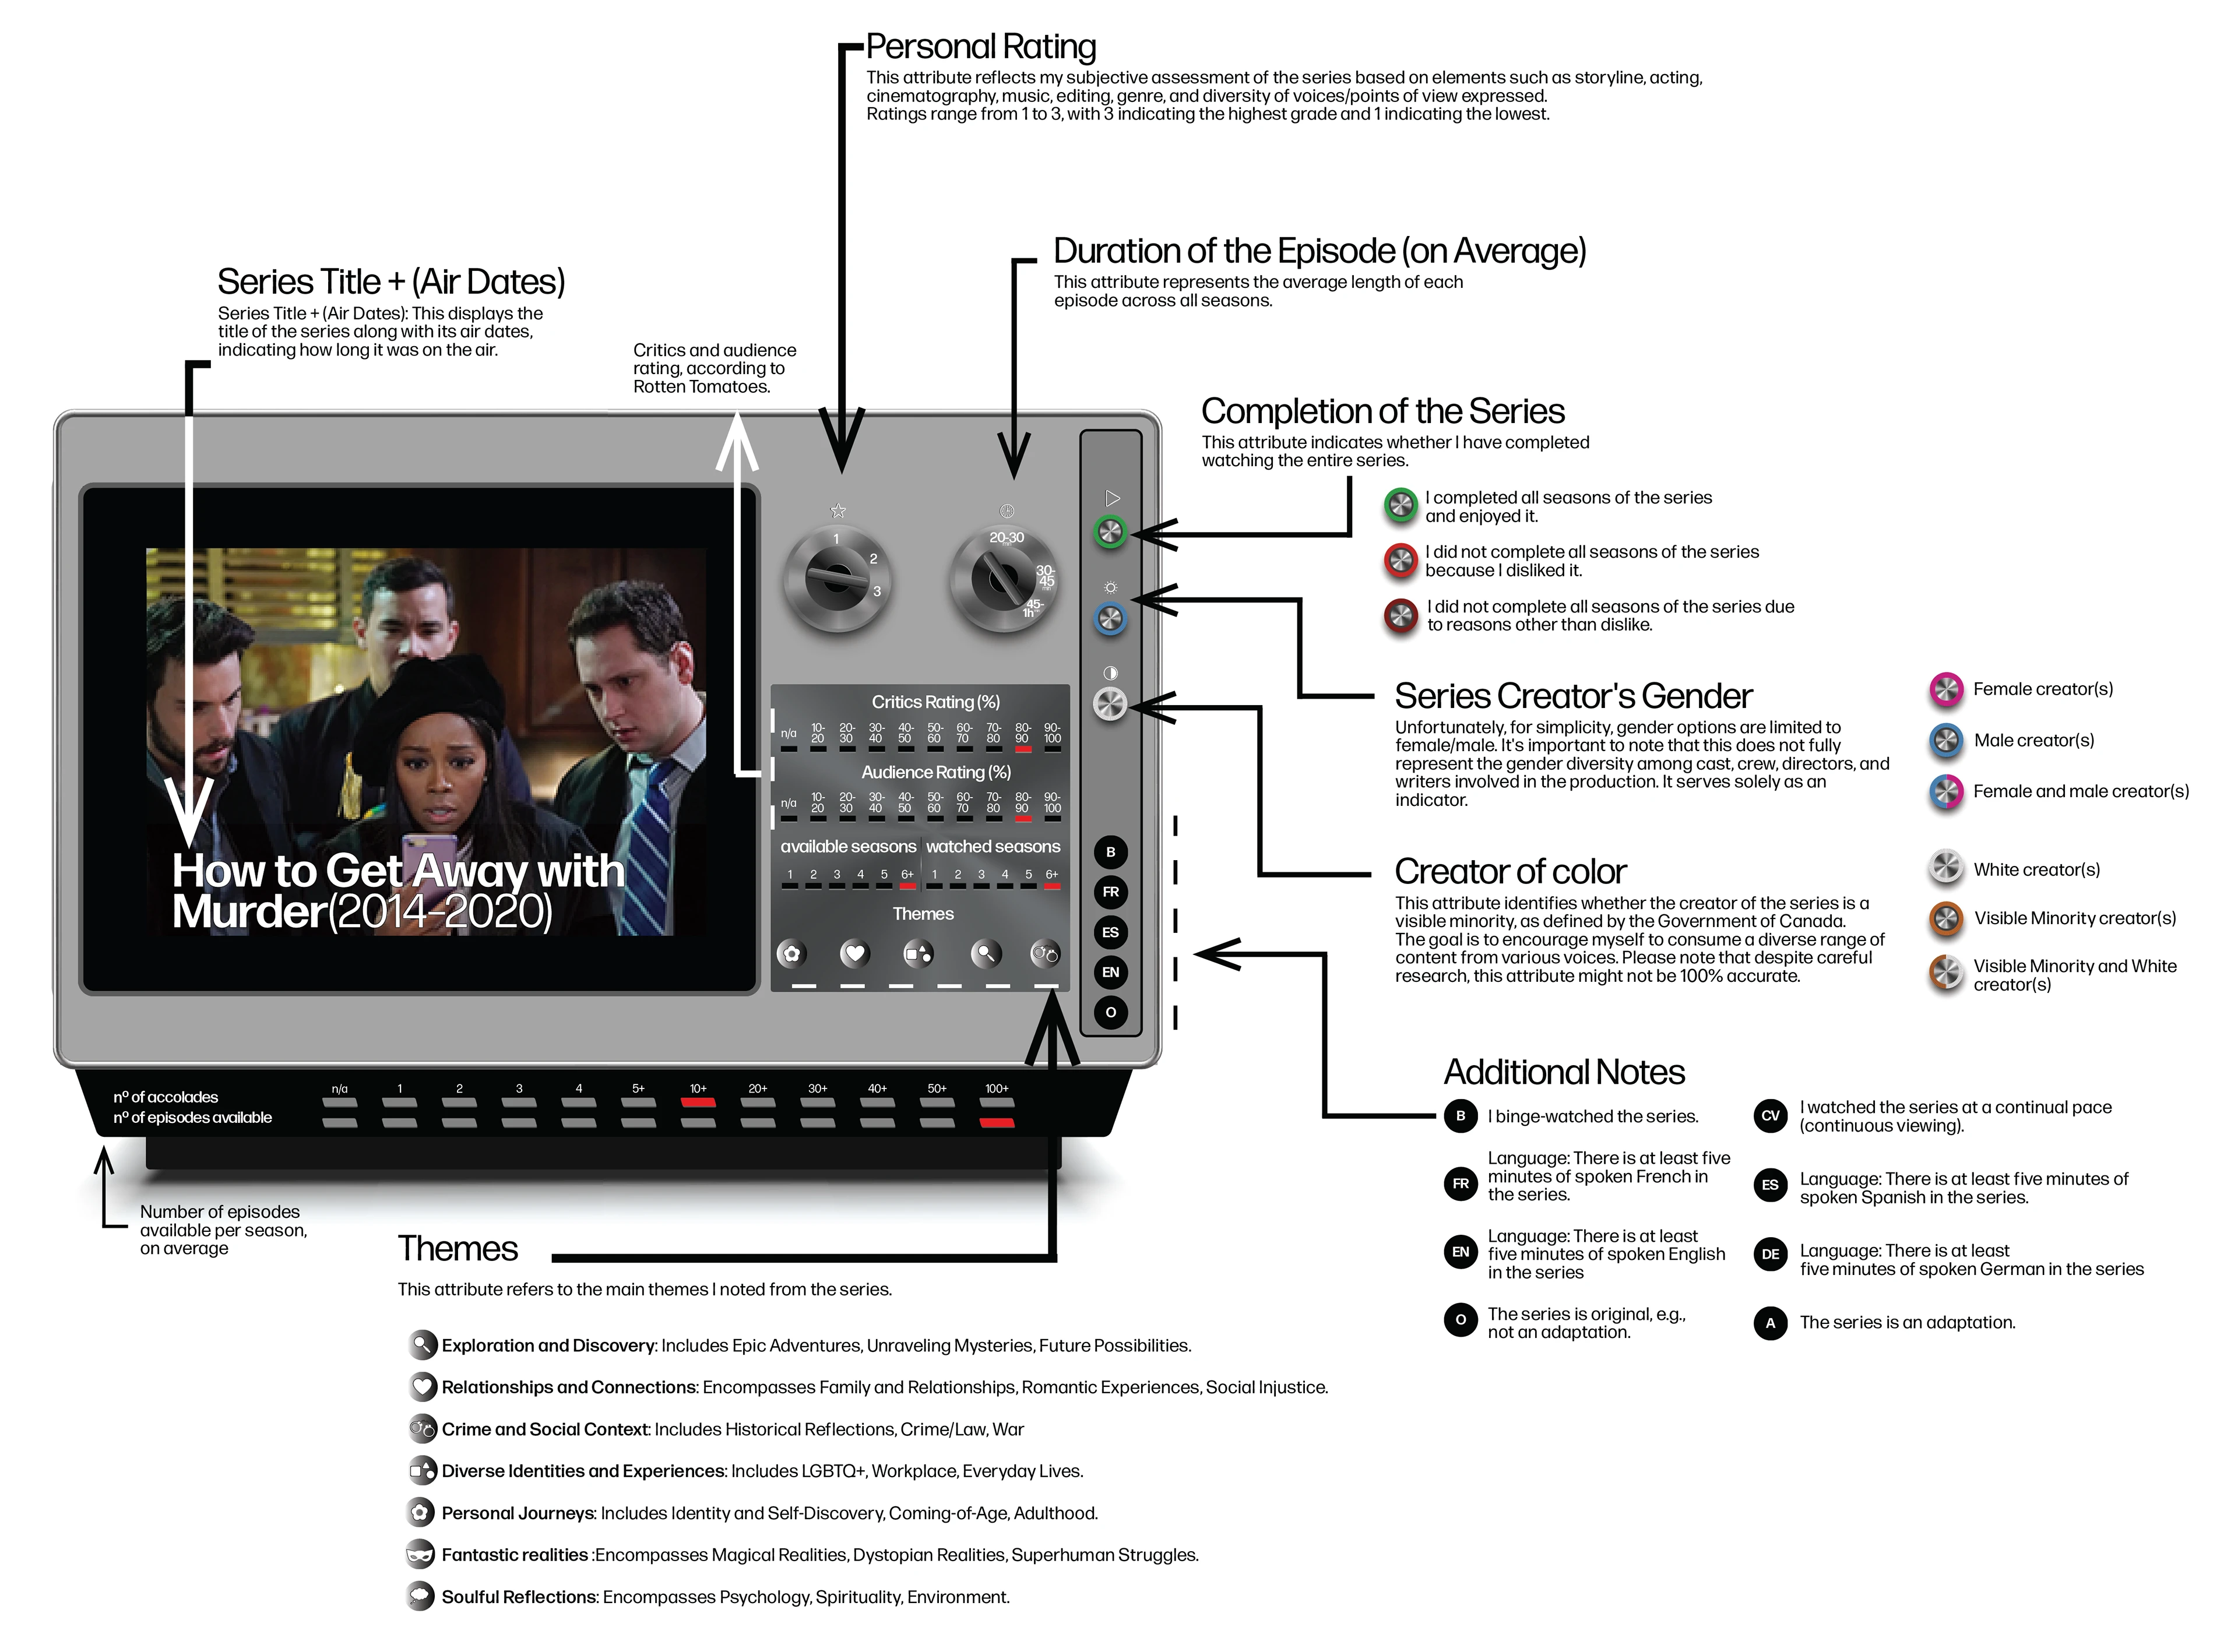
I designed a data visualization that distills complex information into clear insights. It shows my 17-month Netflix series history, condensing over 700 data points into a more accessible format.
Challenge
Craft an interesting narrative from 700+ data points of my personal Netflix series history into a comprehensible visual format, while making the visualization relevant and engaging for a broader audience than myself, was the primary challenge.
Solution
Designed a 72x48 inches poster with TV-shaped frames, condensing complex information and captivating viewers' attention.
Broadened poster’s appeal by refining the copy.
Like this project
Posted Dec 15, 2024
Designed a data visualization that distills complex information into clear insights. It shows my 17-month Netflix series history...
Likes
0
Views
11