Rainwater Harvesting Program Evaluation in Jalisco Schools
Alejandro Arce
Evaluating a Rainwater Harvesting Program across 40 Schools in Jalisco, Mexico
Monitoring & Evaluation | Data Systems | Dashboard Design | Multi-Site Project Management
Timeline: January 2025 - August 2025
Overview
This project evaluated the results and causal logic of a rainwater harvesting network installed across 40 schools in Jalisco, Mexico. The program aimed to improve water access, student attendance, strengthening hygienic practices and build water-focused ecological awareness among students and teachers. I was part of the evaluation team, where we designed the Theory of Change, built monitoring tools, structured and analyzed datasets of over 3,000 student surveys and 40 mixed long school director surveys, as well as developing a final dashboard and insights used to secure future funding and project expansion.
Context & Challenge
The implementing organization had already installed the rainwater systems successfully, implemented workshops on building skills on the schools for maintenance, and built relationships with the schools ecosystems themselves; though, they lacked an integrated, evidence-based understanding of the program's outcomes. Data was fragmented and hard to trace, indicators were misaligned, and no centralized system existed to measure results and obtain insights for long-term impact.
Key challenges:
Absence of a unified ToC and Indicator Matrix
Lack of standardized monitoring tools
Fragmented data structures across institutions
Need for a dashboard that could integrate technical, behavioral, and attitudinal data
A tight timeline as investors awaited results to decide on future funding.
The project required establishing the entire MEL structure, from assumptions to indicators to insights.
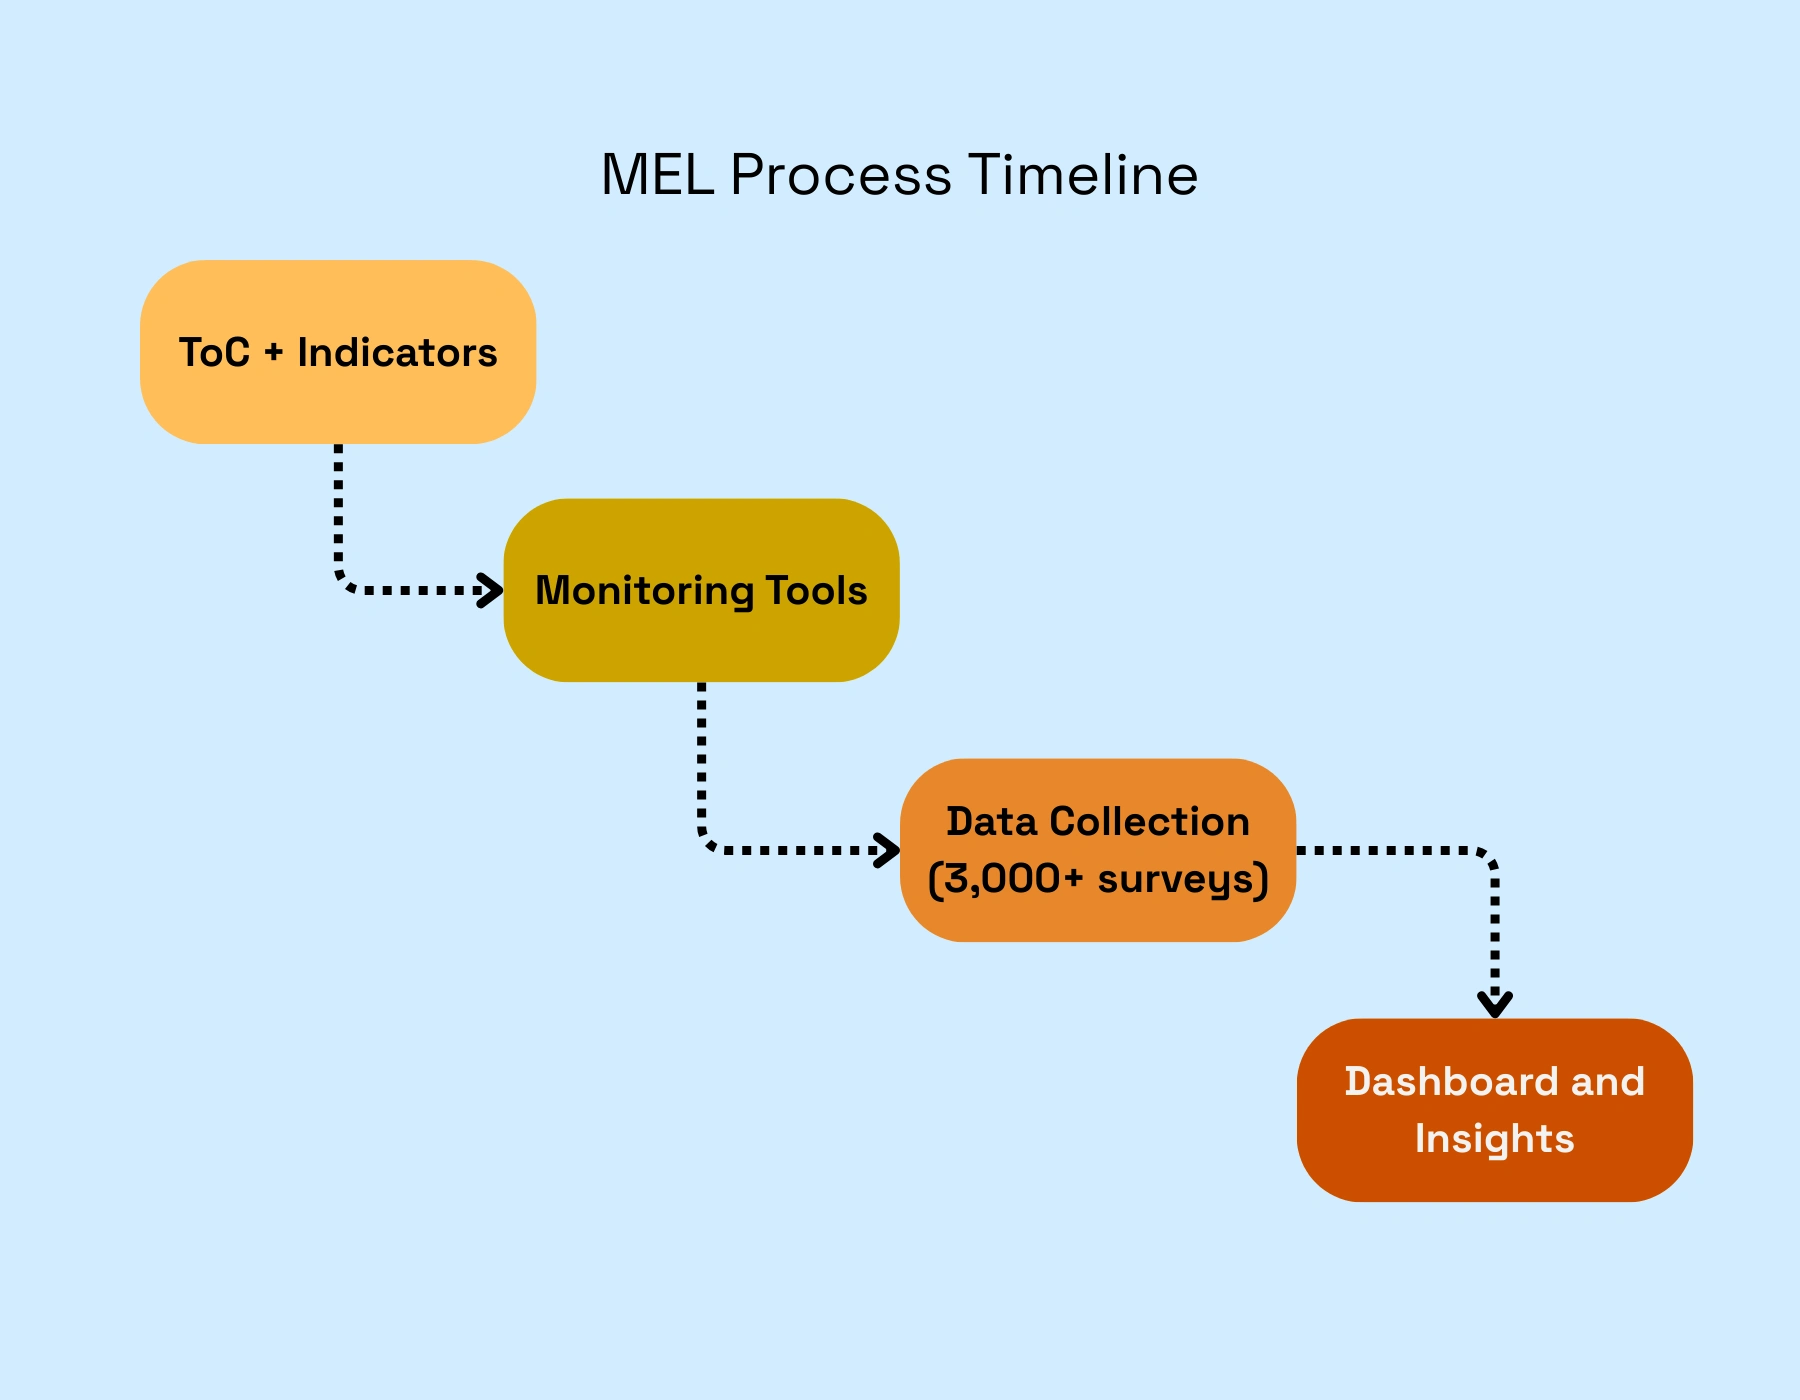
Overview of the general process that took place for this project
Objectives
Develop a robust Theory of Change and multi-level Indicator Matrix
Design monitoring tools and data collection systems for 40 schools
Structure and analyze different dataset of over 3,000 surveys from students and principals
Build an accessible Looker Studio dashboard integrating technical, behavioral, and perception data
Generate insights to inform next-phase decisions, investor presentations, and potential scaling
My Role
I worked as a data architect and analyst, as well as dashboard designer for this project, in which I:
Managed timelines and coordinated with the team for interviews, data verifications and data analysis
Designed interview guides and conducted calls with key stakeholders to understand program goals
Co-built the ToC and Indicator Matrix
Co-created monitoring tools, surveys, and methodological guidelines for data collection
Structured, cleaned and validated all incoming data from 3,000+ student surveys, 40+ mixed principal surveys and mixed national data
Conducted preliminary analysis in Excel and consolidated datasets into Sheets
Troubleshot dashboard and data calculation issues in Looker Studio
Co-designed the final dashboard and built the presentation deck for the clients
Packaged deliverables in a structured document folder for easy handover
Approach & Methodology
The evaluation followed a 4-step MEL process:
1. Theory of Change & Indicator Design
Interviews with investors, implementing teams, and consultants informed a ToC that included:
System functioning indicators (capacity, maintenance, and infrastructure type)
Behavior and hygiene indicators (handwashing practices, water usage)
Knowledge indicators (water cycle, ecosystem understanding)
Social perception indicators (water-related issues, school and community behavior)
2. Monitoring Tools & Data Collection
Created surveys, data input structures, validation rules, and analysis templates to be used across 40 schools. The implementing team collected 3,000+ surveys, later systematized through our tools.
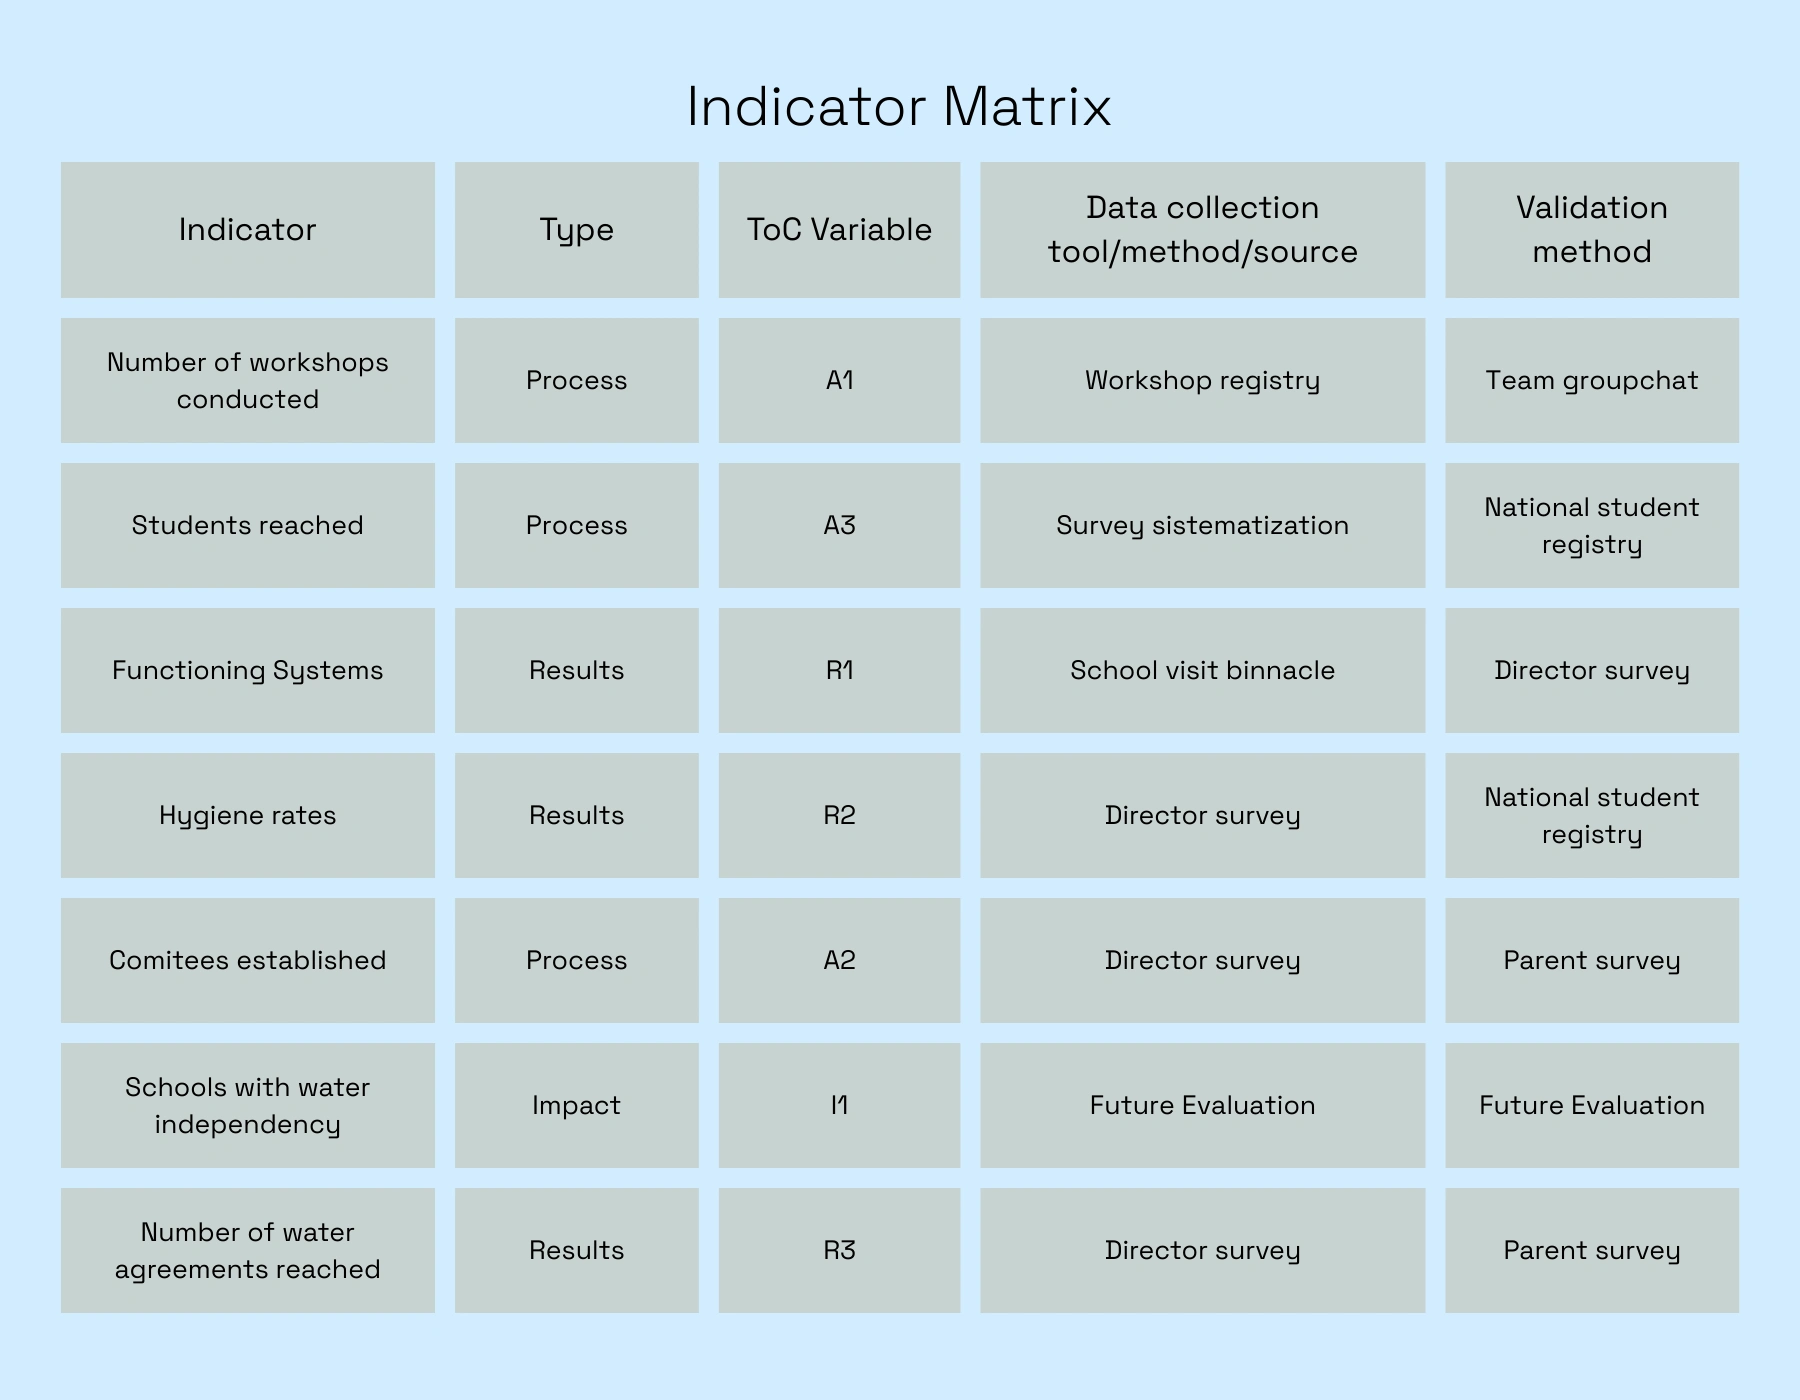
A general view of the kind of indicators developed for the project
3. Data Analysis & Insight Generation
After structuring the dataset, we extracted high-level insights, such as:
Younger students demonstrated higher awareness of their immediate water ecosystem
Older students showed deeper understanding of the social issues behind water scarcity
Rural schools tool significantly better care of water systems and water resources than urban ones
Systems were substantially more effective when paired with appropriation processes and usage routines, leading to neighboring schools replicating the model independently
4. Dashboard & Presentation
Data was consolidated into Looker Studio, creating a decision-ready dashboard for:
Principals
Program managers
Investors
Potential funders for future expansion
The dashboard included:
Technical system indicators
Behavioral and knowledge metrics
Comparisons between rural vs. urban schools
Trends by education level
Appropriation and system-care indicators
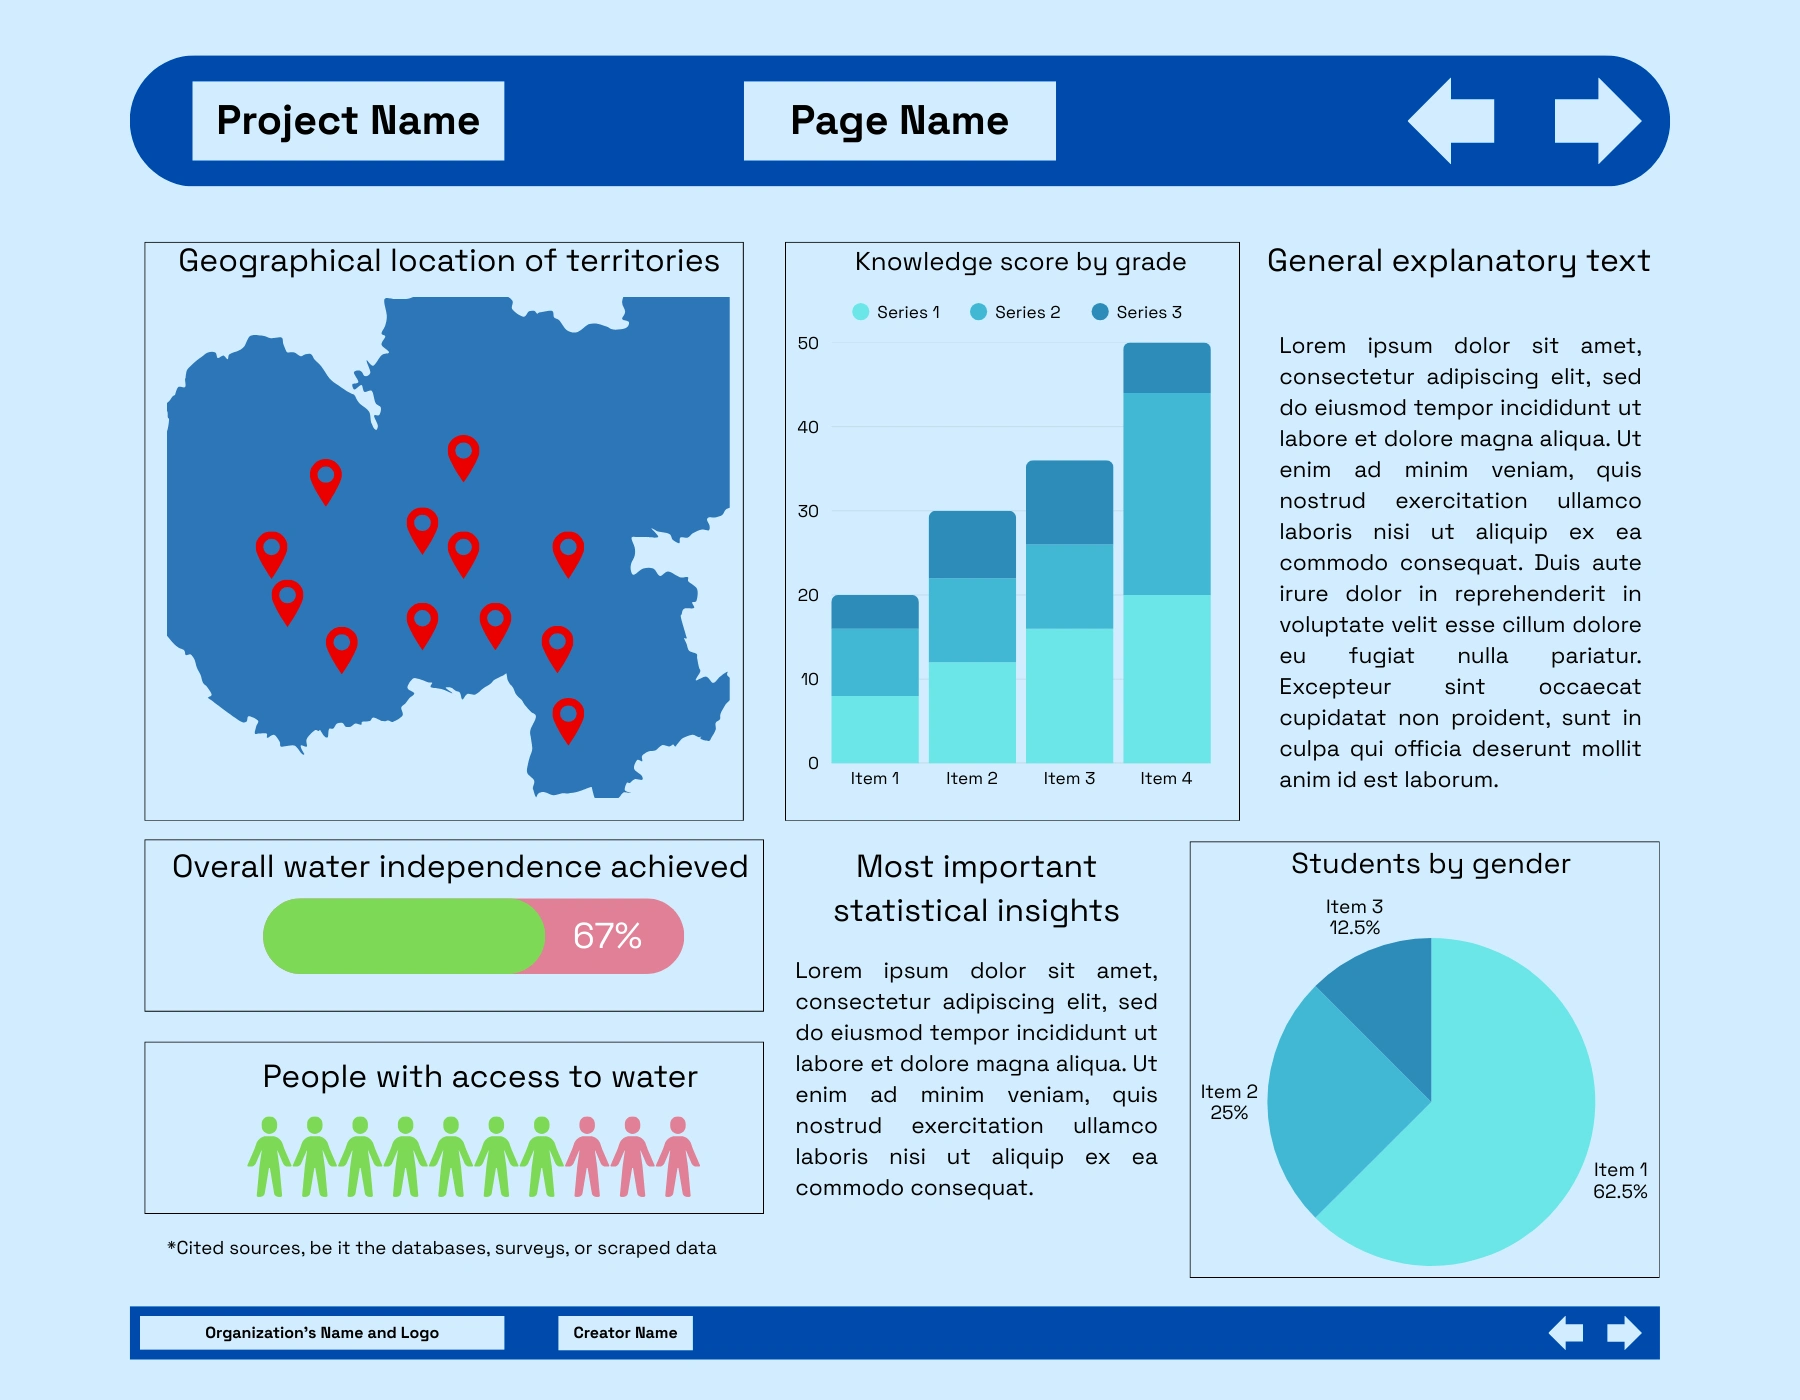
For privacy reasons, this is a mockup of one of the pages that make up the dashboard
Key Deliverables
Theory of Change document | Indicator Matrix | Monitoring toolkit | Consolidated dataset from 40 schools | Looker Studio dashboard | Final insight report | Investor presentation deck | Complete deliverables archive folder for handover
Results & Impact
The most important ones, reported by the client months after finishing the project were that the work delivered resulted in:
Securing next-year funding for the program
Led to an exploratory expansion for more schools in the region
Sparked early conversations for national-scale replication
Improved decision-making clarity for investors and implementers
Provided the first unified dataset on water harvesting across the project area
Created tools that can be used for future monitoring cycles
Skills Demonstrated
Monitoring & Evaluation (MEL) | Theory of Change | Indicator Design | Survey & Research Tools | Data Structuring | Dashboard Design | Analytical Storytelling | Multi-Stakeholder Coordination | Project Management | Problem-Solving
Like this project
Posted Nov 24, 2025
Evaluated rainwater harvesting program across 40 schools in Jalisco, Mexico, designing MEL structures and dashboards.
Likes
0
Views
7
Timeline
Feb 5, 2025 - Aug 30, 2025