Patient Appointment Dashboard for Eye Care Clinic
Geethasree Naguboina
Eye Care Clinic — Patient Appointment Dashboard
Tools Used: Microsoft Excel
Type: Sample Dashboard — Built on Client Request
Industry: Healthcare — Eye Care
1. Overview
A specialist eye care clinic reached out requesting a sample Excel dashboard to understand how their patient and billing data could be organized and visualized. This dashboard was built as a sample project on the client's request to demonstrate how raw clinic data can be transformed into a clear, actionable one-page view — covering appointments, revenue, payment status and doctor-wise performance.
2. Problem
The clinic had no centralized system to track patient appointments, monitor revenue or identify pending payments at a glance. All data was managed manually, making it difficult to get a quick picture of daily or monthly clinic performance.
Key challenges:
No visibility into appointment volumes by type
No quick summary of revenue collected vs pending
No way to compare doctor-wise appointment load
Manual tracking led to reporting delays and errors
3. What I Did
Using Microsoft Excel, I designed and built a clean single-page dashboard from scratch:
Created a structured data sheet with 25 patient records covering appointment type, doctor, status, fee and payment status
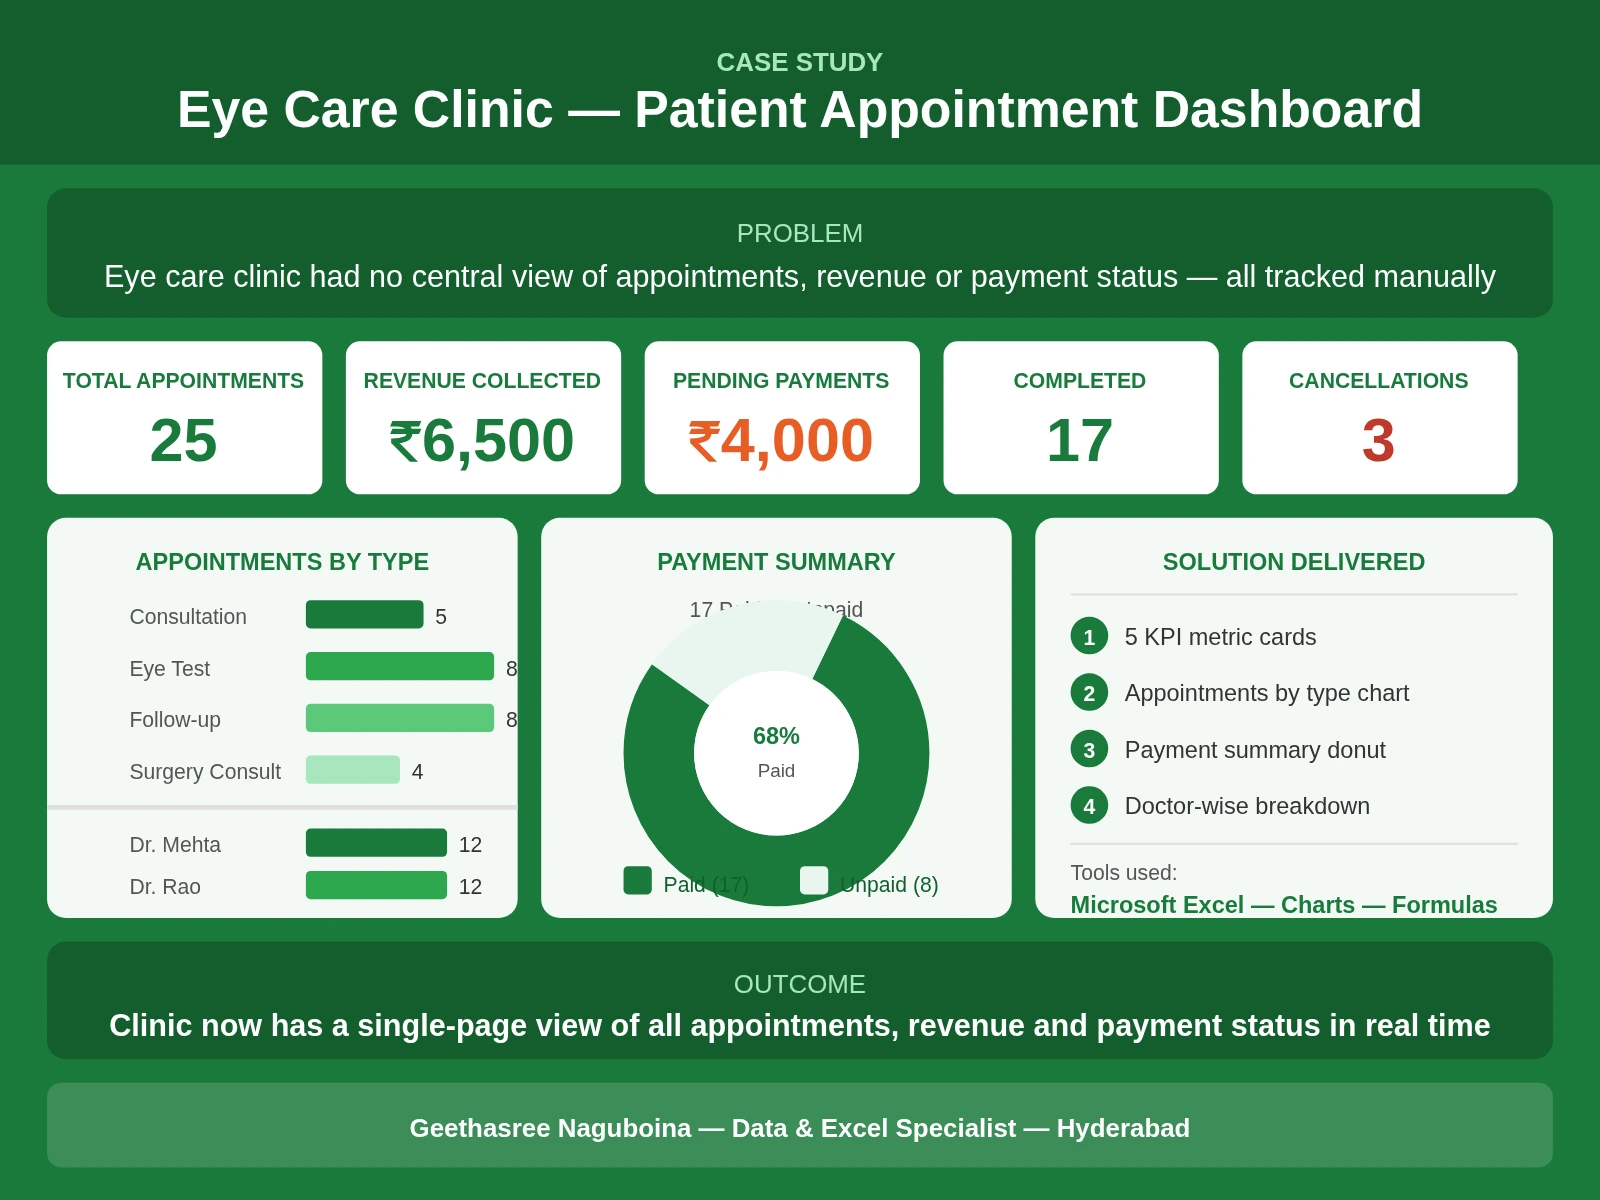
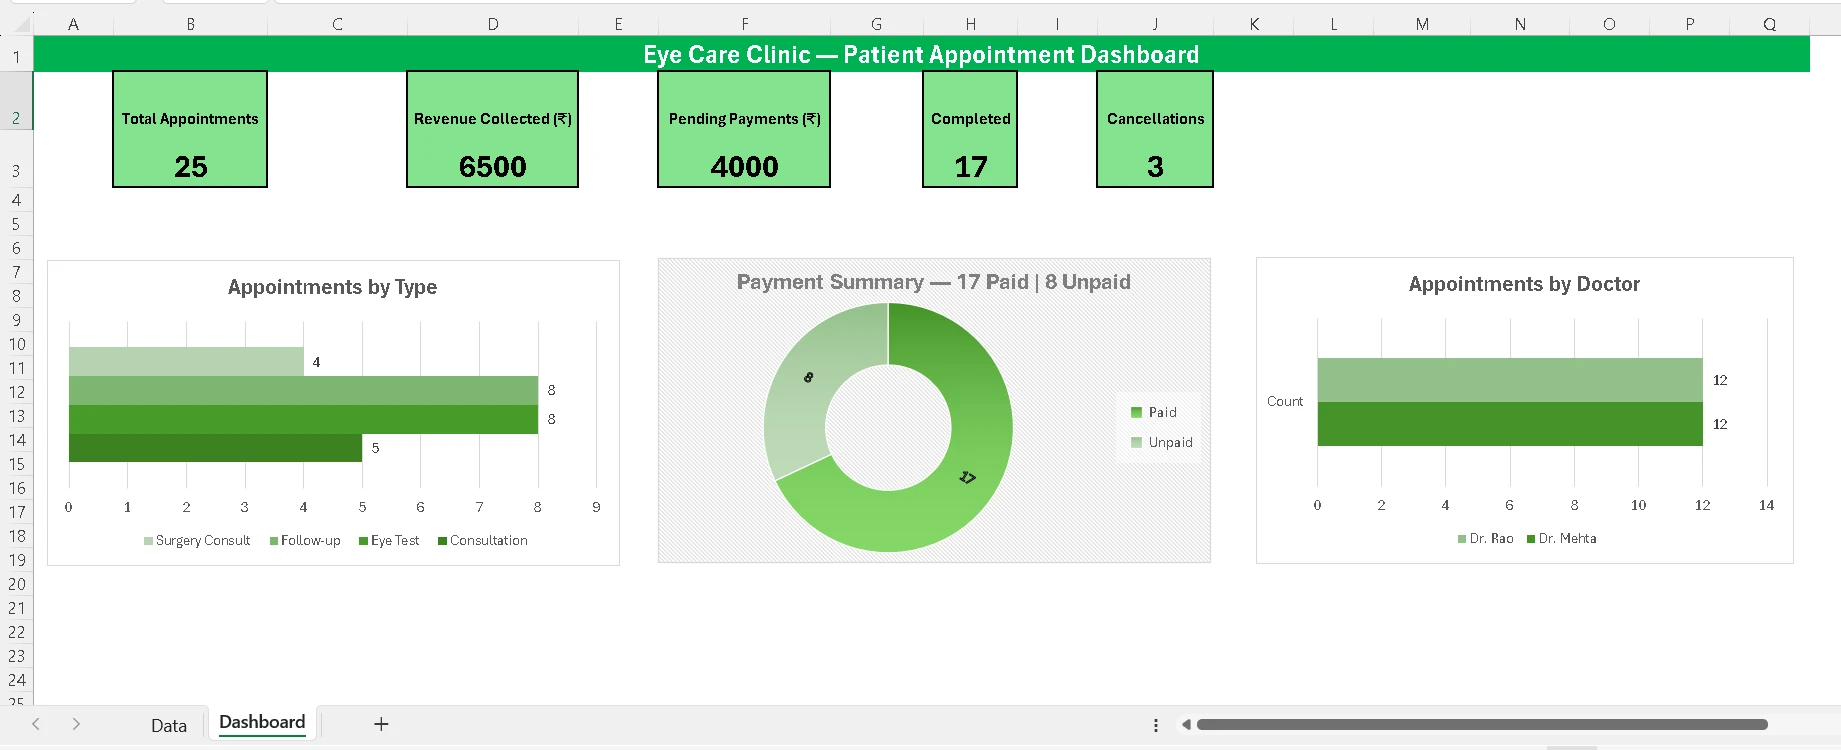
Built 5 KPI metric cards — Total Appointments, Revenue Collected, Pending Payments, Completed Appointments and Cancellations
Created an Appointments by Type bar chart showing volume across Consultation, Eye Test, Follow-up and Surgery Consult categories
Built a Payment Summary donut chart showing 68% paid vs 32% unpaid split clearly
Added a Doctor-wise Appointments breakdown comparing Dr. Mehta and Dr. Rao
Applied a clean green color scheme appropriate for a healthcare setting
Removed gridlines and added a professional dashboard title for a polished final look
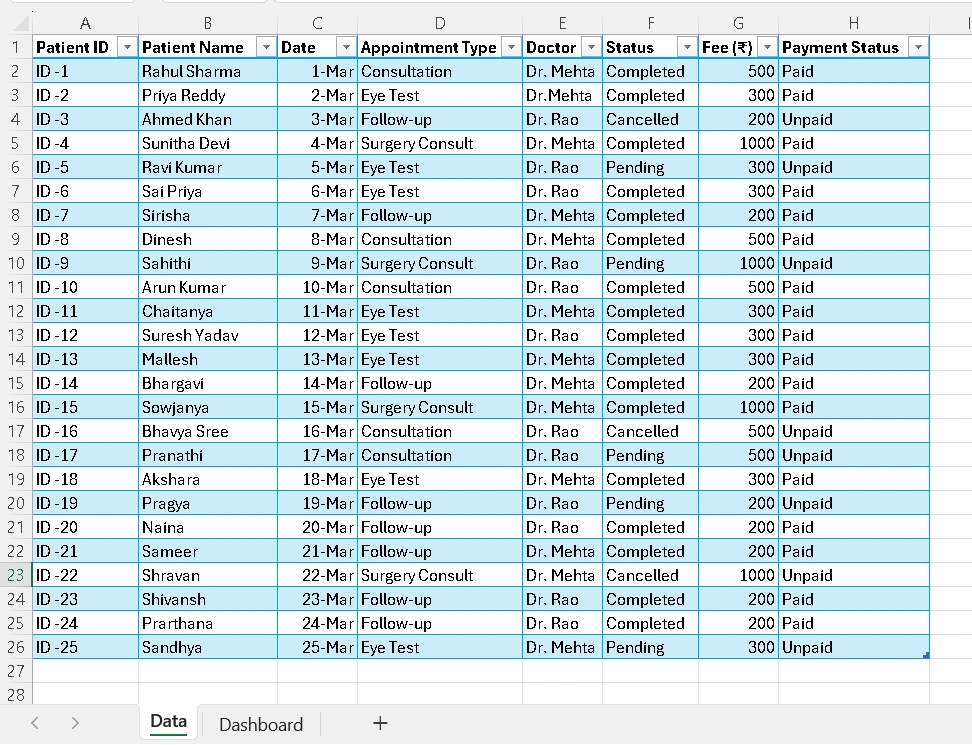
Created Data
4. Final Outcome
The client received a clean, professional one-page Excel dashboard that gives an instant view of clinic performance. The dashboard clearly shows where revenue is coming from, which appointments are pending payment, and how appointment load is distributed across doctors and categories.
This sample demonstrated how even a small clinic with basic data can benefit from a structured Excel dashboard — saving hours of manual reporting and giving the team a clear picture of operations at any point in time.
Sample Dashboard
Note: This dashboard was built as a sample project on direct client request to showcase the approach and value before a full engagement.
Like this project
Posted Mar 31, 2026
Built a sample Excel dashboard on client request — tracking appointments, revenue, payment status and doctor performance for an eye care clinic.
Likes
1
Views
4