CloudPulse

Anna Yatsyniak

📌 Executive Summary
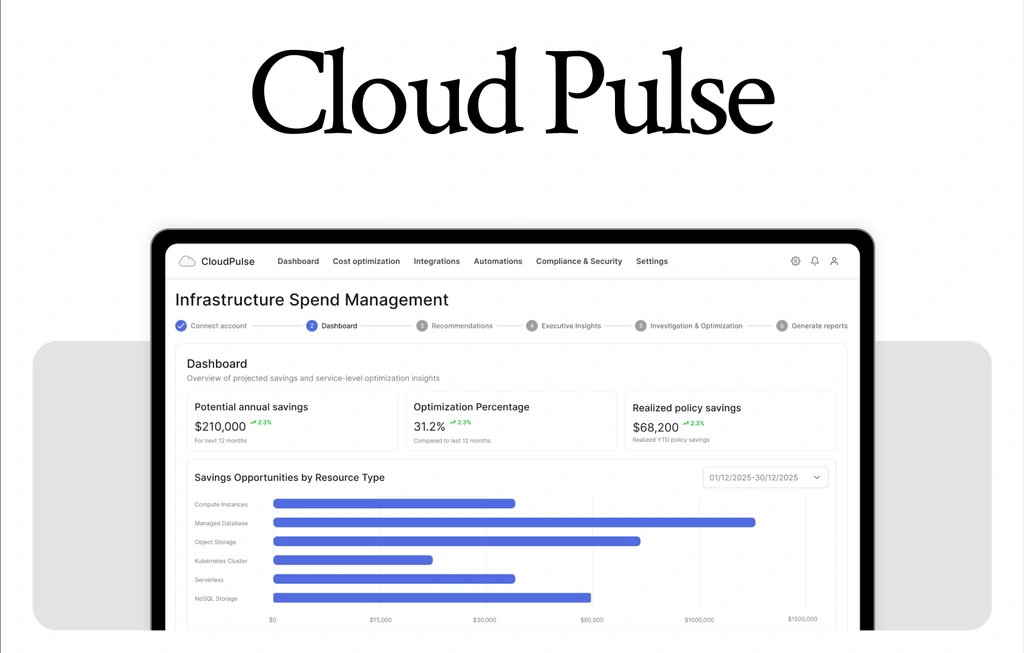
CloudPulse is an enterprise FinOps platform designed to help DevOps, SecOps, and Finance teams analyze, optimize, and remediate cloud infrastructure spend across multi-cloud environments.
The primary challenge was transforming raw, complex cost metrics and security misconfigurations into a structured, step-by-step remediation flow without overwhelming technical users.
🎯 The Problem & Business Challenge
Lack of Actionability: Existing FinOps tools flag cost anomalies but force engineers to manually fix issues across different provider consoles.
Complex Data Density: Managing accounts with thousands of resources leads to cognitive overload and missed savings opportunities.
Compliance & Security Risks: Cost inefficiencies often stem from misconfigured identity access (IAM) and orphan infrastructure, posing security threats.
💡 The Solution: 6-Step Guided Remediation Flow
Designed a unified, linear stepper system that guides users from broad cloud account connection to granular resource-level remediation and executive reporting.
Step 1: Onboarding & Multi-Cloud Account Connection
To deliver tailored cost-optimization insights, the platform requires access to infrastructure data. Step 1 establishes a secure, frictionless entry point allowing engineering leads to link their cloud environments (AWS, GCP, Azure) without security risks.
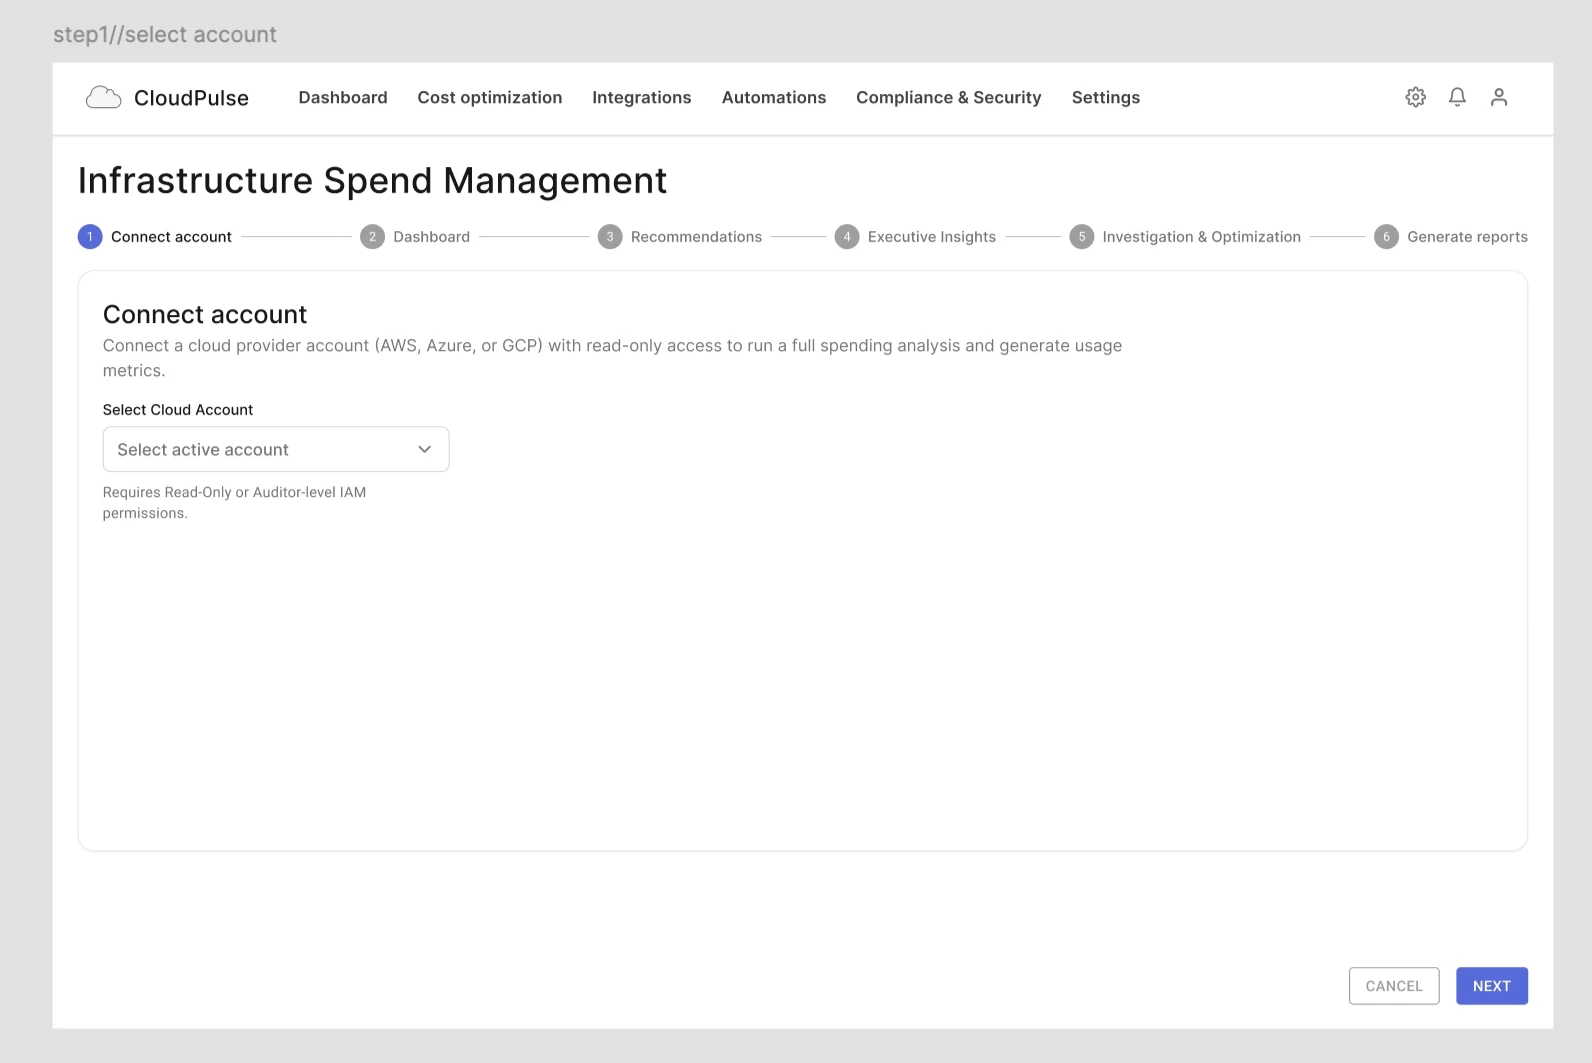
Initial account connection setup screen emphasizing low-friction onboarding and read-only IAM security compliance.
Zero-Trust Security Alignment: Explicitly displaying the Read-Only / Auditor-level IAM permissions requirement mitigates security friction for enterprise engineering leads during setup.
Vendor-Neutral Onboarding: Structured the architecture to support multi-cloud environments (AWS, GCP, Azure) under a unified setup experience.
Progress Transparency: Integrated a 6-step progress indicator at the top to set clear expectations and reduce cognitive load for multi-stage remediation.
Step 2: Onboarding & Multi-Cloud Account Connection
Once the cloud account is connected, the dashboard provides immediate visibility into cost-reduction opportunities. Step 2 synthesizes high-level financial metrics and categorizes potential savings by resource type, giving stakeholders an actionable overview of infrastructure waste
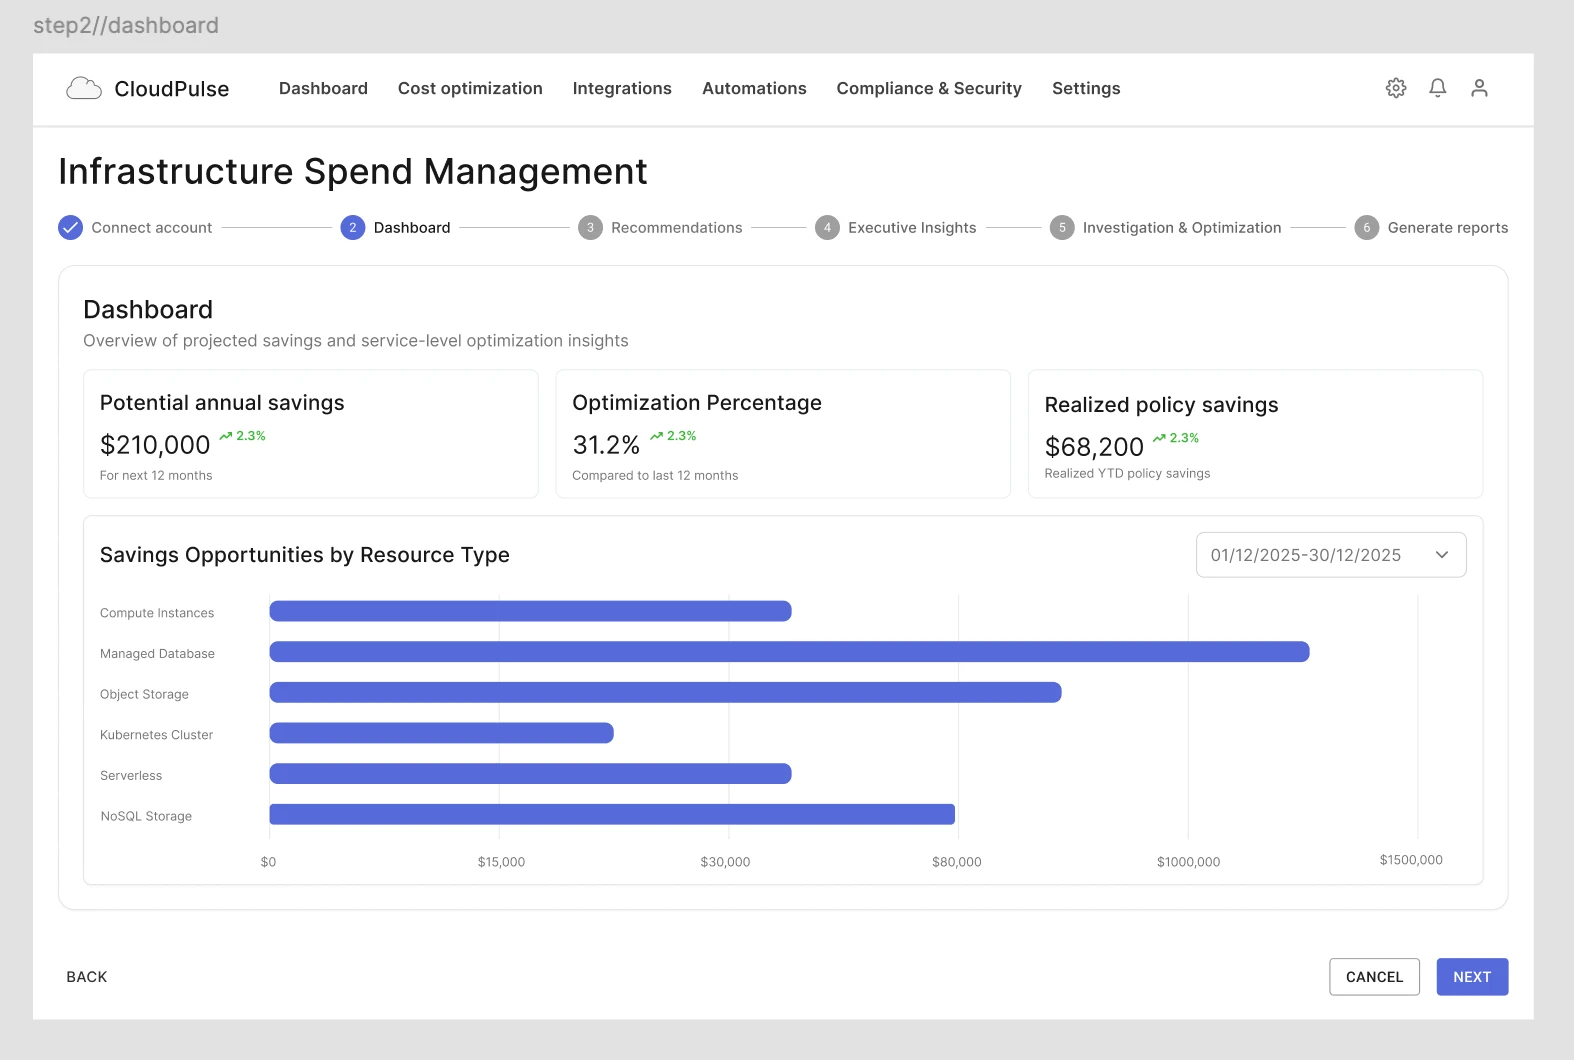
Executive dashboard displaying aggregated financial metrics, potential annual savings, and opportunity breakdowns by resource type.
High-Impact Financial Metrics:
Prominently places key KPI cards (Potential annual savings, Optimization Percentage, and Realized policy savings) at the top of the viewport, enabling engineering leads and executives to immediately grasp the platform's business value ($210k+ savings potential).
Categorized Resource Breakdown:
Utilizes a horizontal bar chart (Savings Opportunities by Resource Type) to group infrastructure costs across core categories (Compute Instances, Managed Database, Object Storage, etc.), allowing users to quickly pinpoint high-waste areas.
Flexible Timeframe Filtering:
Integrates a date-range selector to support both long-term annual trend evaluation and granular analysis of short-term spending spikes.
Step 3: Resource Recommendations & Risk Assessment
Moving from macro metrics to action, Step 3 breaks down optimization opportunities into specific, resource-level recommendations. This view enables DevOps teams to evaluate cost-efficiency actions alongside operational risk parameters such as disruption and severity levels.
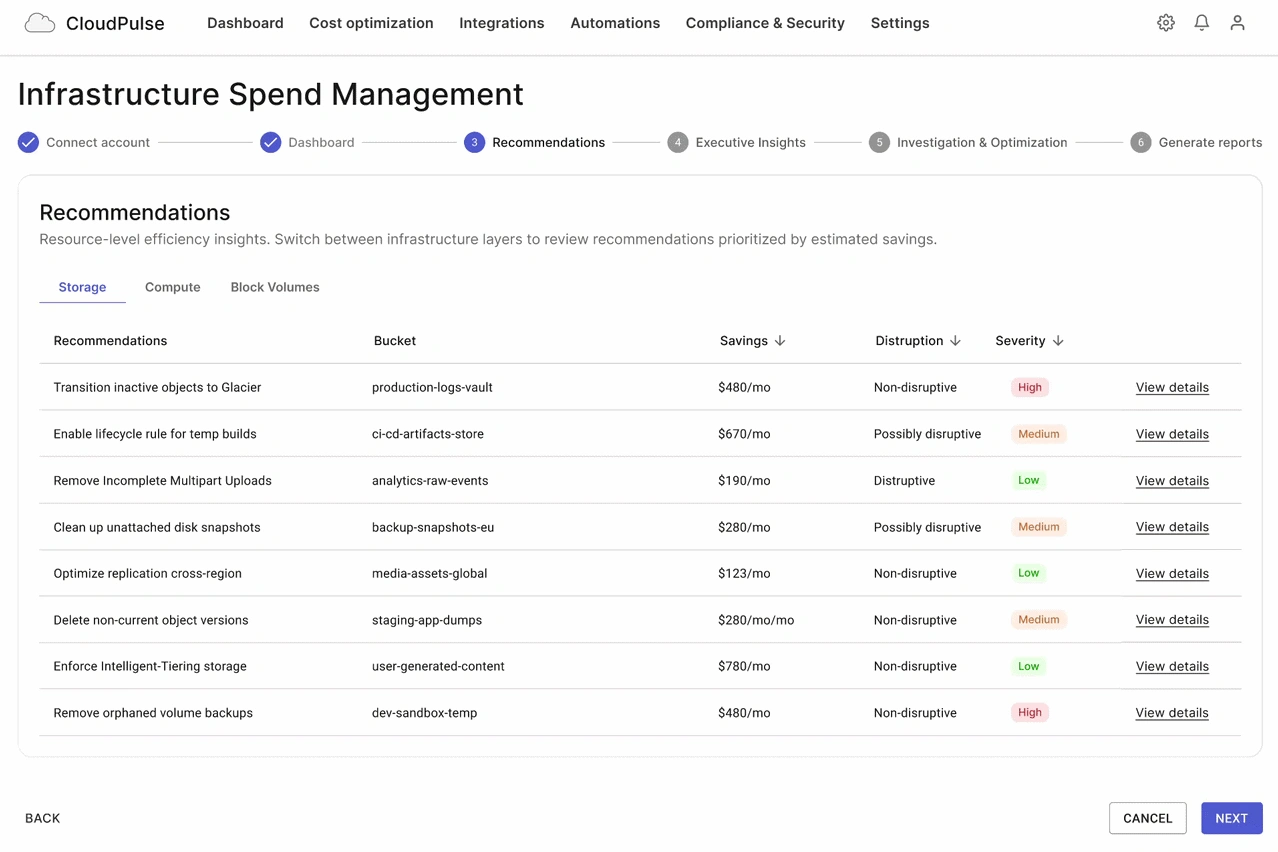
Actionable recommendation engine featuring tabbed infrastructure categorization, prioritized monthly savings, and disruption/severity risk badges
Infrastructure Layer Segmentation:
Organizes recommendations into clear resource categories (Storage, Compute, Block Volumes) via top tab navigation, preventing cognitive overload in dense data environments.
Risk vs. Reward Prioritization:
Pairs estimated monthly savings (Savings) directly with Disruption (Non-disruptive, Possibly disruptive, Disruptive) and Severity indicators, allowing teams to quickly identify low-risk, high-yield "quick wins."
Contextual Deep-Dives:
Provides inline View details triggers for each item, establishing a clear path from high-level recommendation tables to specific bucket remediation steps.
Step 4: Executive Insights
To bridge the gap between technical recommendations and executive decision-making, Step 4 synthesizes granular remediation data into high-level strategic metrics. This view empowers engineering leadership and C-suite stakeholders to review net savings potential, evaluate categorized initiatives, and sign off on remediation decisions.
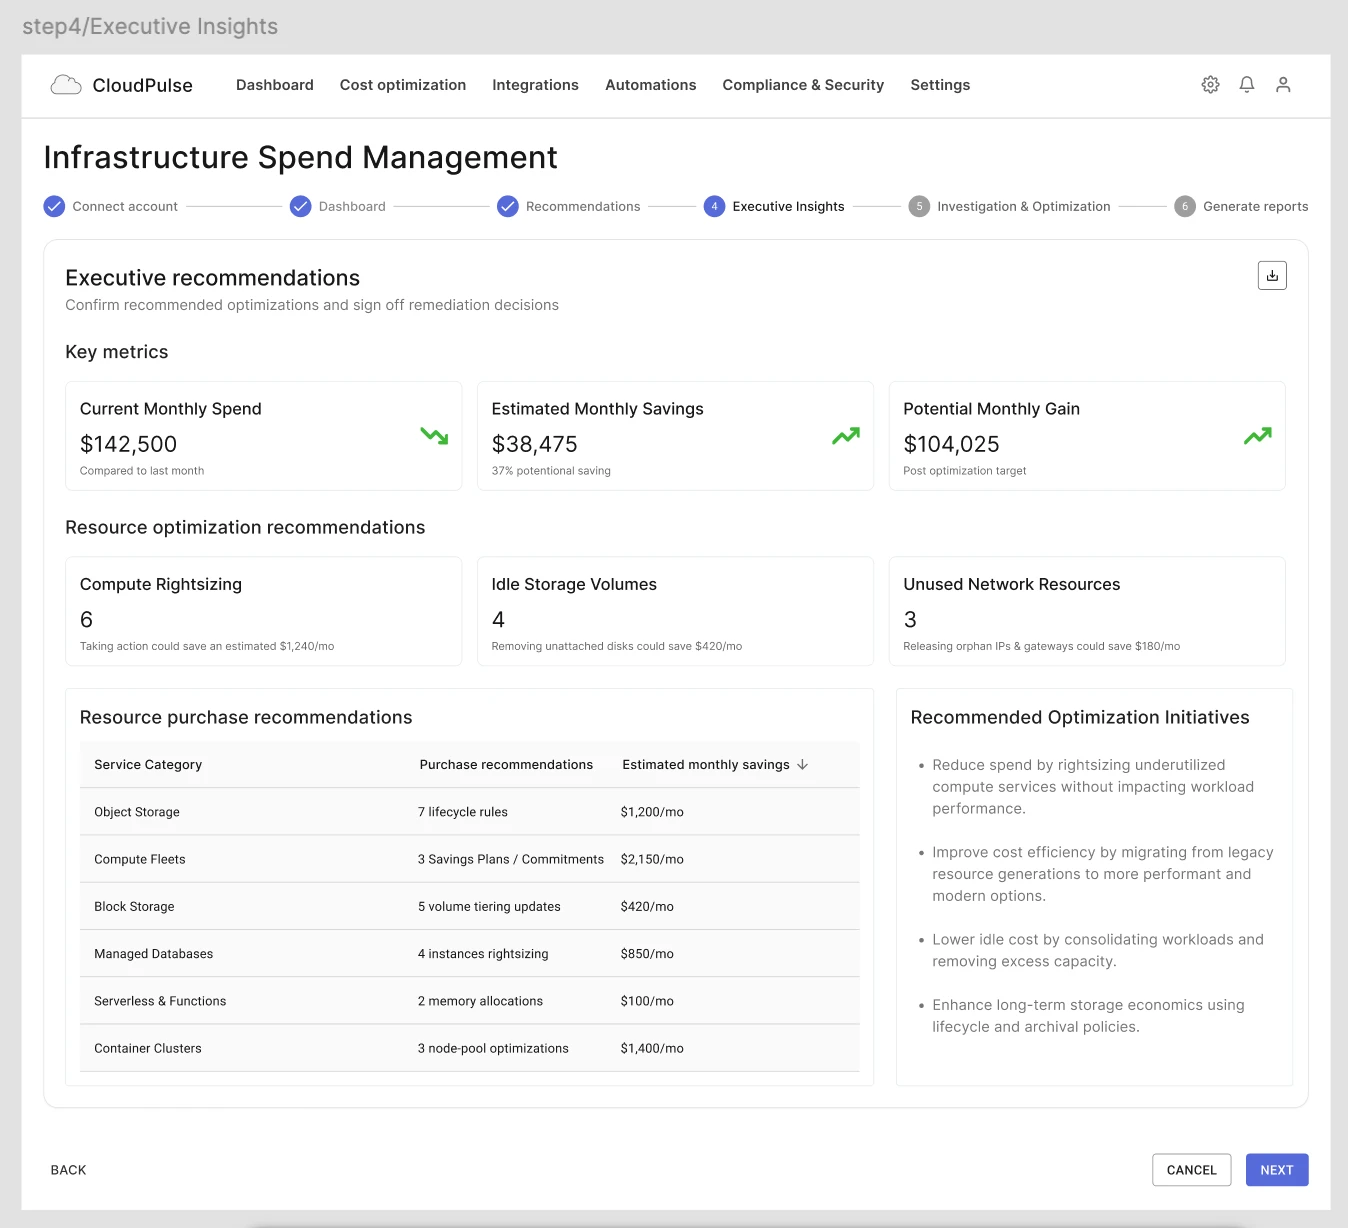
Executive insights dashboard combining top-level spend/gain metrics, categorized infrastructure optimization buckets, and strategic policy recommendations.
Executive-Level Financial Clarity:
Highlights current monthly spend alongside estimated savings and post-optimization targets ($104k+ net gain), giving decision-makers immediate clarity on financial ROI before approving system-wide changes.
Categorized Remediation Buckets:
Groups technical fixes into high-level categories (Compute Rightsizing, Idle Storage, Unused Network Resources) with clear monthly impact tags, simplifying complex cloud architecture decisions.
Strategic Initiative Guidance:
Translates raw resource data into plain-language business initiatives (Recommended Optimization Initiatives), creating a shared context between finance and engineering teams.
Step 5: Investigation and Optimization
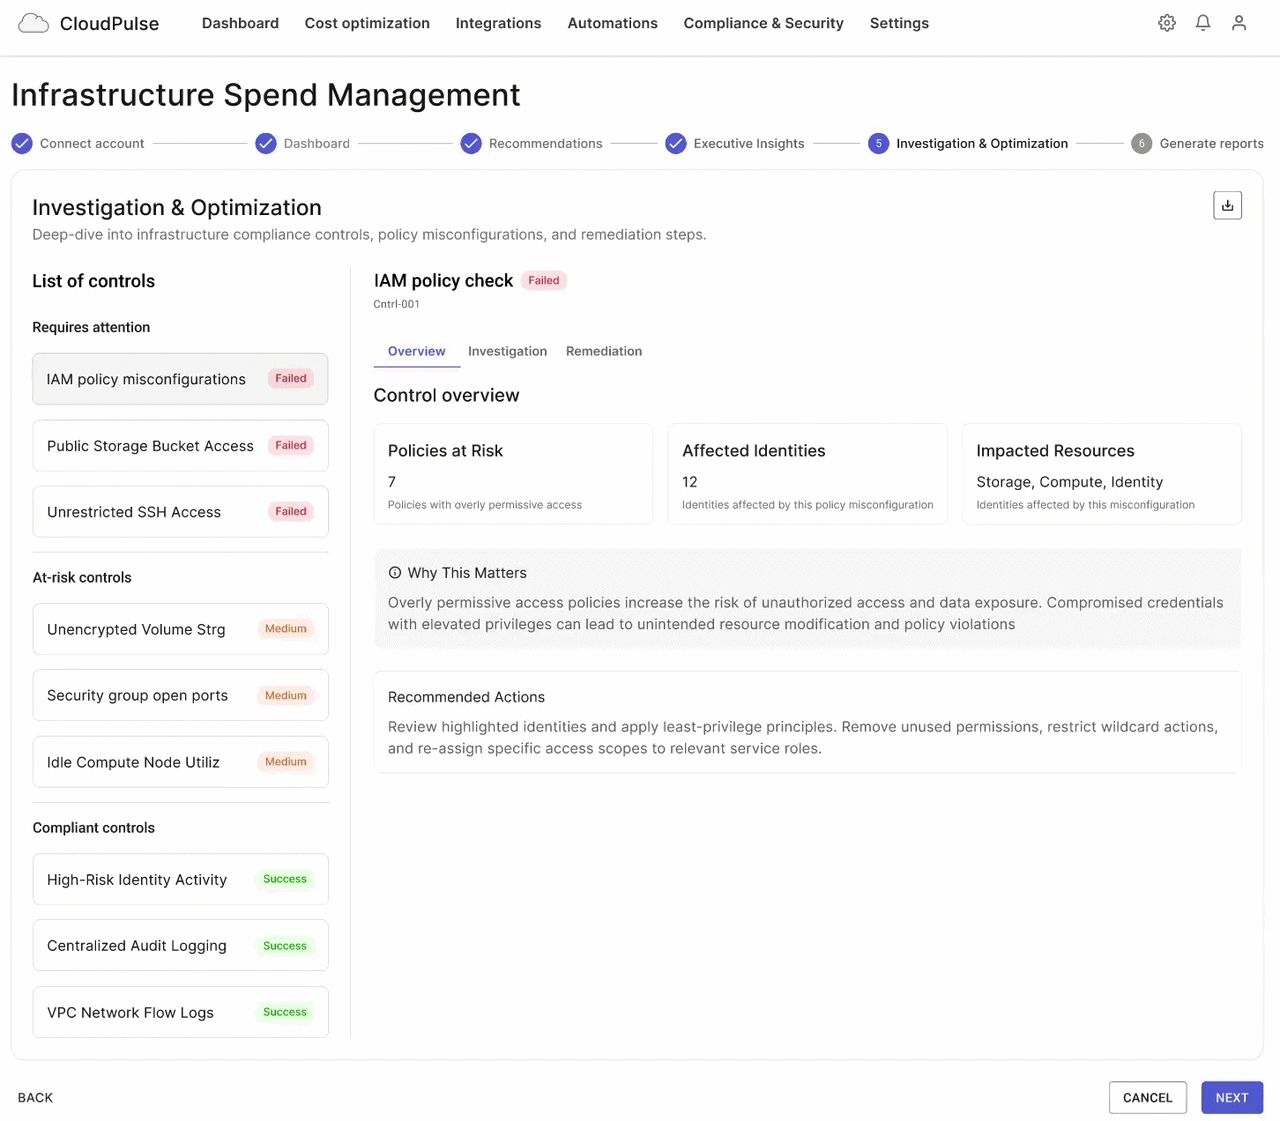
Deep-dive investigation workspace featuring prioritized control status badges, cross-resource dependency mapping, and automated IaC remediation execution.
Categorized Compliance Control Hub:
Groups security and governance checks into explicit severity tiers (Requires attention, At-risk, Compliant), enabling engineers to immediately isolate high-risk vulnerabilities like IAM misconfigurations.
Context-Rich Dependency Mapping:
Provides full visibility into affected identities, usage spikes, resource tags, and ownership structures (Security Engineering / DevOps), ensuring risk decisions are informed by operational context.
Flexible Remediation Delivery:
Offers tailored execution workflows (Infrastructure as Code, Automation Scripts, or 1-Click Direct Remediation), seamlessly fitting into existing engineering pipelines and Git-based codebases.
Step 6: Automated Reporting & Export
To complete the governance lifecycle, Step 6 provides seamless export capabilities for auditing, financial compliance, and cross-team alignment. Users can generate tailored documentation across multiple output formats to share remediation progress with non-technical stakeholders or integrate into external accounting workflows.
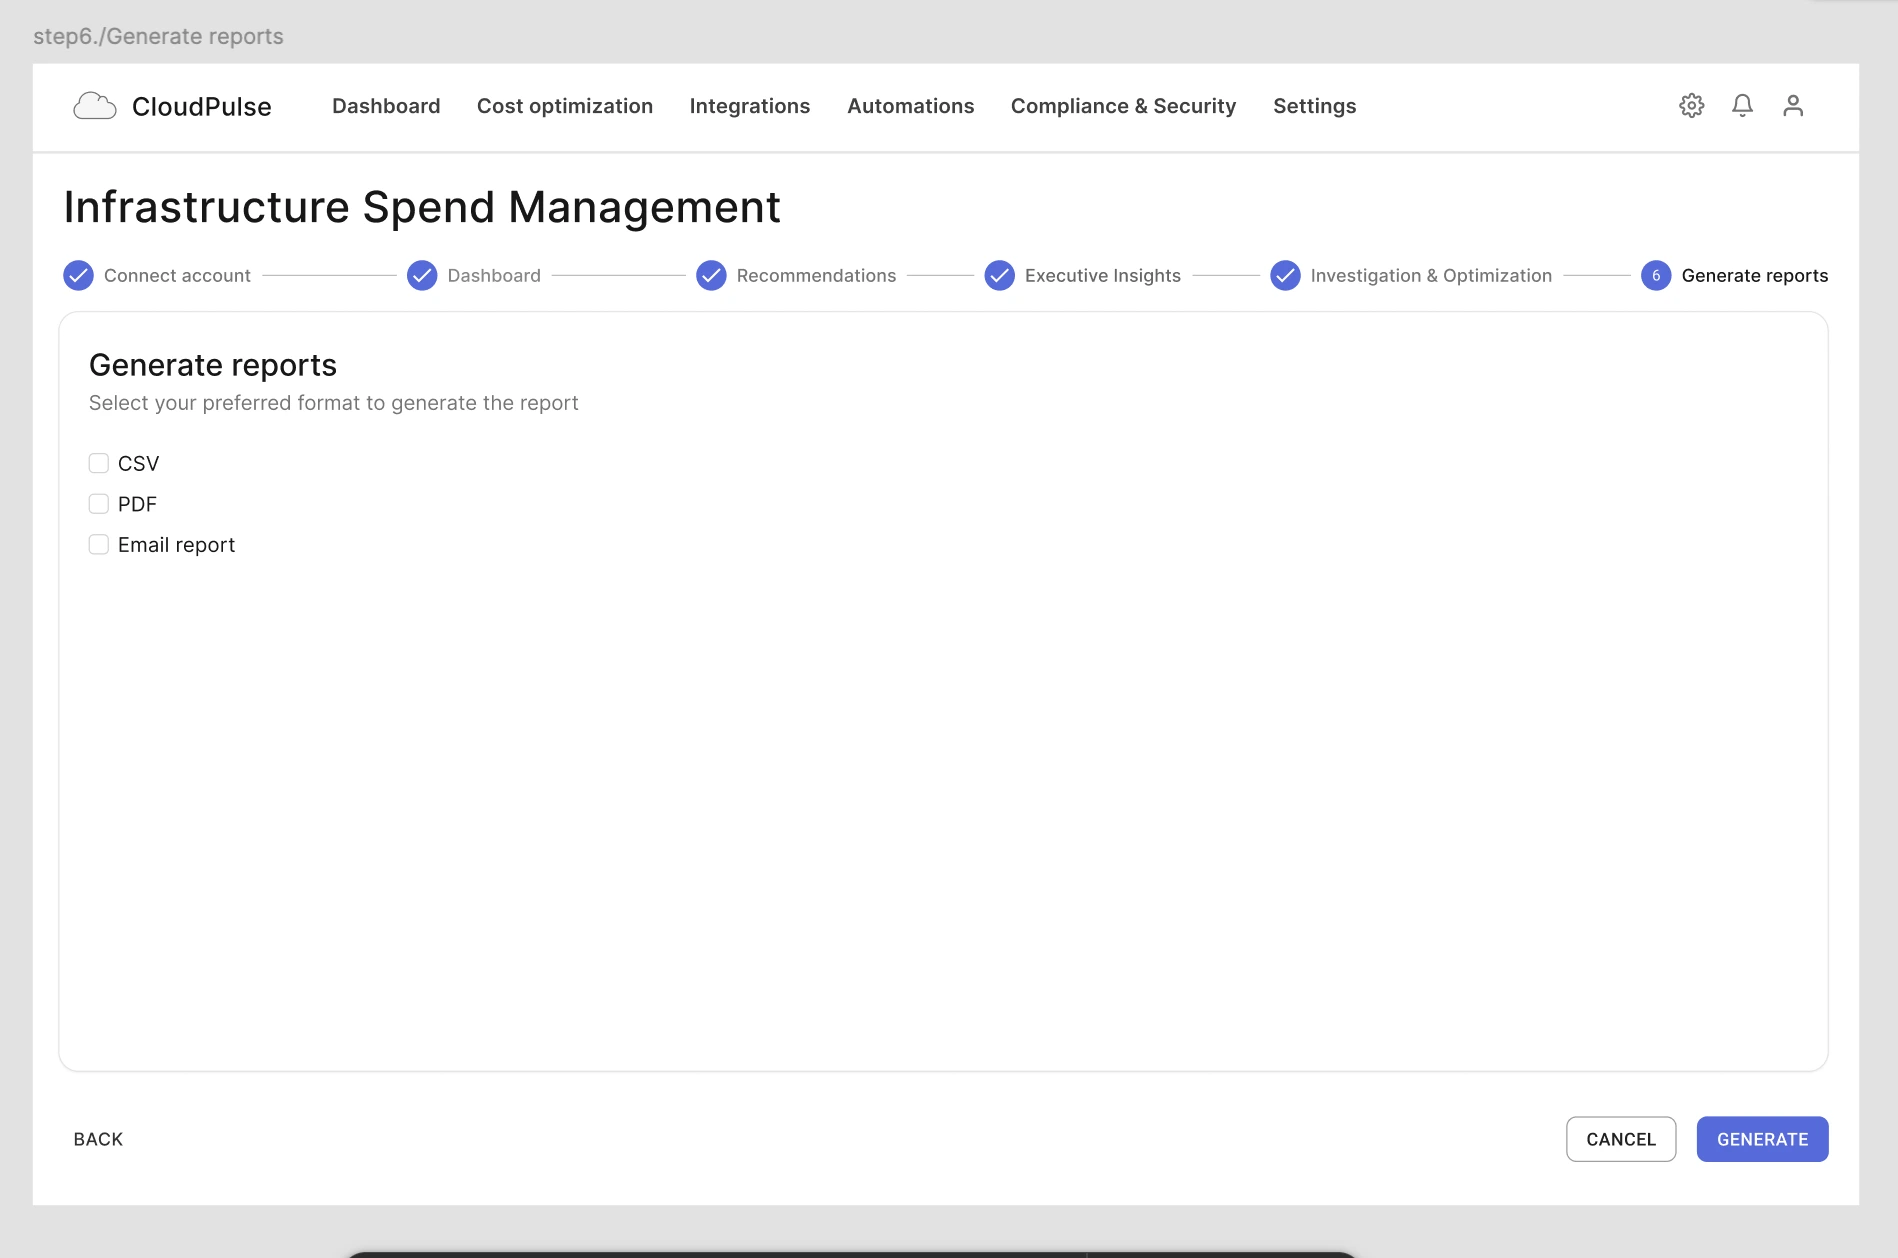
*Multi-format report generation module offering flexible export options (CSV, PDF, direct email distribution) for stakeholders.*
Flexible Output Formats:
Supports targeted export types—raw data (CSV) for FinOps analysts, executive summaries (PDF) for leadership, and automated email delivery for recurring syncs.
Zero-Friction Distribution:
Streamlines reporting into a single step, ensuring audit readiness and eliminating manual spreadsheet assembly for operations teams.
Conclusion & Next Steps
By structuring CloudPulse around a clear 6-step workflow, the platform transforms complex, multi-cloud spend data into actionable insights for both technical teams and executive leadership. The system reduces operational friction, speeds up policy remediation, and ensures complete financial visibility across infrastructure layers.
Figma File: CloudPulse – B2B SaaS Case Study & Interactive Prototype
Design System: Untitled UI Kit (Customized)
Core Artifact: 6-Step End-to-End User Flow
Like this project
Posted Aug 11, 2026
CloudPulse is an enterprise FinOps platform designed to help DevOps, SecOps, and Finance teams analyze, optimize, and remediate cloud infrastructure spend
Likes
0
Views
2