Vehicle Sales Analysis in Excel
Ken Warren
Vehicle Sales Analysis in Excel
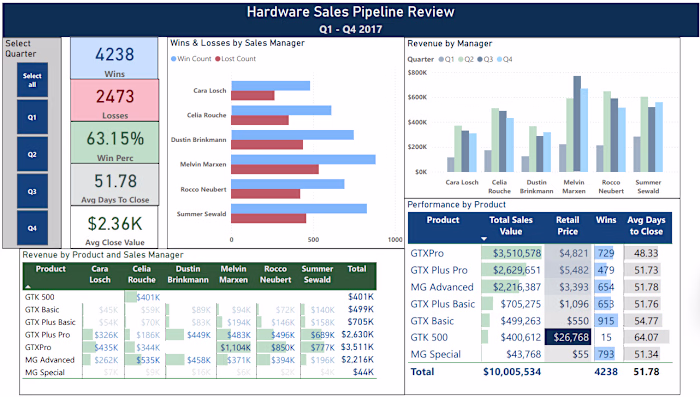
Vehicle Sales Data Analysis using Excel / Power Pivot on the data provided by the SQL for Data Analytics book by Upom Malik, Matt Goldwasser, and Benjamin Johnson (Packt Publishing).
This dataset contains sales, products (automobiles & scooters), and other information. The sales and product tables were exported from PostgreSQL as CSV files and loaded into Excel. The sales data starts in 2010 and runs through May 2019. The project's goal was to review the overall sales (revenue & count) and determine if the company is on track for the remainder of 2019.
Excel Functions and formulas used:
SUMIFS
COUNTIFS
XLOOKUP
Charts (Bar, Stacked Bar, Line, Combo-Bar & Line)
YEAR extraction from dates
FORECAST.LINEAR
Tables
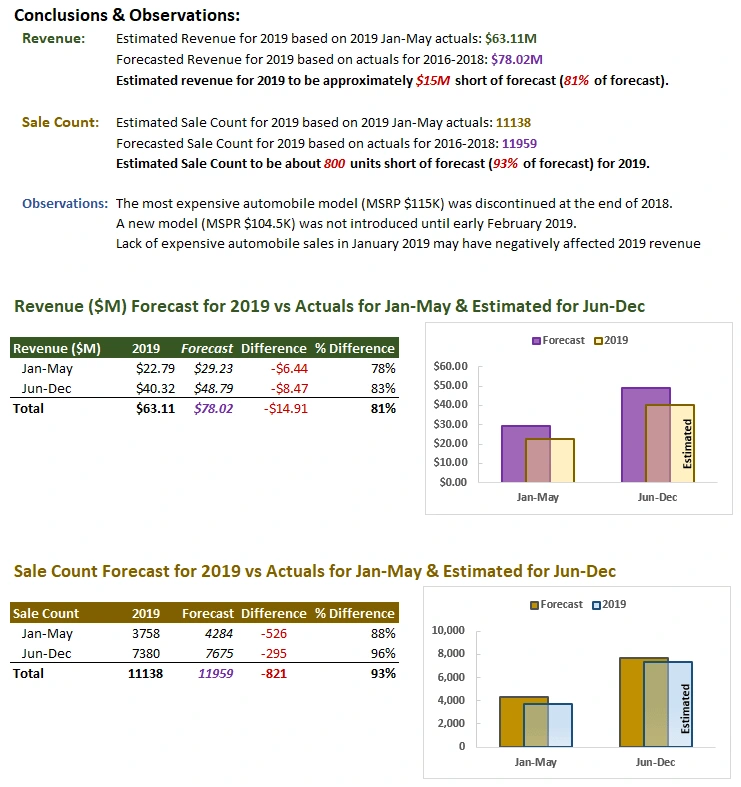
Summary Page of the Vehicle Sales Analysis
Like this project
Posted Apr 17, 2024
Several CSV files containing sales and product data were imported into Excel with the goal of determining if sales were on track for the remainder of 2019.
Likes
1
Views
49