CRM Sales Opportunities Analysis in Power BI
Ken Warren
CRM Sales Opportunities Analysis
This dataset contains information from a fictional company that sells computer hardware. It is available from the Maven Analytics Data Playground at: https://mavenanalytics.io/data-playground. There were 4 CSV files included in this dataset:
Accounts – contains information regarding customers.
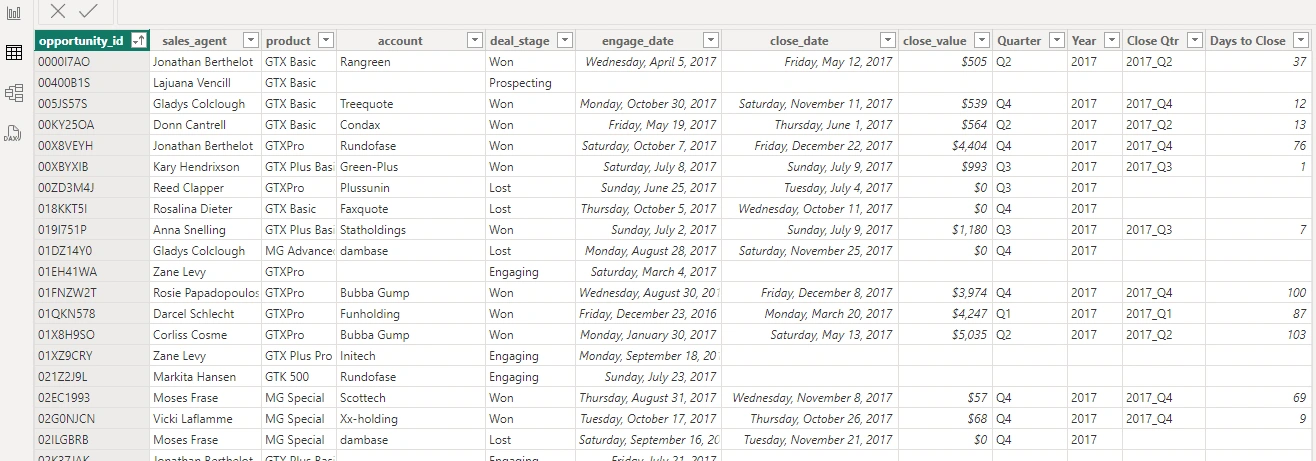
Sales Pipeline – contains information about bids, including dates, status (won/lost/prospecting/engaging), value of the sale, and sales agent.
Sales Team – list of sales agents, sales manager, and office location.
Products – list of products for sale, including their retail price.
Project Goal
The goal of this project was to visualize the sales opportunities in a Power BI dashboard to show an overview of how well the sales have been going and for the Sales Managers to understand how their teams have been performing.
Data Preparation & Cleaning
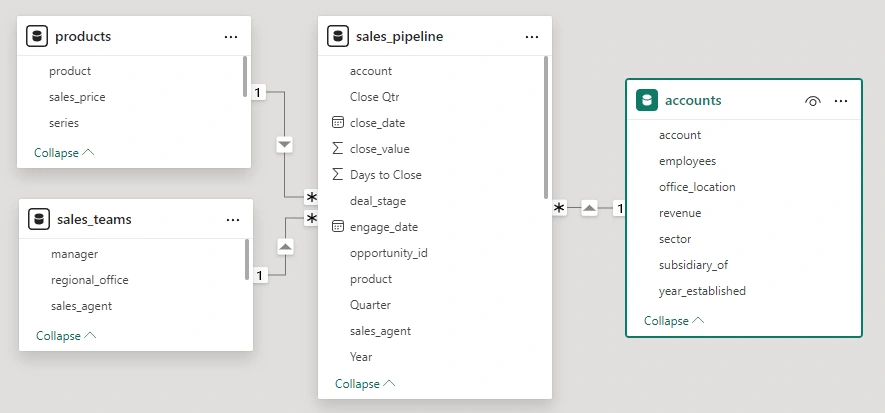
All 4 files were loaded into Power BI and relationships between the datasets were established.
The main data of interest was the Sales Pipeline data since it contained the bulk of the interesting information. The data appeared to be relatively clean from the start, but the data types on a few columns were updated. For example, the “close_value” column data type was updated to currency. Additionally, a few new columns were created. These included a Quarter and Year, derived from the “close_date” (only available for those opportunities either won or lost). Another column, “Days to Close” was created by subtracting the “close_date” from the “engage_date” to determine how long it took to win the opportunity.
Several measures were created in Power BI to calculate things like win count, loss count, win percentage, average close value, average days to close, and total revenue. In addition, similar measures were created that would ignore slicers and filters to compare those values to those for certain Sales Managers or Sales Agents. The final group of measures created were those that calculated the difference between a measure and its no filter/slicer counterpart. These measures were used to show how the performance of individual Sales Agents compared to the overall performance.
Below are a couple of examples of the created measures:
Avg Close Value = AVERAGEX(filter(sales_pipeline,[deal_stage]=”Won”),[close_value])
Win Count = COUNTAX(FILTER(sales_pipeline,sales_pipeline[deal_stage]=”Won”),[deal_stage])
Power BI Visualizations
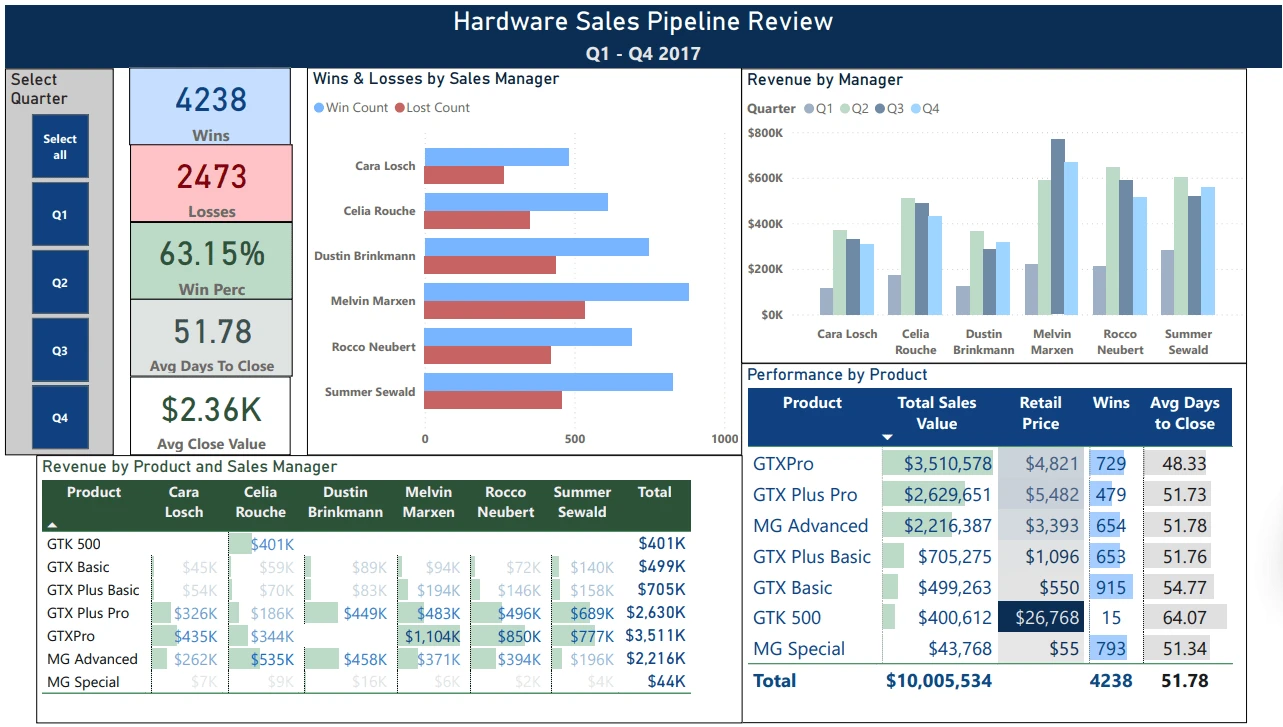
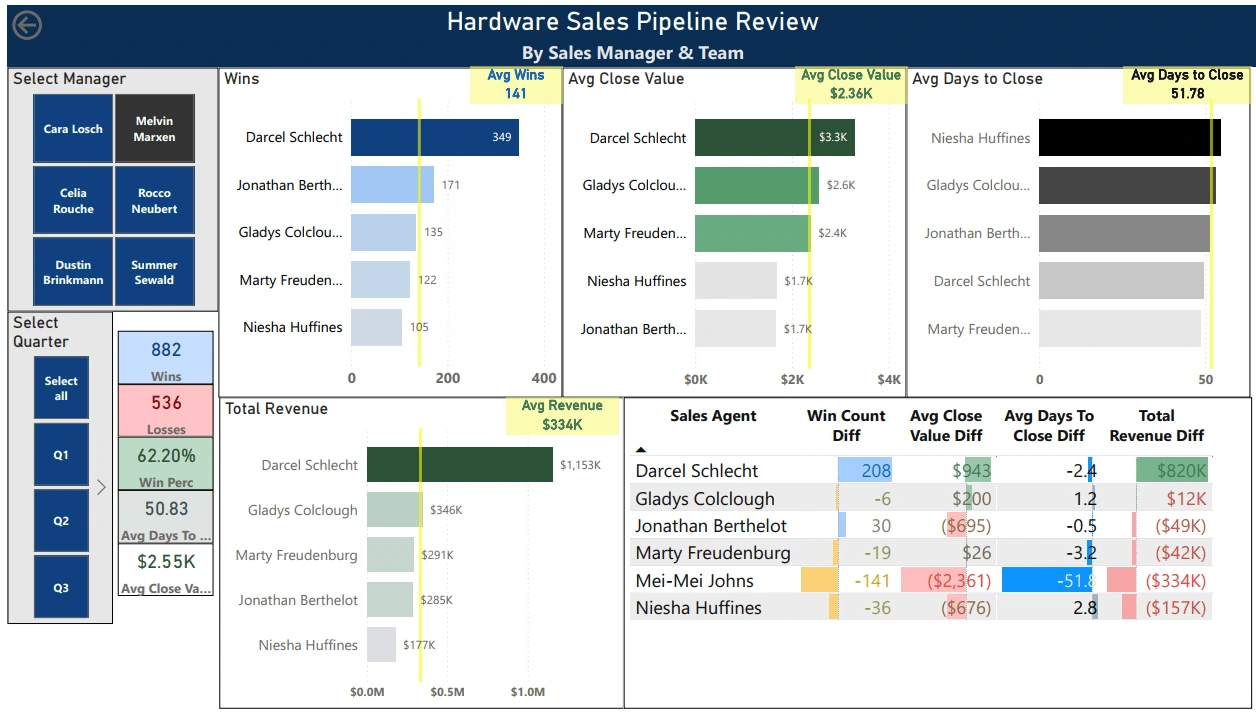
The Power BI visualization contained three pages. The first was a performance overview showing each Sales Manager’s team performance. Also included were the overall wins, losses, win percentage, average days to close, and average close value (revenue). This page also contains a slicer where the user can select a particular Quarter. By default, all four quarters are selected.
The second page contains the visualizations that show how the individual Sales Agents have performed, based on a slice with the Sales Managers listed. Multiple Sales Managers can be selected with a Ctrl-click. The example below is from when the Sales Manager, Melvin Marxen, was selected.
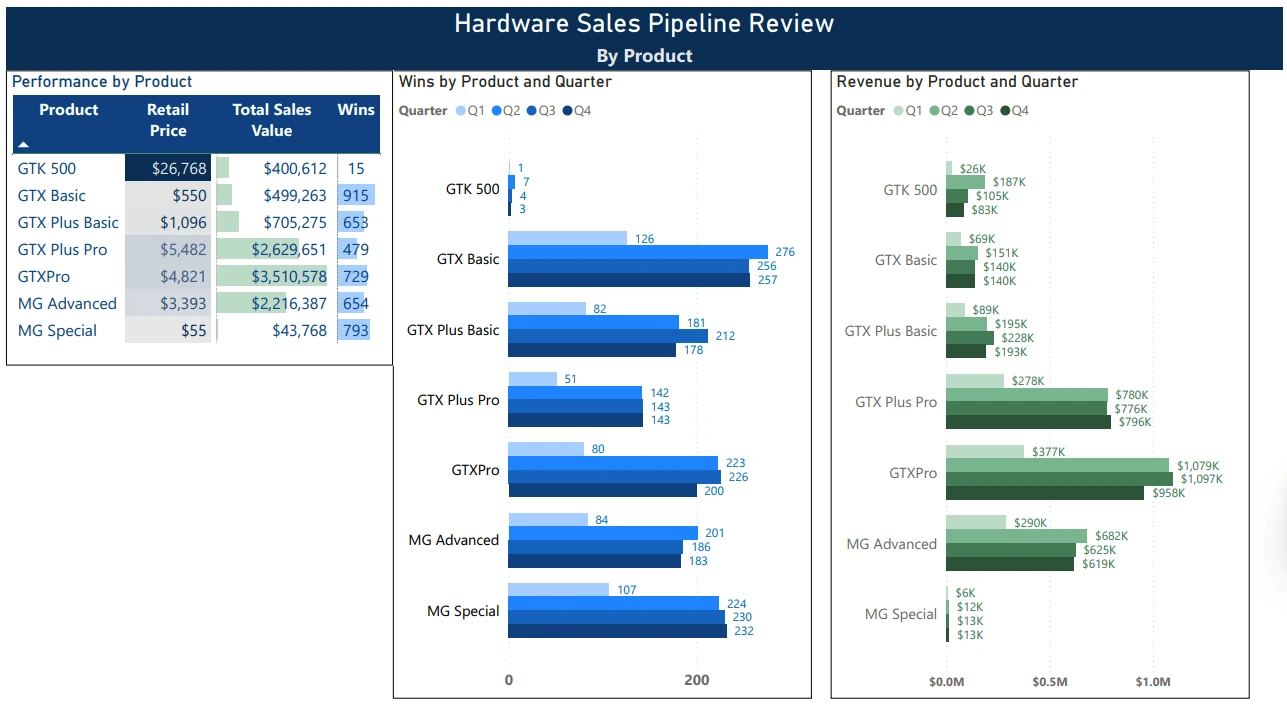
The third, and final, page contains visualizations based on the different products being sold. First, there’s a table containing a list of the products, their retail price, total sales value, and number of wins. The bar graphs show how many wins per quarter each product had and the total revenue per quarter for each product.
Like this project
Posted Jun 21, 2024
Created a Power BI dashboard visualizing the sales opportunities for a fictional computer hardware company.
Likes
1
Views
247