Sales Spreadsheet (Google Sheets)

Jonathan Phillip


Project Summary:
My goal for this little project was to take a dataset containing supermarket sales info and perform an exploratory analysis on it using Google Sheets. I wanted to take spreadsheet tools like pivot tables, arithmetic formulas, pivot charts, and design themes then see if I can summarize the data's most important features effectively.
Step 1: Formatting
First, I took steps to make the data easier to understand by formatting it: Converting data types to their appropriate categories, moving and renaming columns for easier understanding, deleting irrelevant columns, making the data dynamic by writing calculation formulas that would replace the static info, and implementing a theme with alternating colors for each row to make readability slightly better.
Step 2: Relationship visualization
Next, I began setting up for building a dashboard by building dynamic visualizations using pivot tables and charts. For ease of navigation, each chart received its own tab with a dedicated pivot table. The topics of the charts were chosen based on which metrics and relationships were the best at summarizing the most important aspects of the dataset. The charts and their design features were built to be as informative as possible while also being easily readable.
Step 3: Dashboard Construction
Finally, the dashboard was constructed using the pivot charts of the previous step to put everything into one place for a nice visual summary of the dataset's most important info. I did my best to take data viz best practices into account such as: highlighting important info with a limited color palette that has contrasting colors, a grid-based chart alignment for visual harmony, labels and filters out of the way as to not clutter the screen, a dedicated KPI section to help viewers quickly grasp overall performance, and keeping text font/unit metrics consistent to reduce any confusing or disorienting effects.
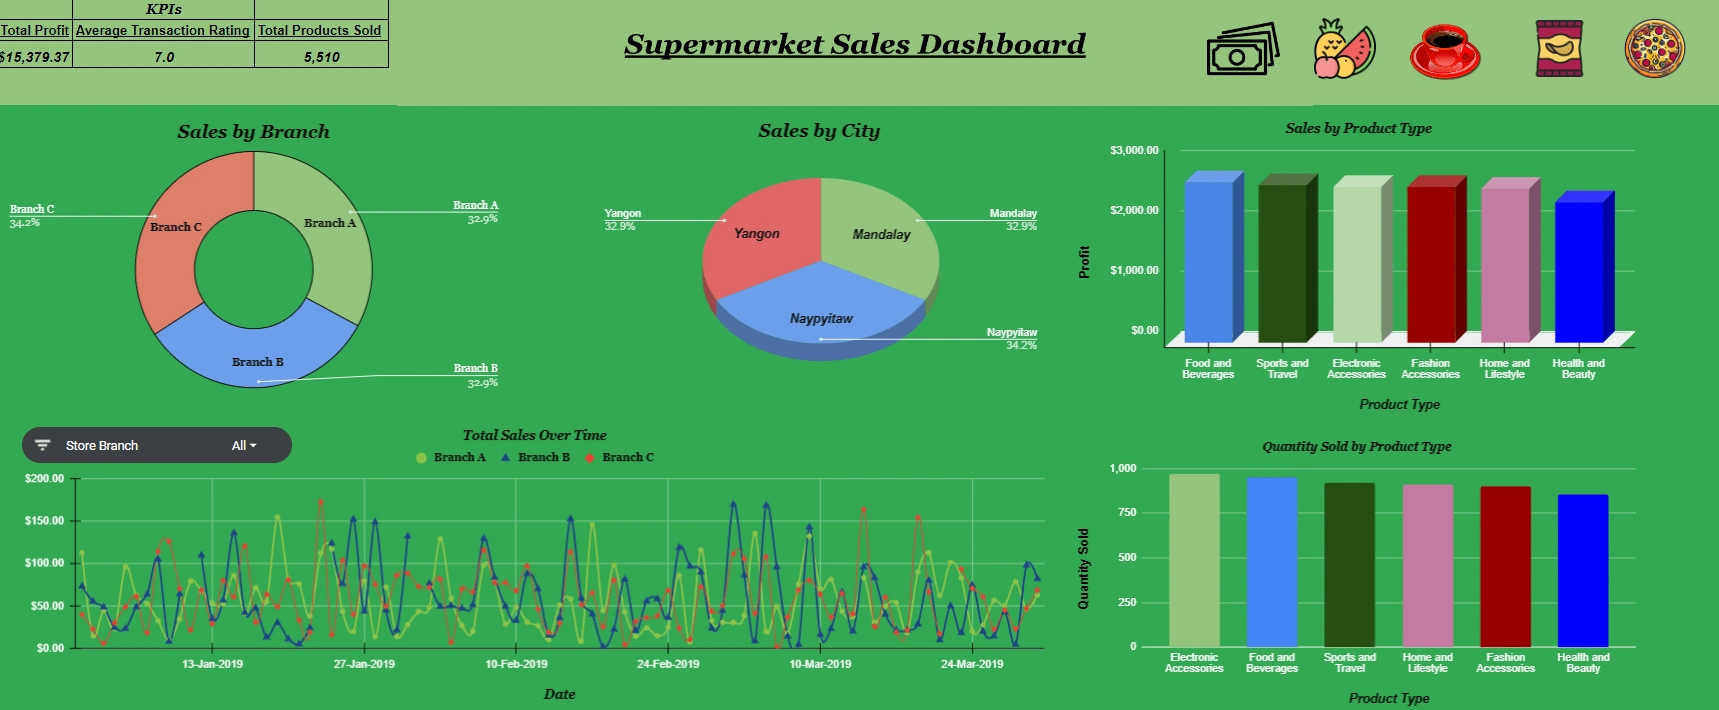
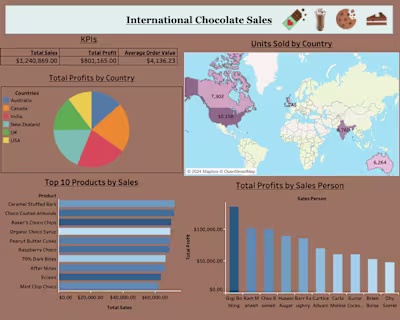
Final Dashboard
Find Google Sheets link here:
Like this project
Posted Oct 25, 2024
Going through a dataset containing supermarket sales data and performed EDA on it using Google Sheets before compiling the relevant insights into a dashboard.