Post-War Generation: The Precious Minority

Ryhannul Jannah

It is undeniable and will never change that understanding customers is the way to succeed and win business. By understanding them, an organization will be able to better target customers through segmentation and help them to define which marketing channel will reach customers best.
McKinsey’s “DataMatics” Survey in 2013 on 400 top managers of large international companies from a wide variety of industries proves the immense impact on corporate performance after performing customer analytics. Those who apply it broadly and intensely get the likelihood to generate profits and marketing earnings up to two times higher than those who don’t. About 50 percent of them even generate sales that are calculated to be higher than their competitors.
In this writing, I am going to show you an analysis I did on a dataset from Kaggle to find out how the reception of previous marketing campaigns was on existing customer segments. I also examined other factors, such as behavior and preferences, that the team can consider in formulating the following marketing program targets.
The dataset contains 2.236 rows of data with data on:
Customer Profile: Year of Birth, Web Visit, Education, Marital Status, Income, Deals Purchasement, Kids at Home (Kidhome), and Teen at Home (Teenhome).
— I customized some of these features, such as summarizing the Teen and Kid to Children, grouping ranges of Year of Birth to Generation based on World Bank Classification, and grouping the Marital Status into Alone and Partner. I also classify the Income into World Bank’s Income Level classification.
Product Preferences: MntWine, MntFruit, MntSweet, MntMeat, MntFish, MntGold
— The amount of money spent by each customer on certain types of products including Wine, Fruit, Sweets, Meat, Fish, and Gold.
Campaign Acceptance: AcceptedCmp1, AcceptedCmp2, AcceptedCmp3, AcceptedCmp4, AcceptedCmp5, Response
—Each customer’s acceptance of each campaign, starting from Campaign1 to Campaign6 (Response).
Channel Utilization: NumWebPurchase, NumCatalogPurchase, NumStorePurchase
— The number of purchases for each customer through each available channel
Problem-Solution Statement
Before getting into data processing, it is necessary to understand that this project is context bound:
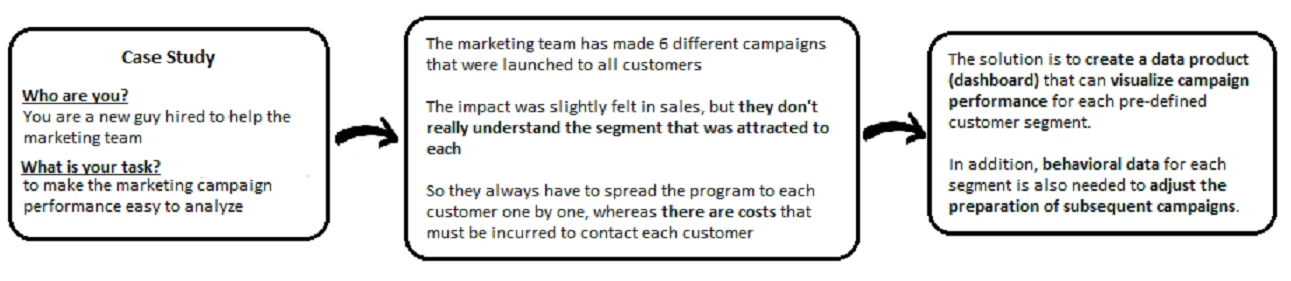
Here I play the role of a subject assigned to help the marketing team “read” the campaigns they are launching. This task departs from the problem:
“The marketing team has made 6 different campaigns that were launched to all customers. The impact of each was slightly felt in sales, but the team doesn’t really understand who and how much their program attracts. They always have to spread the program to each customer, one by one, whereas there are cost every time they contact each customer”.
So, I offer to create a dashboard that can help them understand each campaign’s performance and which customer segments each campaign has successfully attracted.
The dashboard will also provide information about the behavior of each segment. This will assist the team in preparing campaigns so that they can reduce marketing costs by only contacting customers who are in accordance with the targeting of the launched campaign.
By utilizing the limited data available, the metrics that will be displayed in the behavior section include Avg. Purchase Deals, Avg. Site Visits, Average Order Value (AOV), and Average Revenue per Customer (ARPC). I also display the Conversion Rate in another section to show the success rate of each campaign.
Here I group the customer segments based on six features in the ‘customer profile’ separately, including:
Generations
Monthly Web Visit: 0–2 times, 3–5 times, 6–8 times, …, 18–20 times.
Marital Status: Single or Partner
Kids at Home: 0, 1, 2, or 3
Education
Earning Levels
Data Preparation
There are no null and duplicate values in the dataset, but there are outliers in several features.
Many columns have outliers, but most of them seem like natural outliers that came from the population. In contrast, the outliers in Income and Year of Birth seem like entry errors.
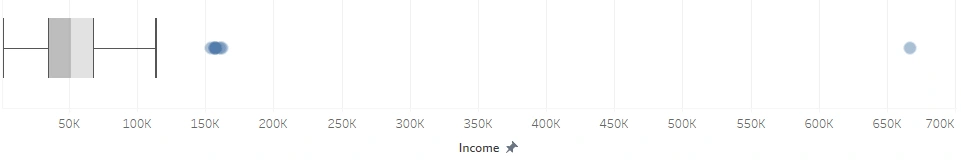
Outlier in Income
In the Income feature, there are customers who are recorded to have an income of $666,666 per year. I consider this data an outlier that needs to be removed not only because the numbers are far above the quantile, but also because the numbers look “suspicious” like data that was filled in carelessly. I remove this customer data from the dataset.
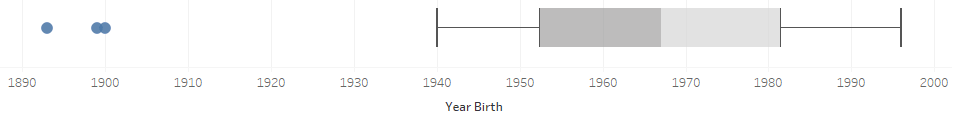
Outlier in Year of Birth
Then in the Year of Birth feature, there are customers who are recorded as born in 1893, 1899, and 1900, meaning that they are currently over 100 years old. I deleted these customers from the dataset because that is an unusual age for a human being nowadays.
Feature Extraction
Based on the metrics that have been mentioned to be displayed on the dashboard, I need to calculate the AOV and ARPC.
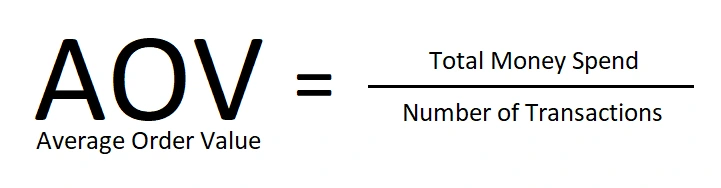
In the dataset that I use, AOV can be obtained by dividing the total money that has been spent by the number of purchases that have been made. Meanwhile, the ARPC calculation can be obtained from the total revenue divided by the number of customers. With the existing data, total revenue is seen to be valued the same as the total money spent by all customers.
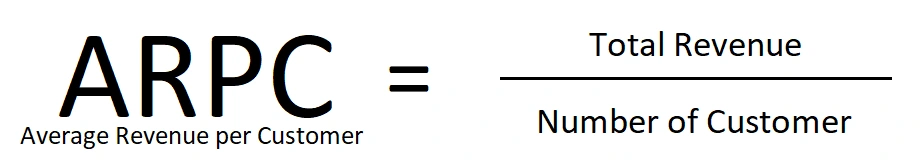
I get the total money spent per customer by adding up MntWines, MntSweets, and all the Mnts, and then I get the number of transactions per customer by adding up NumWebPurchase, NumCatalogPurchase, and NumStorePurchase.
Apart from AOV and ARPC, I also use the Conversion Rate which is obtained by calculating the number of customers who receive each campaign divided by the number of all customers. The note for this Conversion Rate is that there is no launch date for each campaign, so the assumption is that all customers receive all recorded campaigns.
The Dashboard
On the dashboard that I built, there are 4 main segments namely Conversion Rate, Customer Behavior, Purchasement Channel, and Spend on Product.
a. Conversion Rate
In the Conversion Rate section, the overall performance of each campaign is displayed along with its performance for each customer segment.
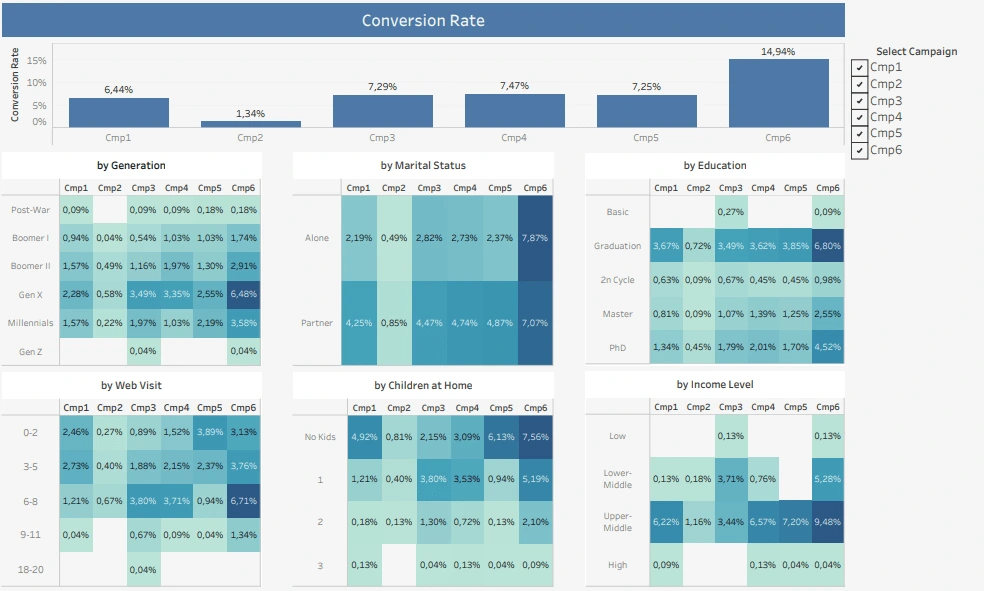
From the picture above, it can be seen that campaign6 has the best performance both as a whole and per customer segment, while campaign2 has the worst. Meaning, whatever the team did in the last campaign generally worked well and it is recommended to do it again in the next campaign. On the contrary, whatever the team did in Campaign2 didn’t work and prohibited from being used again.
Note for repeating campaign6, the team only needs to contact customers with profiles: Gen X with undergraduate education who visits their website about 6–8 times a month, lives with (at most) 1 child or none, and has a middle class income. By doing this targeting, the team will save a lot of costs from contacting customers who are likely not interested in the offers in Campaign 6.
In addition, this dashboard also shows that so far there are certain segments that are more likely to accept campaigns, namely Gen X, Having a partner, Bachelor’s degree, Not living with children, and belonging to the upper-middle income class; deduced from looking at the row that has the most dark blue cells.
b. Purchasement Channel
In this section, teams can see which segments are most likely to make purchases through certain channels. This insight can be utilized by the team to determine where certain campaigns to apply to certain segments.
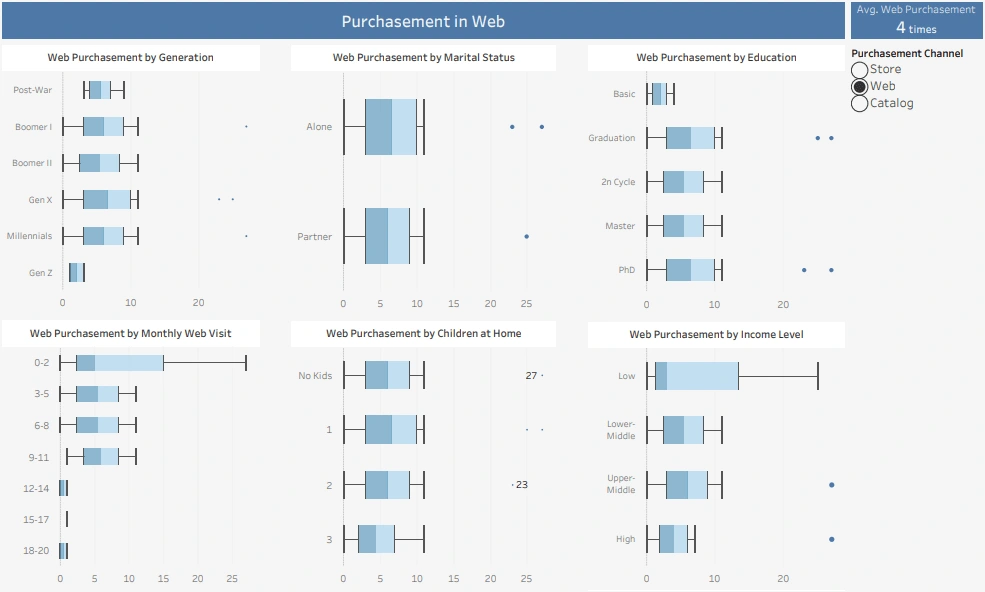
Dashboard users can filter parameters between viewing purchase data via the Web, Catalog, or Store. In the image above the filter is active for the purchase path through the Website.
From the image, what you can see is Gen X and the middle-income group are the most frequent to shop through the website, while for other groupings there is not too much difference.
One interesting insight from the dashboard shown above is that the frequency of customers visiting the website is inversely proportional to their purchases through the website. This might happen because only customers who shop through the website already know what they are looking for, so they shop immediately when they access the website.
It’s contrast from those who frequently visit websites, maybe they just like to look around or have an interest in a product but are still delaying a purchase. In response to this, website developers can make personalized product recommendations or personalized deals according to website visitors’ interest in certain products, so as to encourage them to make purchases immediately.
c. Spend on Product
This section shows the total spend of each segment on a certain type of product.
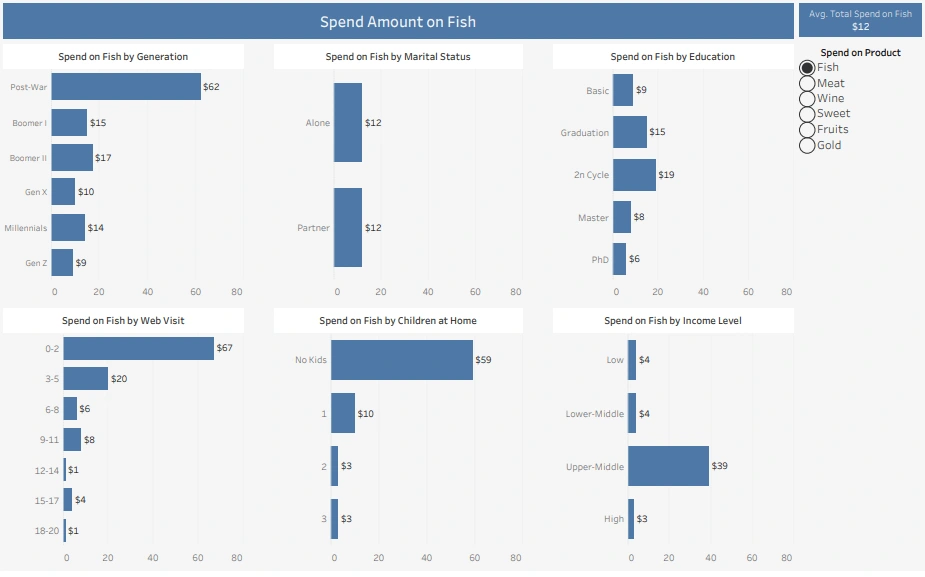
The marketing team is able to filter parameters between viewing product type as Fish, or Meat, or Wine, etc. In the image above the filter is active for total spending on Fish.
We can easily see which segments buy the most fish, namely the Post-War Generation, those who don’t live with children, those who rarely even visit websites, and those with upper-middle class incomes. These segments are suitable for further targeting marketing campaigns when it comes to fish products.
d. Customer Behavior
This section shows the metrics and behavior of each segment.
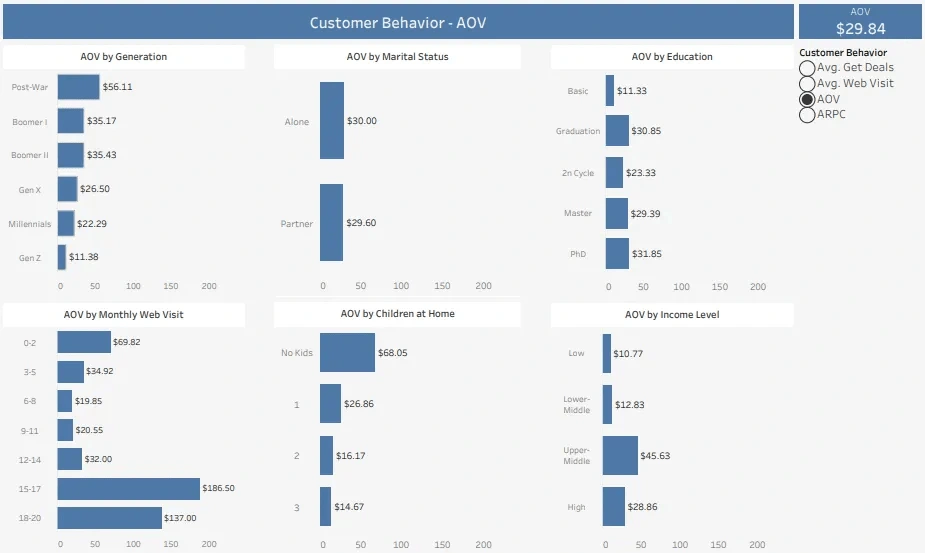
AOV is the average amount of money a customer spends in one transaction. AOV calculation can show performance in selling goods at high prices.
Based on the frequency of website visits, the highest AOV is generated by customers who visit very often. Even though they very rarely make purchases on the website, it turns out that they are the most profitable customers and this shows that they tend to shop in large amounts in a transaction. This can be followed up with personalization as I previously stated.
In the other groupings, again, the Post-War Generation, Not living with children, and Upper-Middle Income show the highest rates. For No Kids and Upper-Middle Income maybe this is related to their tendency to take various campaigns that are offered. The anomaly here appears in the Post-War generation which does not appear to receive marketing campaigns often but contributes the highest nominal transaction figures compared to other generations.
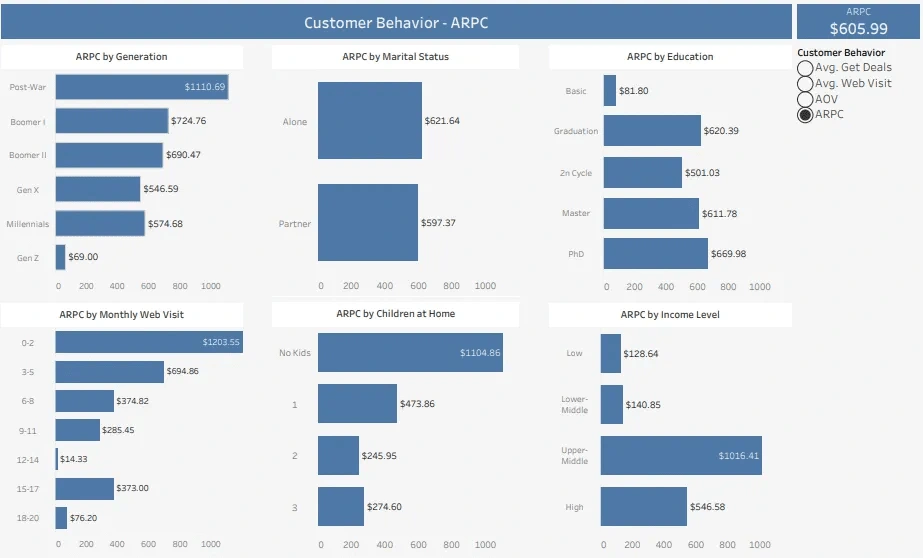
Almost the same thing appears when ARPC metrics is displayed, except for those who visit the website very often. This shows that this segment does not make transactions very often, but it is a large amount once they make a transaction. It’s different with those who very rarely visit websites (0–2 times) where their AOV is not that high while the ARPC is very high, meaning they consistently make transactions with relatively large nominal values. This shows their loyalty.
Here the Post-War generation again shows a very high number compared to other generations. The same goes for No Kids and Upper-Middle Income. The new thing that appears is that all segments based on education tend to produce high revenue except for Basic Education.
This dashboard will be very useful in preparing programs and targets for subsequent campaigns. The marketing team can target certain product through certain purchasing channel to the most loyal segments so that they can increase their nominal per transaction. Again, specific targeting like this will greatly cut marketing costs that usually need to be spent.
If you are interested in trying it, you can access the dashboard here.
Like this project
Posted Sep 30, 2024
a Customer Analysis
Likes
0
Views
2