Financial Dashboard & Data Insights Financial
Sunday David ARAOTI
Financial Dashboard & Data Insights
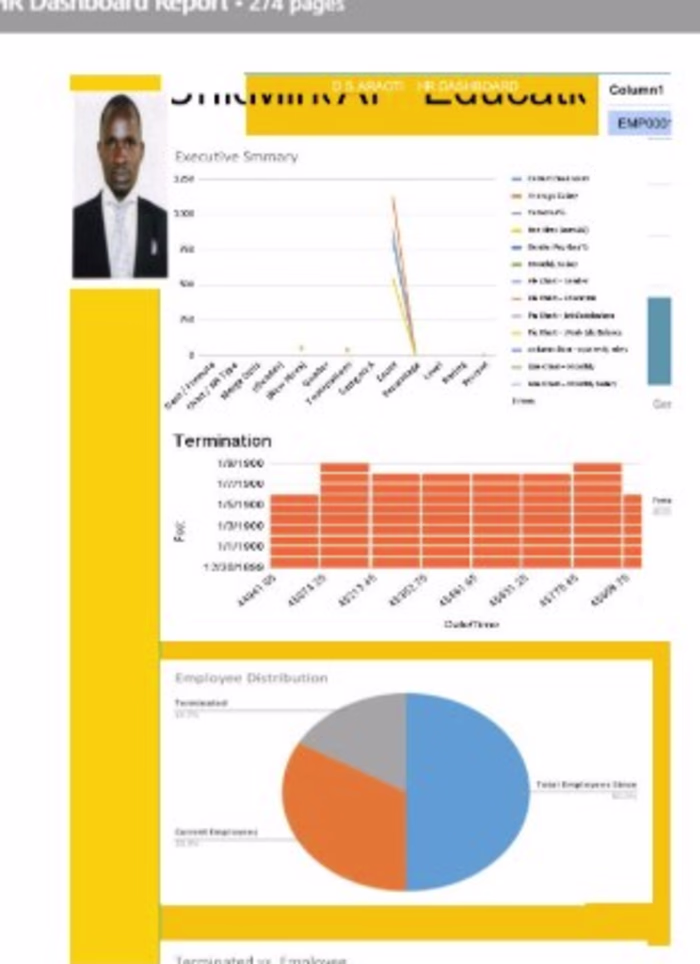
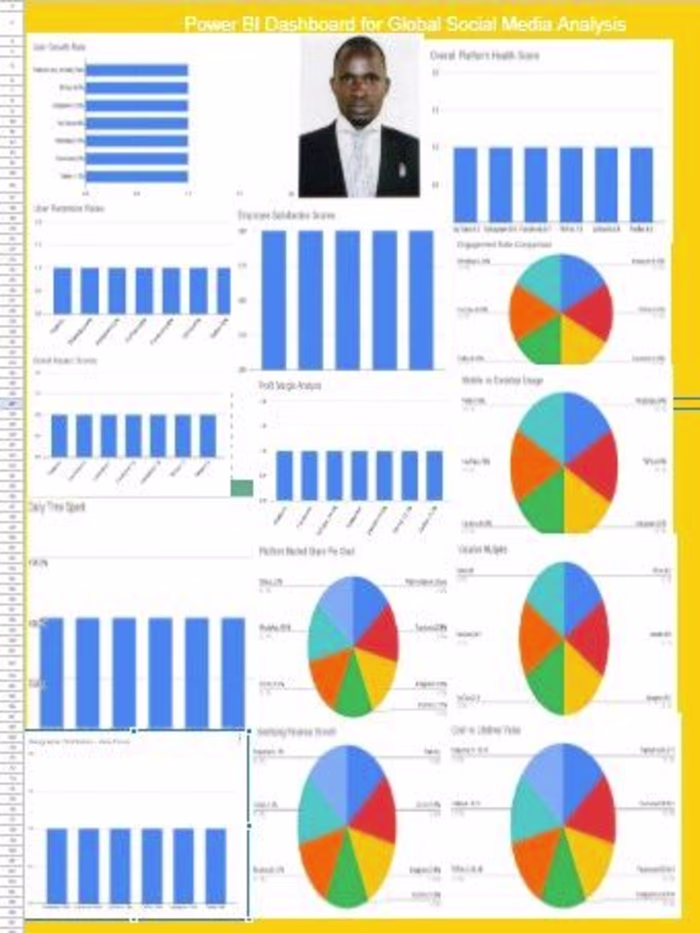
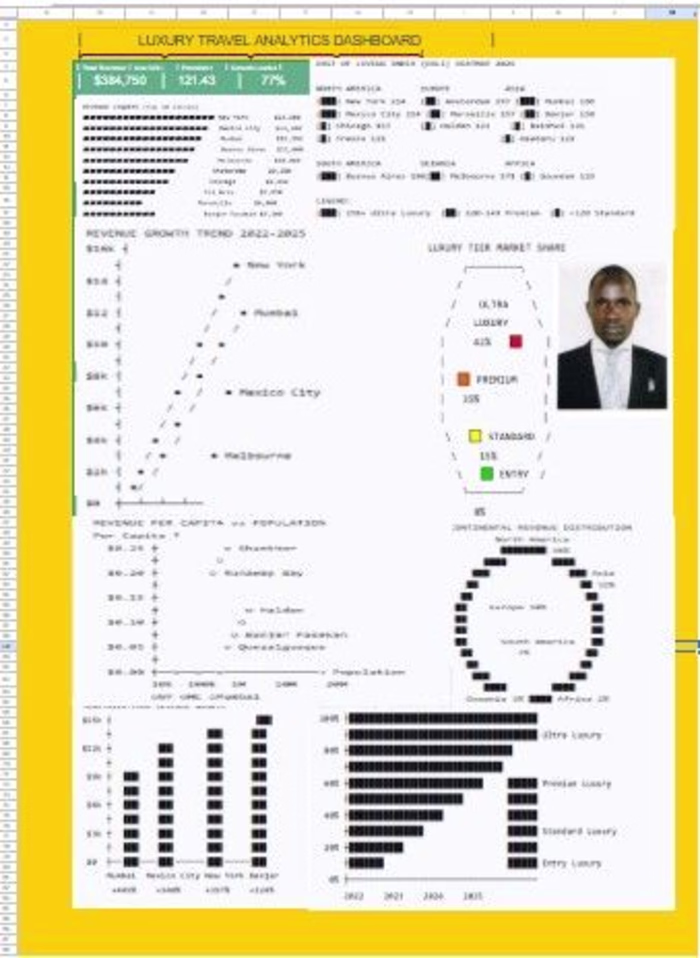
Financial Performance Dashboard (Excel / Power BI)
Description:
I developed an interactive financial dashboard that transforms raw financial data into clear, actionable insights. This dashboard enables businesses to monitor revenue, expenses, and profitability trends in real time, supporting faster and smarter decision-making.
What it includes:
Revenue & expense tracking
Profitability analysis
Trend visualisation (monthly & yearly)
KPI summary (growth, margins, performance)
Tools Used:
Microsoft Excel / Power BI
Outcome:
Improved financial visibility and helped identify key growth and cost-saving opportunities.
Like this project
Posted Apr 30, 2026
Financial Dashboard & Data Insights Financial Performance Dashboard (Excel / Power BI) Description: I developed an interactive financial dashboard that tra...