KPI Sales Dashboard
Nahom Tsehaye
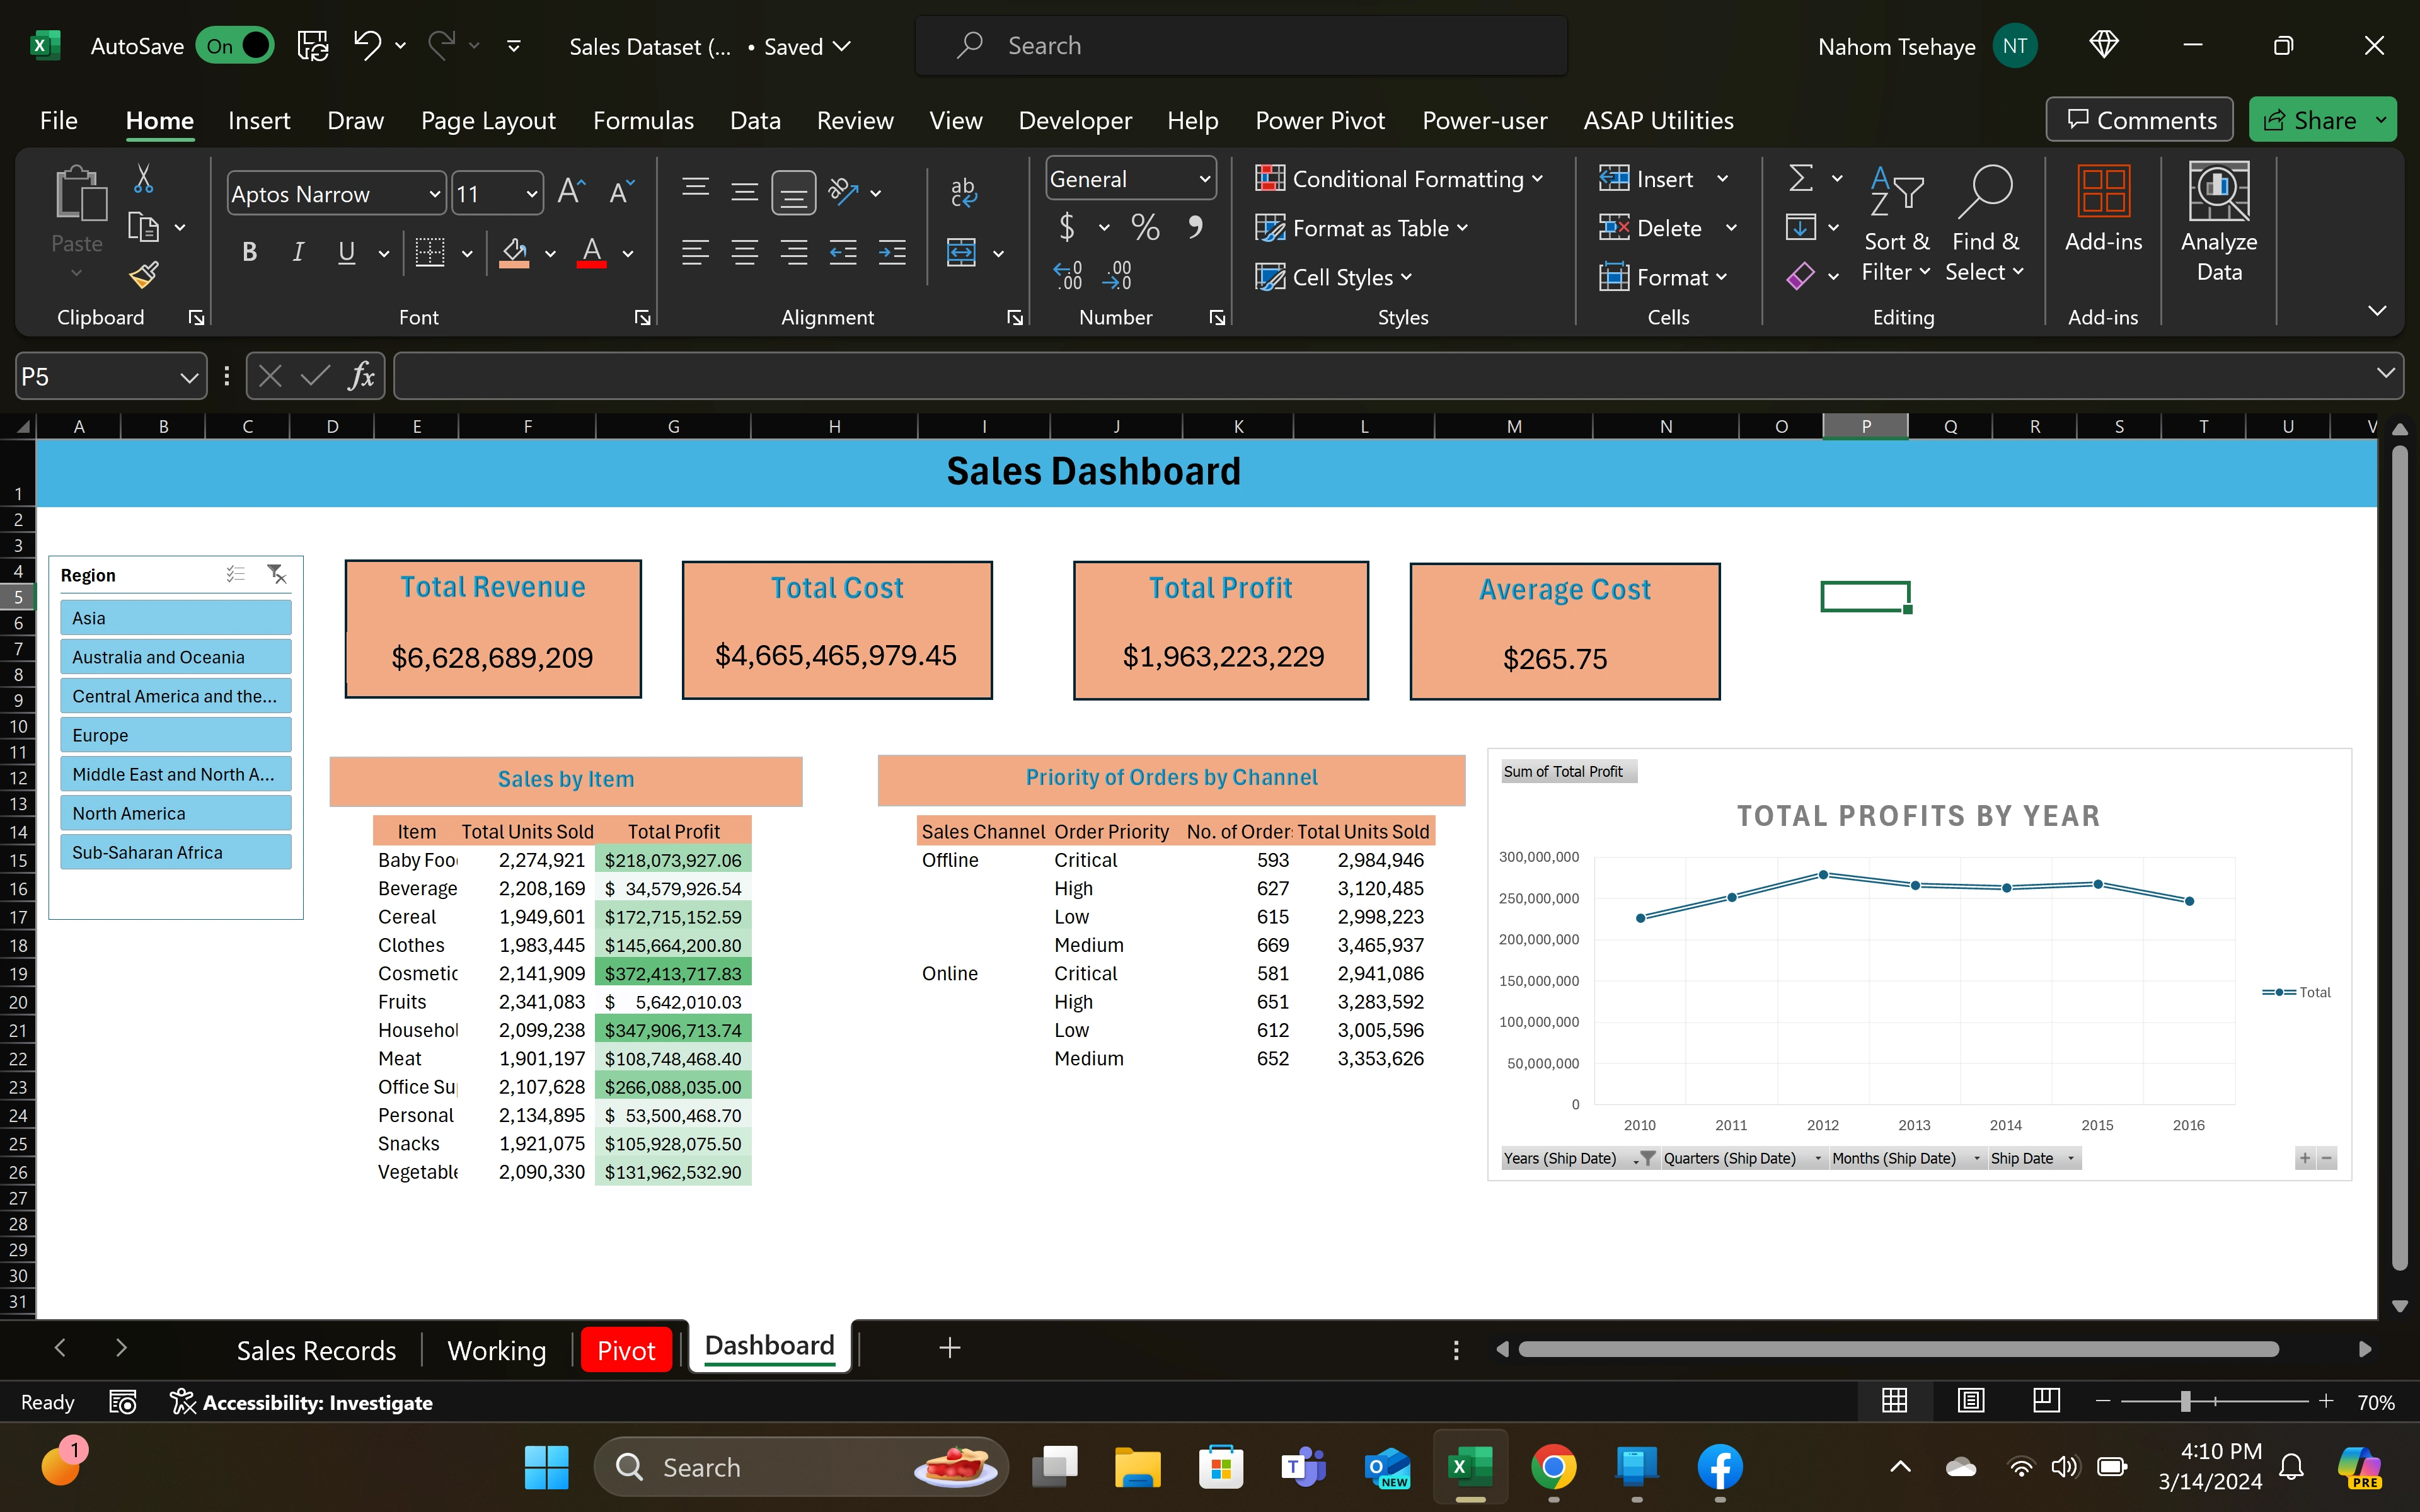
KPI Dashboard
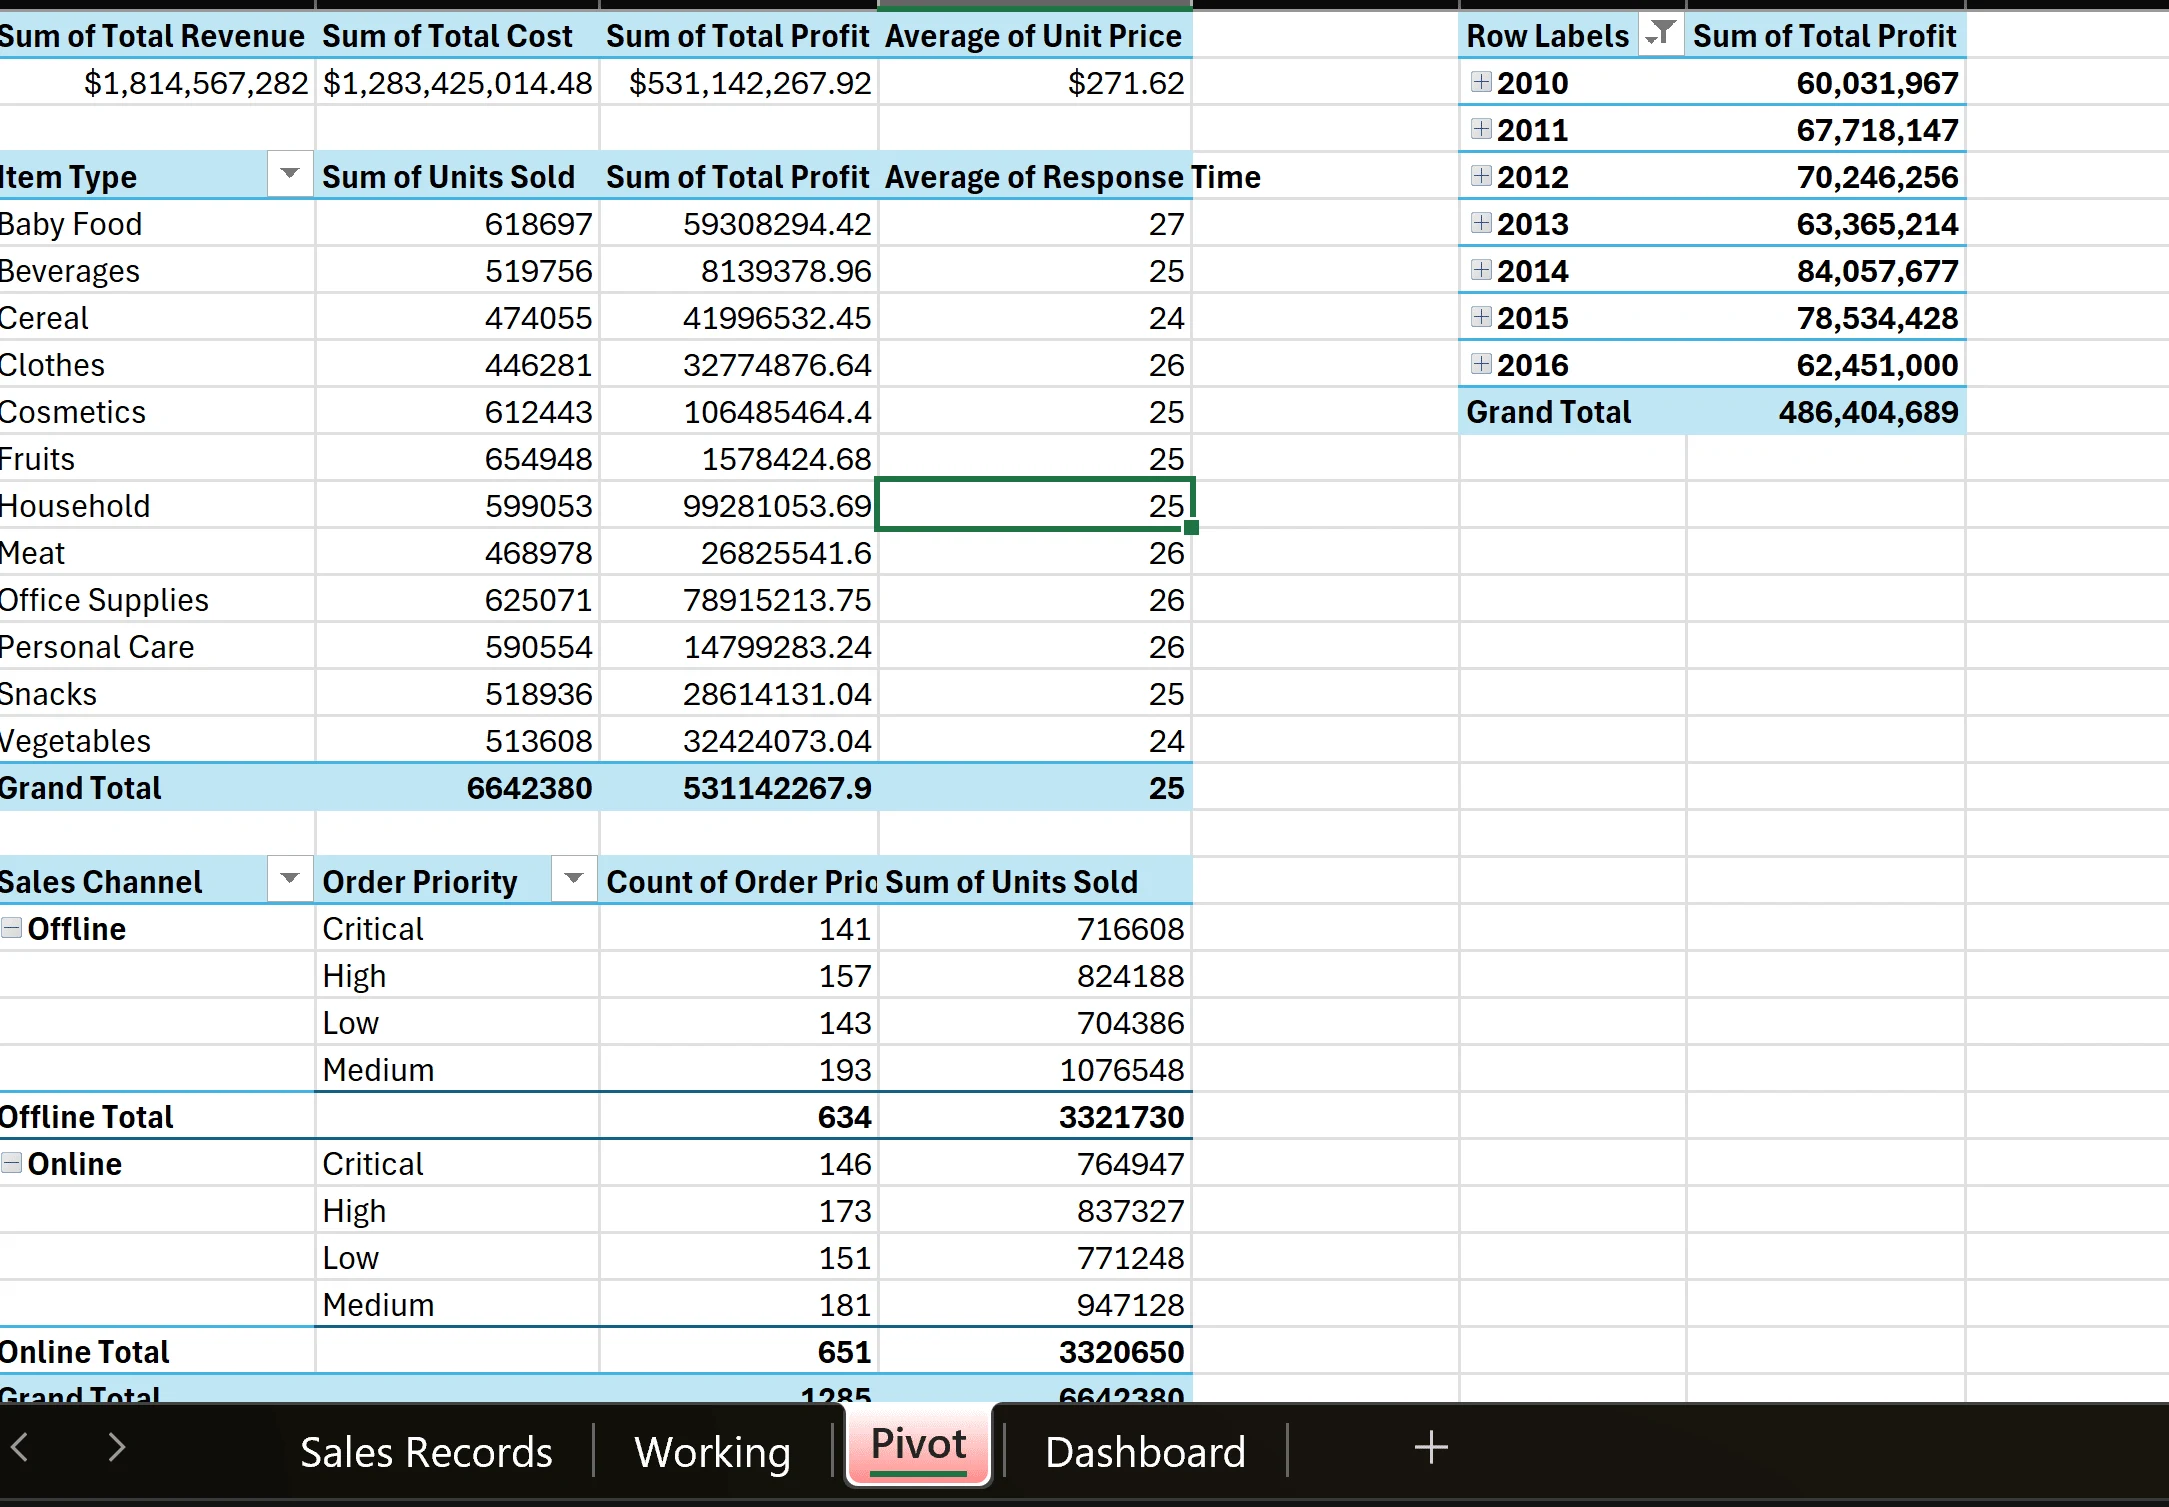
Pivot Tables
Like this project
Posted Mar 23, 2024
An Excel Sales Dashboard that displays the KPI's of necessary, common items per region. It is used to help make informed decisions based and understand trends.
Likes
0
Views
23