Nahom Tsehaye - Nahom Tsehaye | Contra
Work by Nahom Tsehaye
Sign Up
Post a job
Sign Up
Log In
Nahom Tsehaye
Nahom Tsehaye
Message
Follow
Ready for work
Nahom is ready for their next project!
Virginia, USA
Work
Services
About
Virginia, USA
0
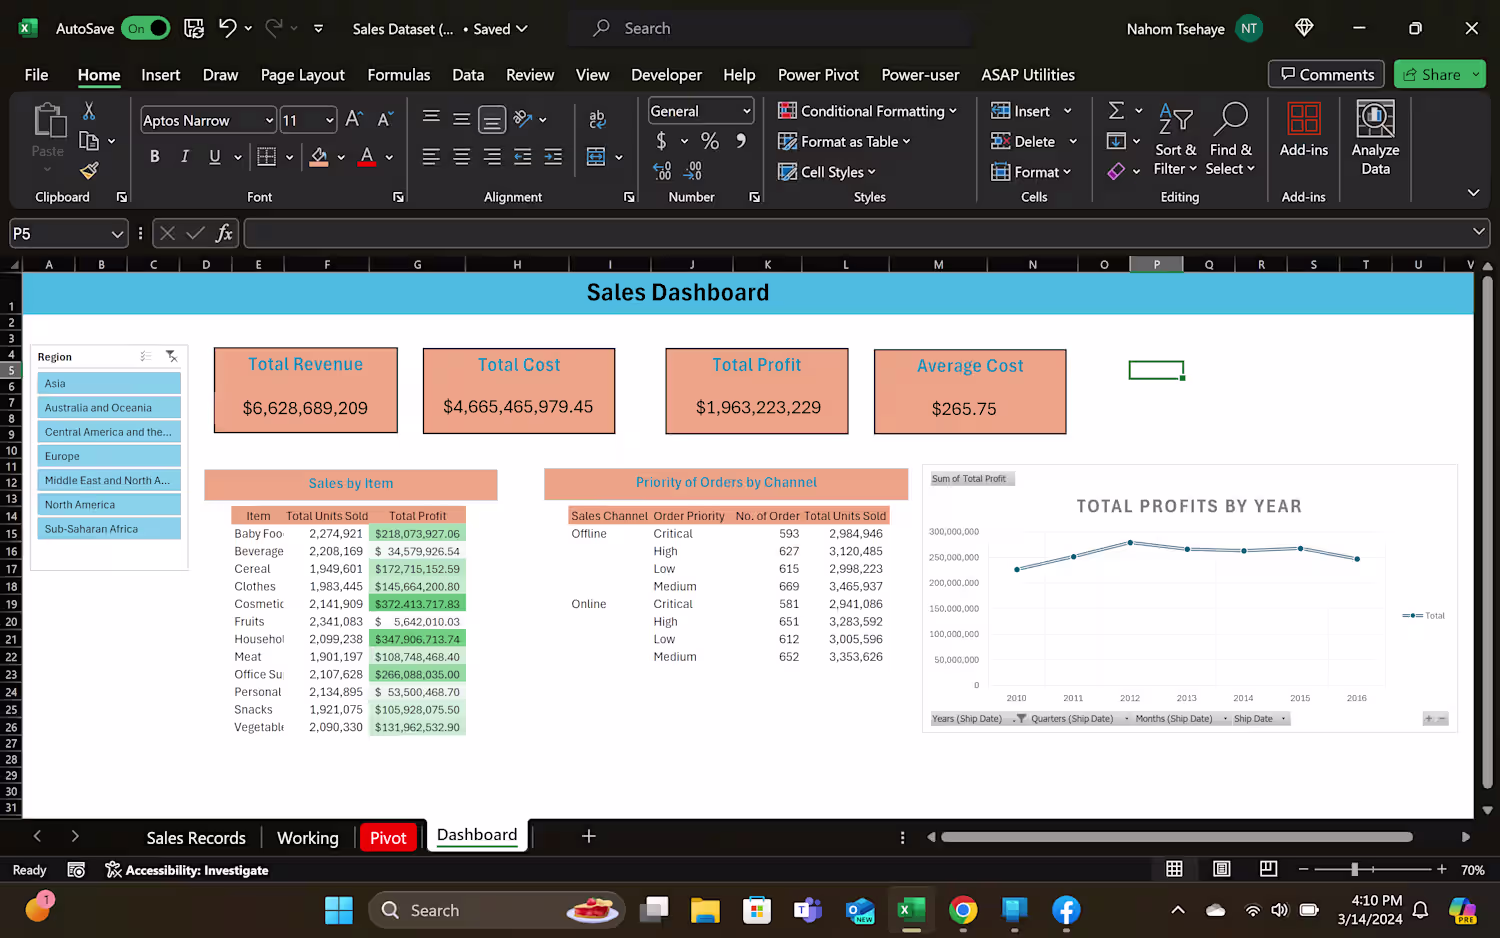
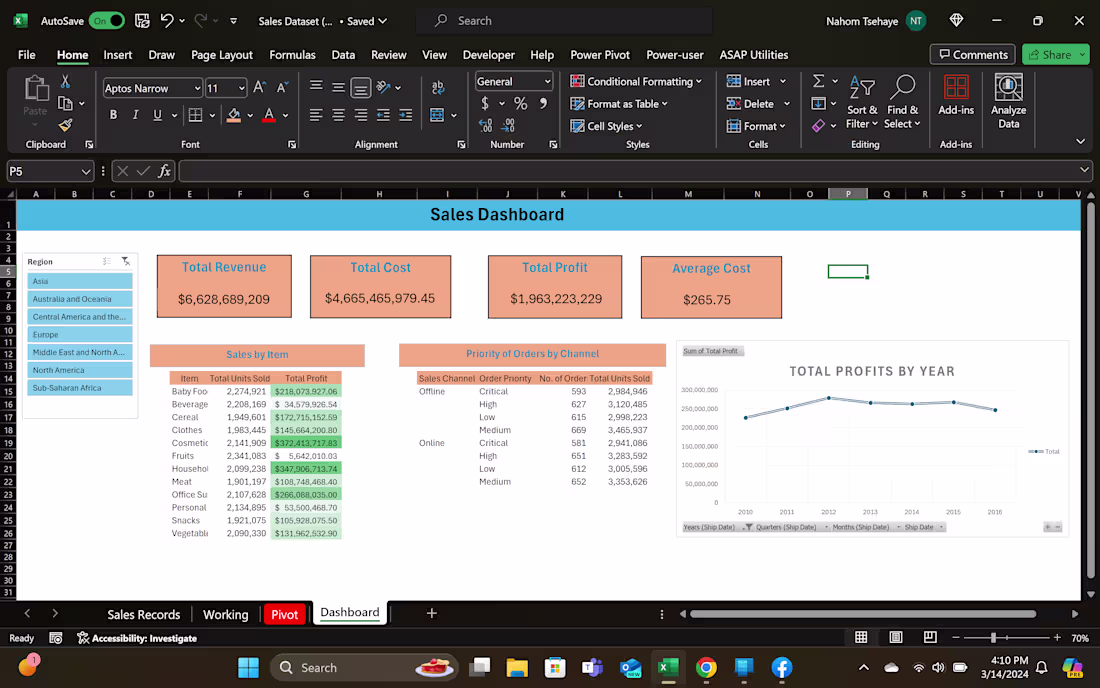
KPI Sales Dashboard
0
23
0
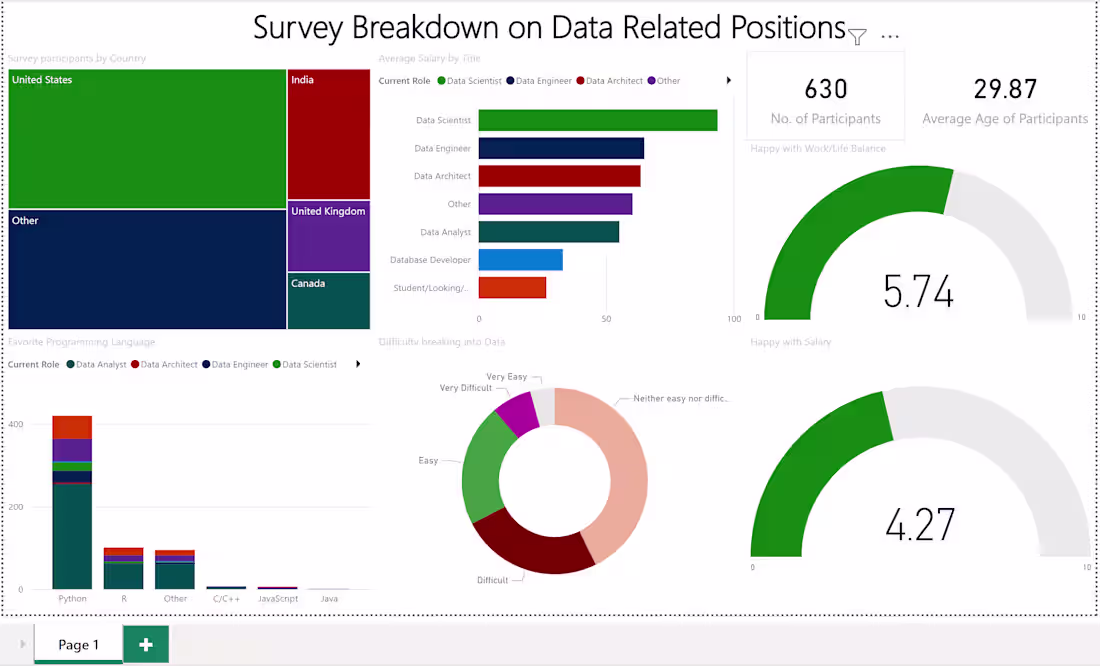
Survey Analysis - Power BI Dashboard
0
12
0
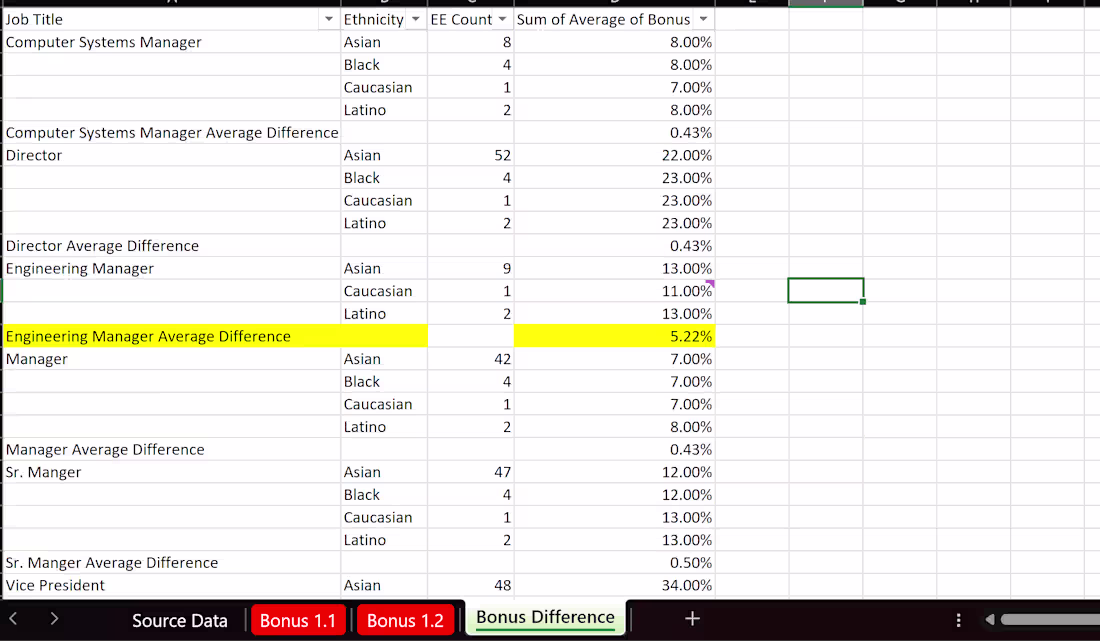
Data Investigation - Bonus Variance Analysis
0
14
0
Managed Payroll Carrier Change - iSolved to ADP
0
6