RootLogic App — Handsfree Growing
Cecilia Weissbein
RootLogic is a product that aims to enhance plant growing experiences in indoor environments by providing an electronic device plus a mobile application that gives users independent, continuous and remote control over their plants’ conditions.
Research
When the product owner came to me, he had already done some informal research over the issue, so I had an idea of user problems and needs. Later on, I conducted interviews with five potential users and got to the following conclusions:
People who grow find the activity gratifying and pleasant.
Most people living in cities spend a lot of time out of their house.
The resulting feeling after plants die or get sick because of lack of care is frustration.
People wish they could run their loaded agendas and continue to grow as well.
Personas — getting to know users
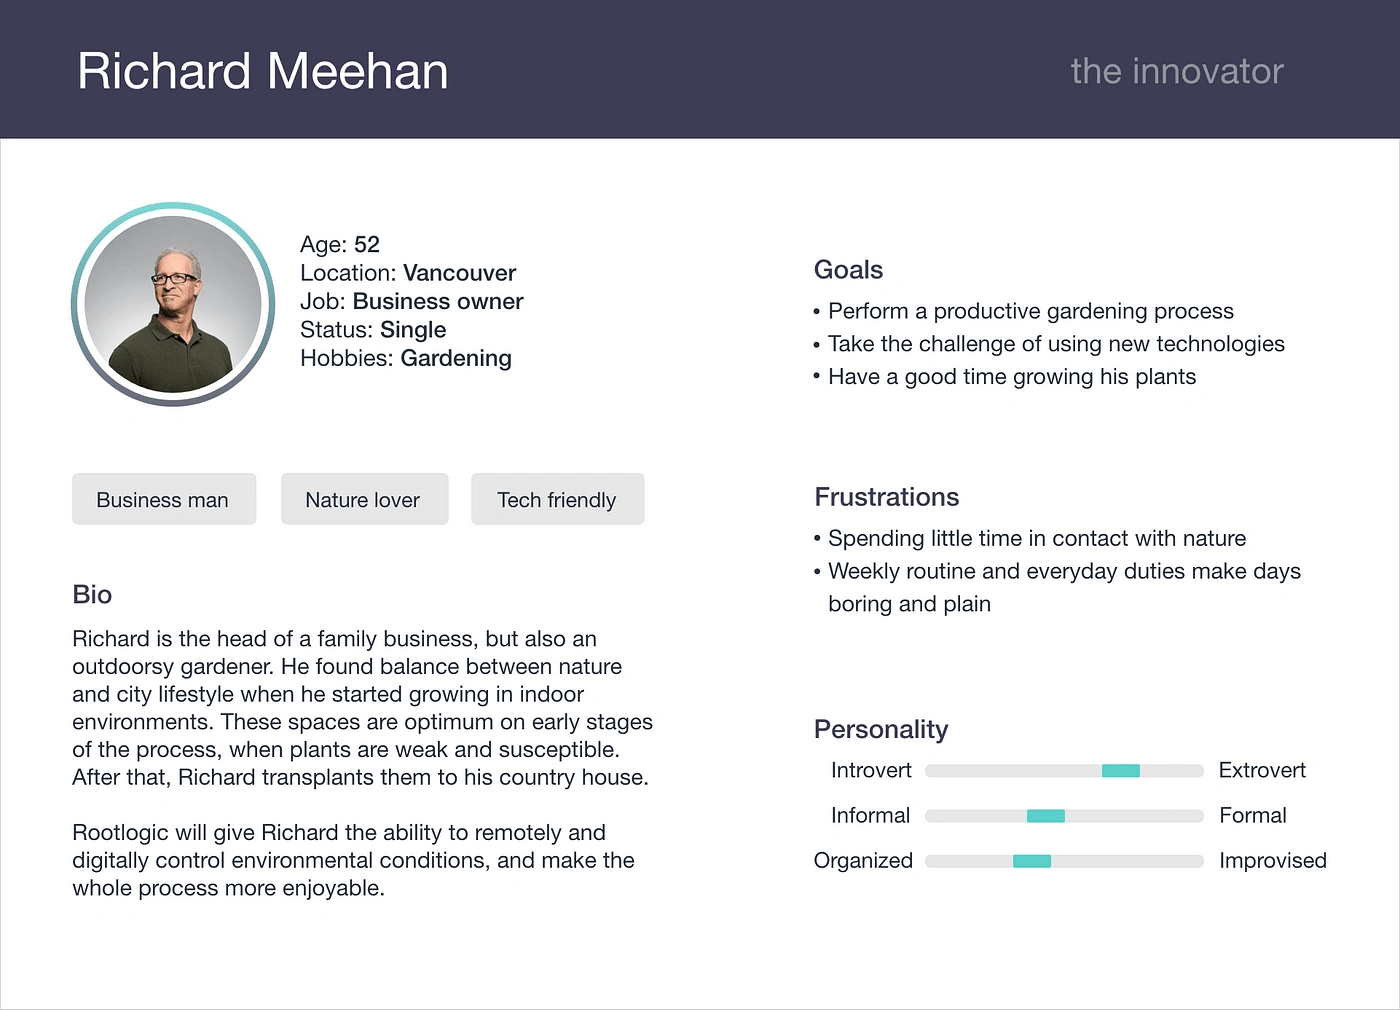
A primary and a secondary persona were created, in order to portray the spectrum of user needs, wants, and issues:
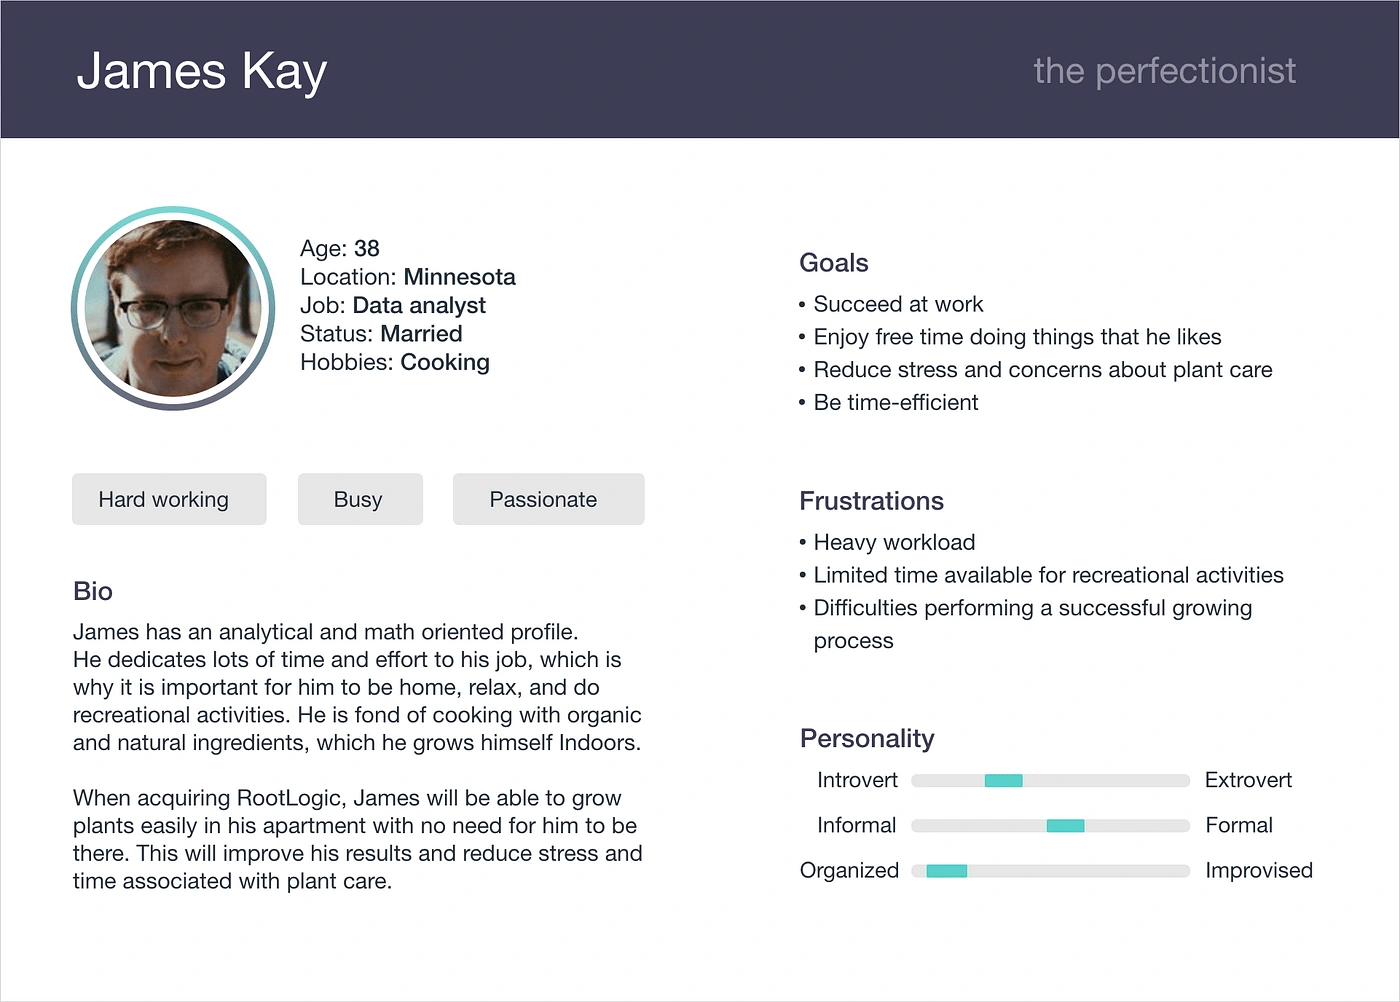
Two Personas were created for a simple reason: The main problem of RootLogic users is associated with a lack of time (Primary Persona). The Secondary Persona includes other issues solved by RootLogic.
Planning
Agreeing on product requirements is a key step to start a design process, RootLogic requirements determined the following product features:
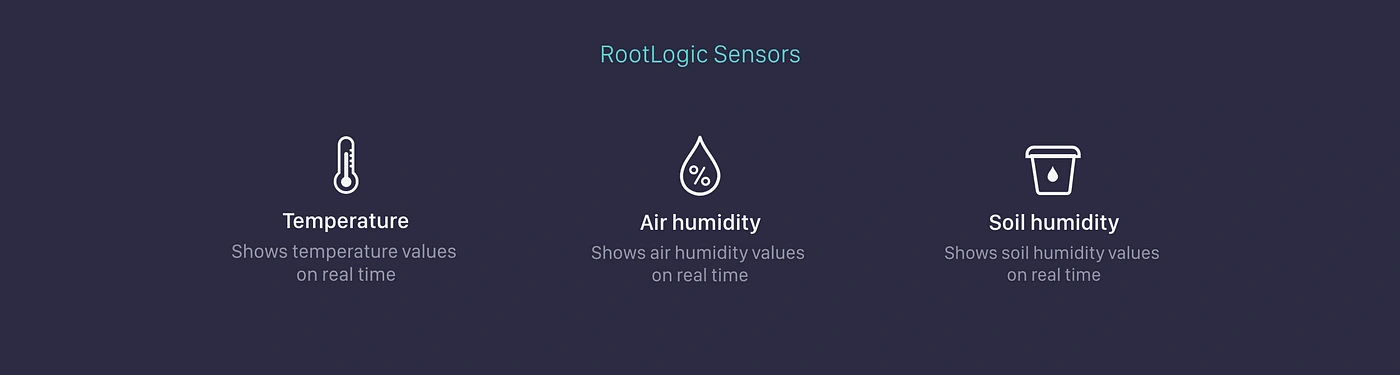
Show temperature, air humidity, and soil humidity values in real-time.
Show graphics that portray the oscillation of weather variables along time (days, weeks, and months).
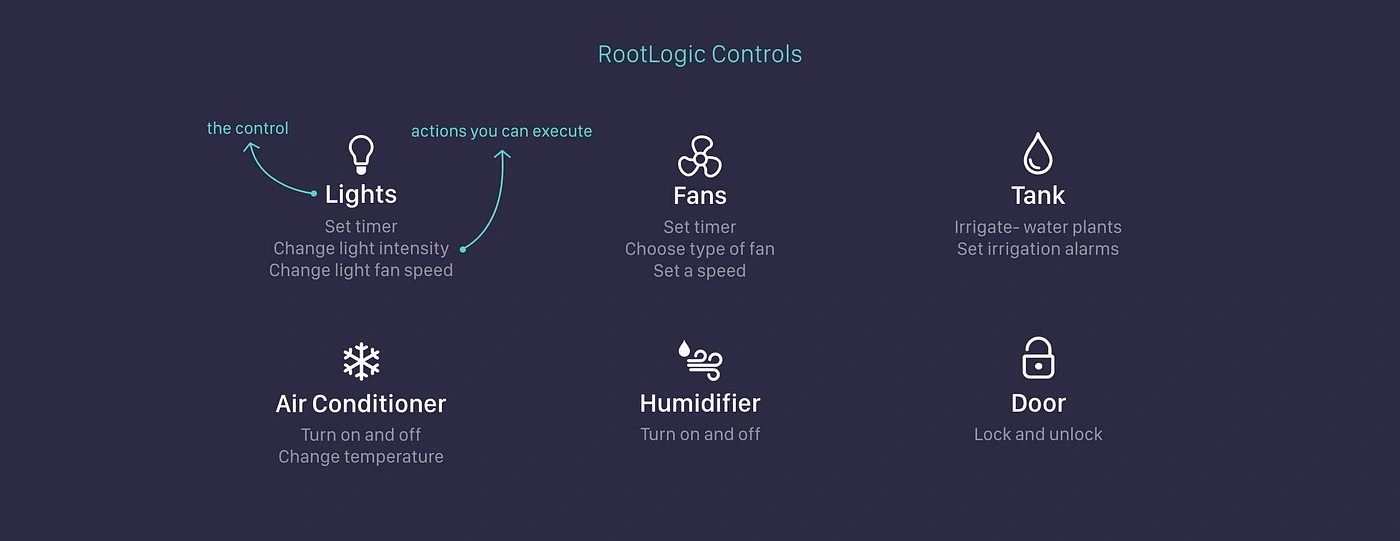
Allow the remote control of six components: Lights, Fans, Tank, Humidifier, Air conditioner, and Door.
Notify users when weather variables surpass certain limits.
Allow the setting of irrigation alarms (these are reminders to water).
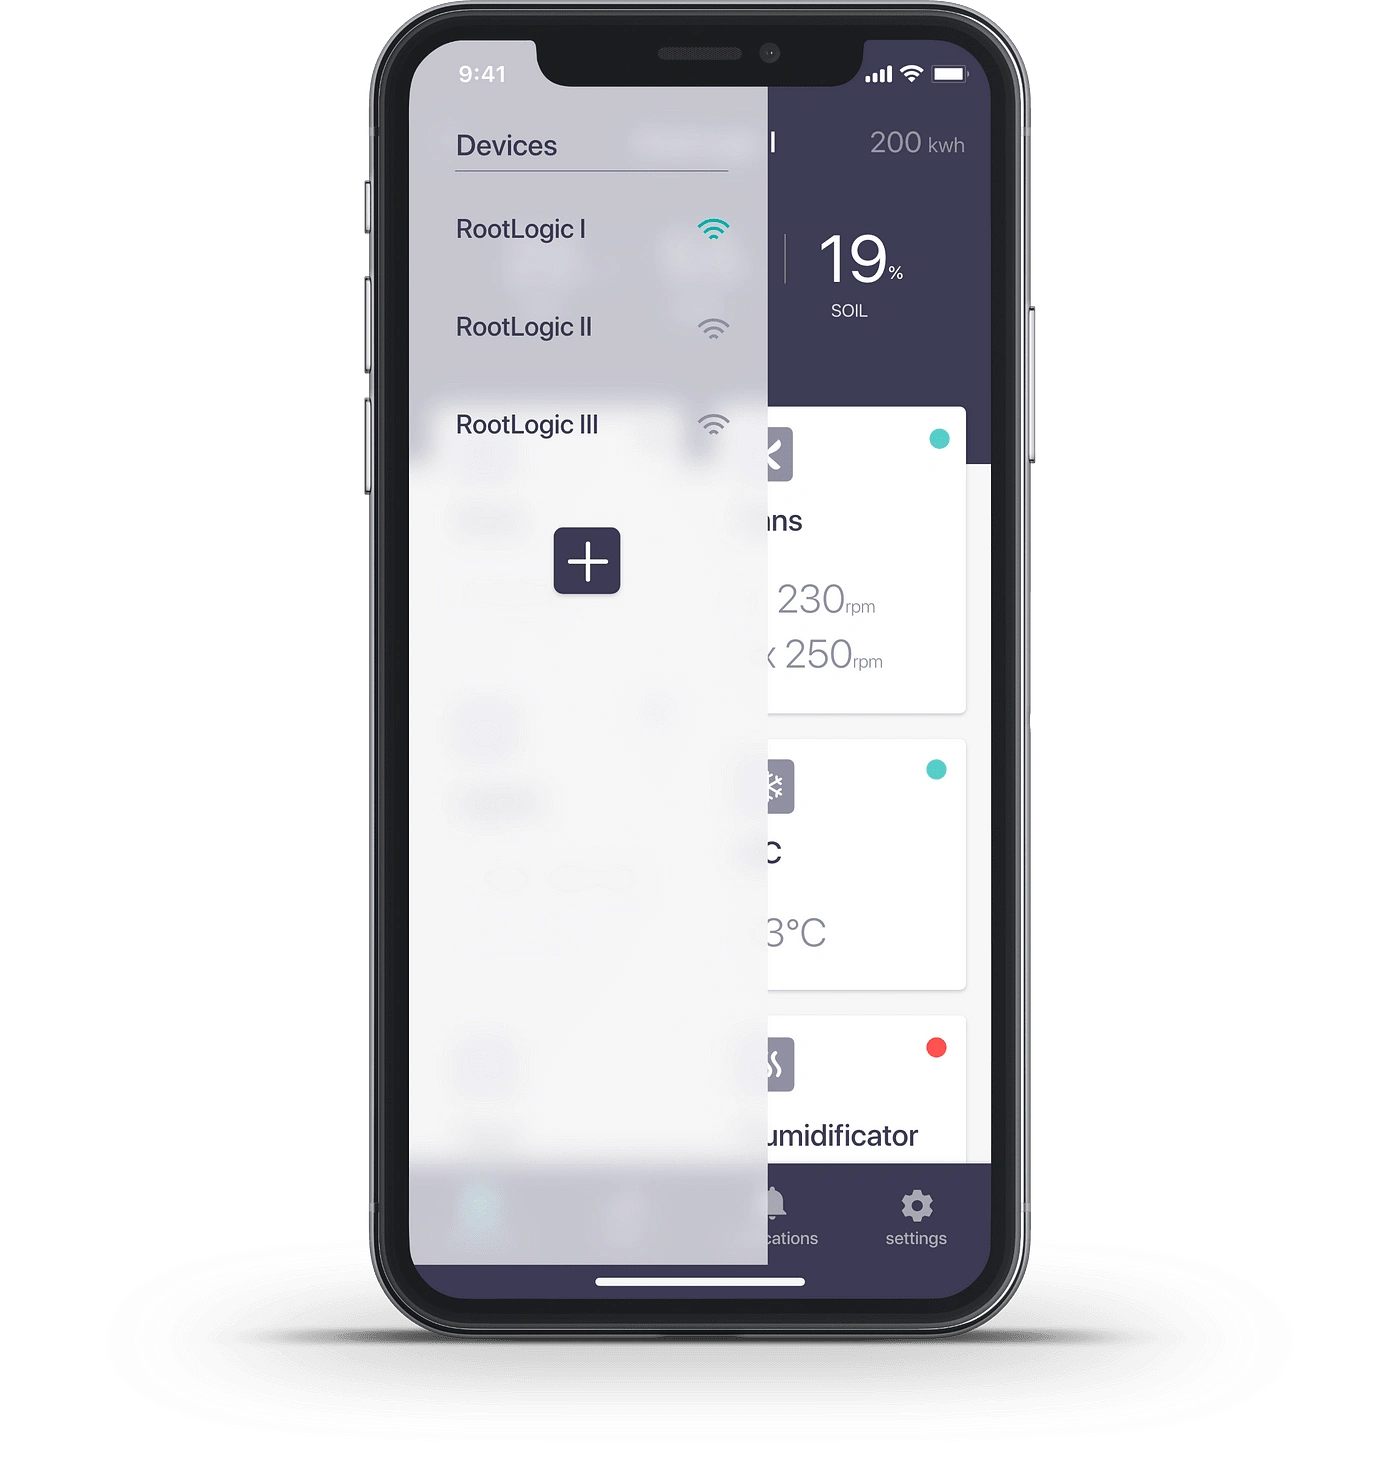
Allow users to use multiple devices.
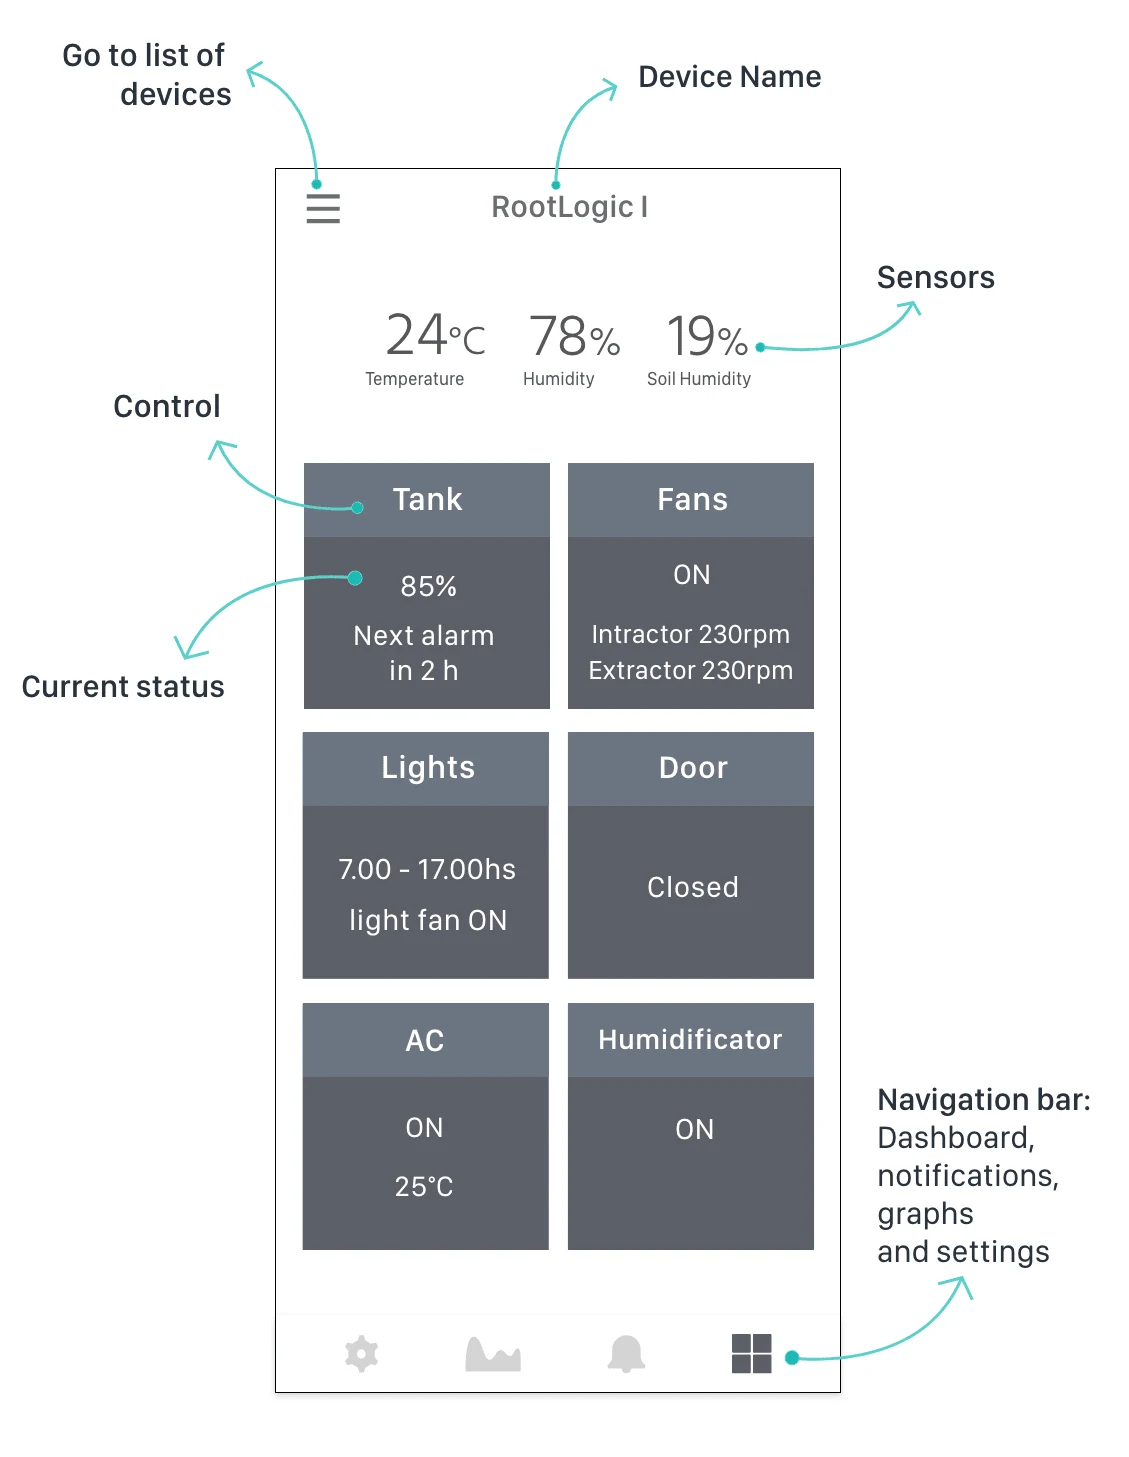
Let’s go visual for better understanding. The different device sensors are seen below:
Also, all of these data measurements are collected and shown in time graphs. Therefore, users can see daily, weekly and monthly fluctuations of weather variables and can have a picture of the long term conditions of their plants. This makes it easier to determine the cause of diseases, plagues, and plant performance.
RootLogic also enables users to execute actions that modify weather conditions and make them optimum for plant growth. This is made with the following controls:
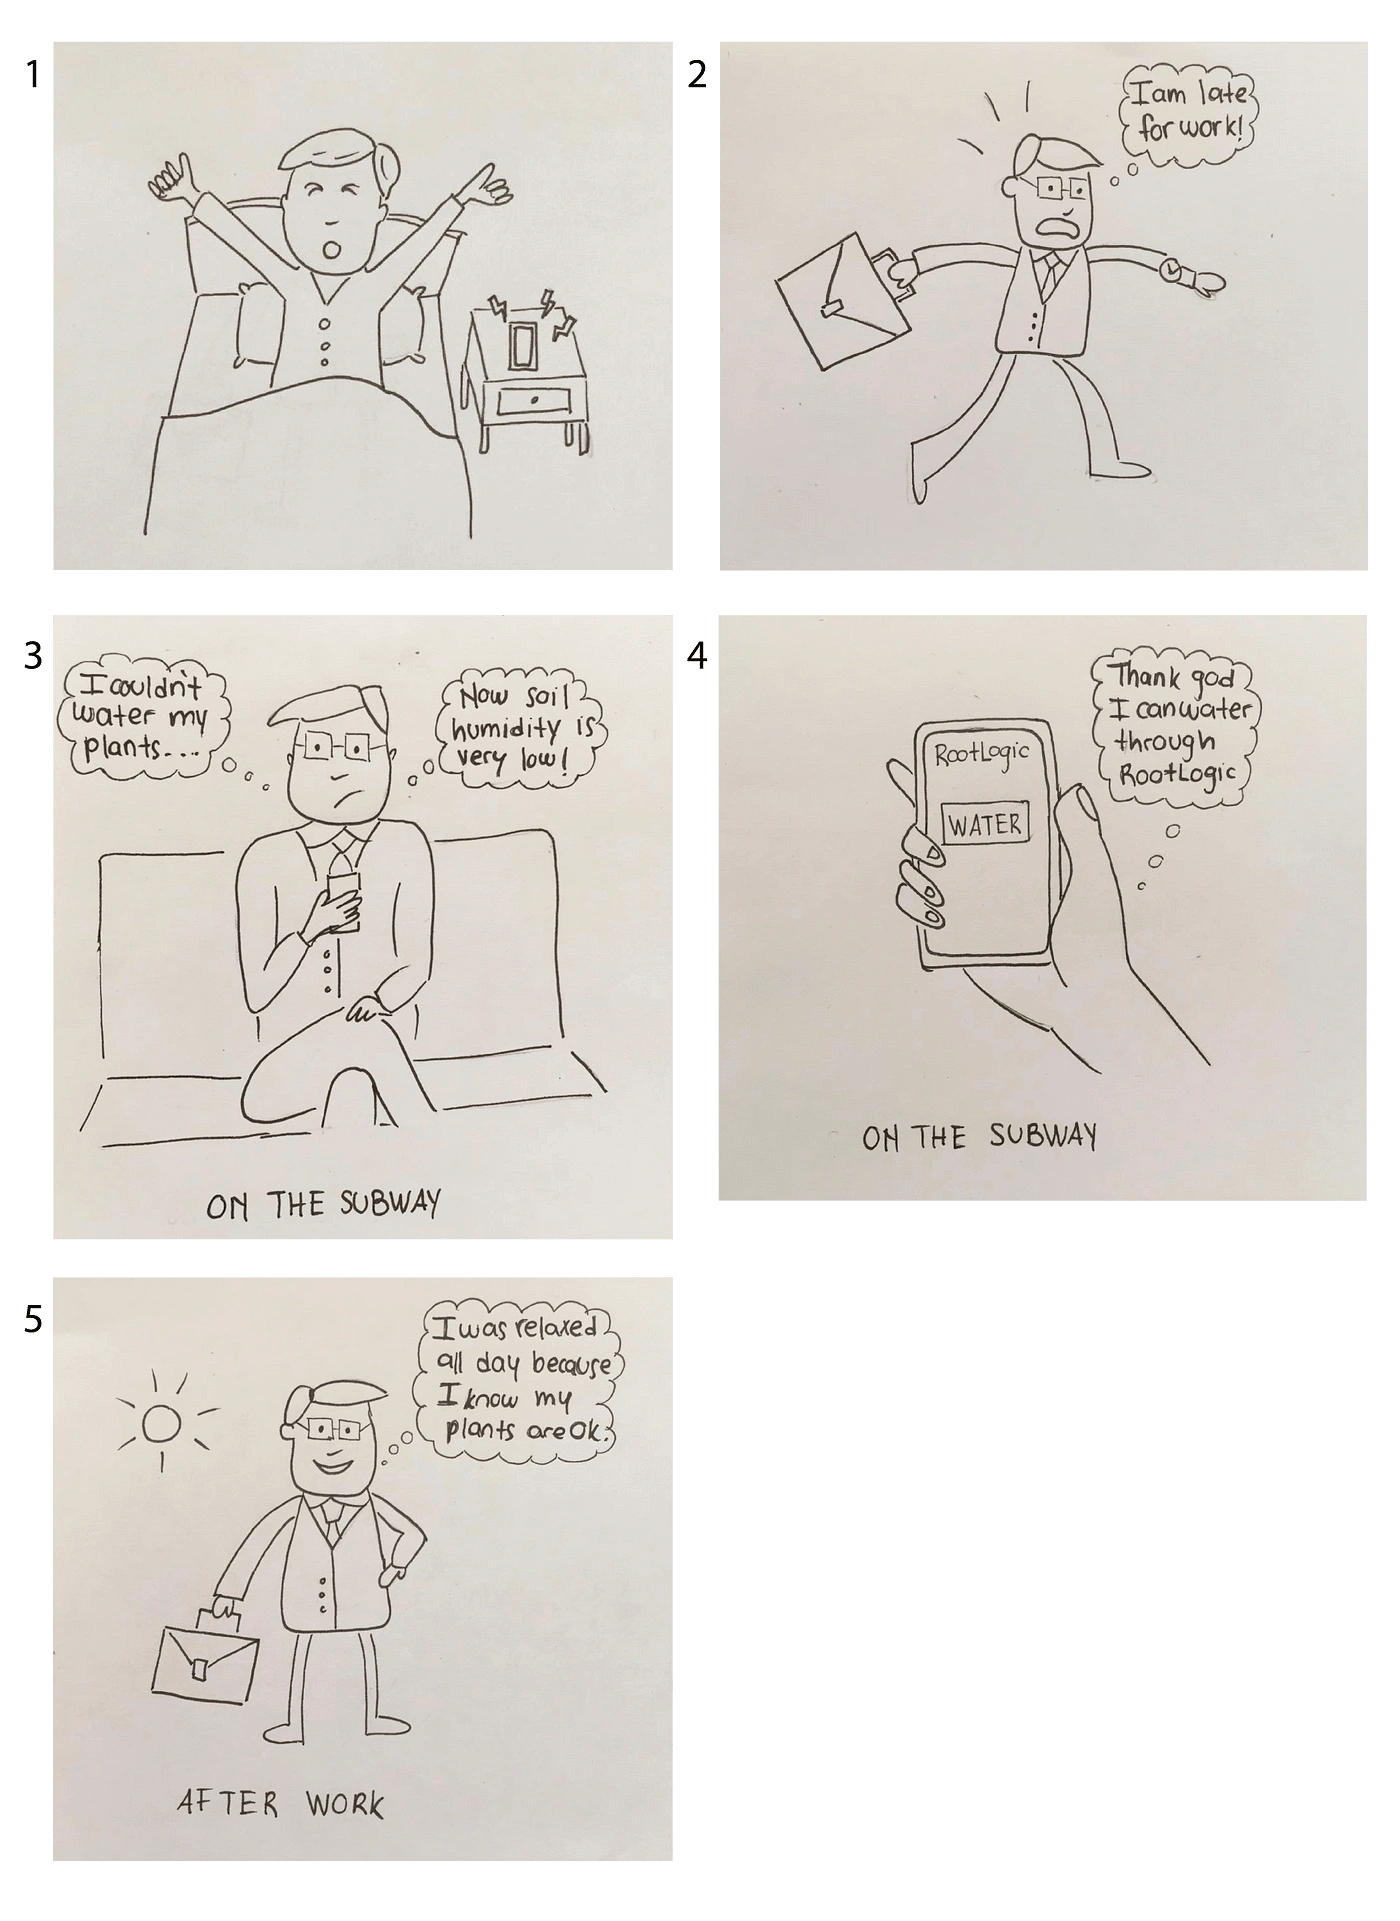
Use Case
James is unable to water his plants at home, but he can solve this issue with RootLogic. The scene where he uses the App is a typical one of mobile devices: on the subway, in changing and rushing environments, or in the hustle and bustle of the city. A lot of distractions affect the mobile experience, and this was one important thing I had to have in mind when designing this App.
Design
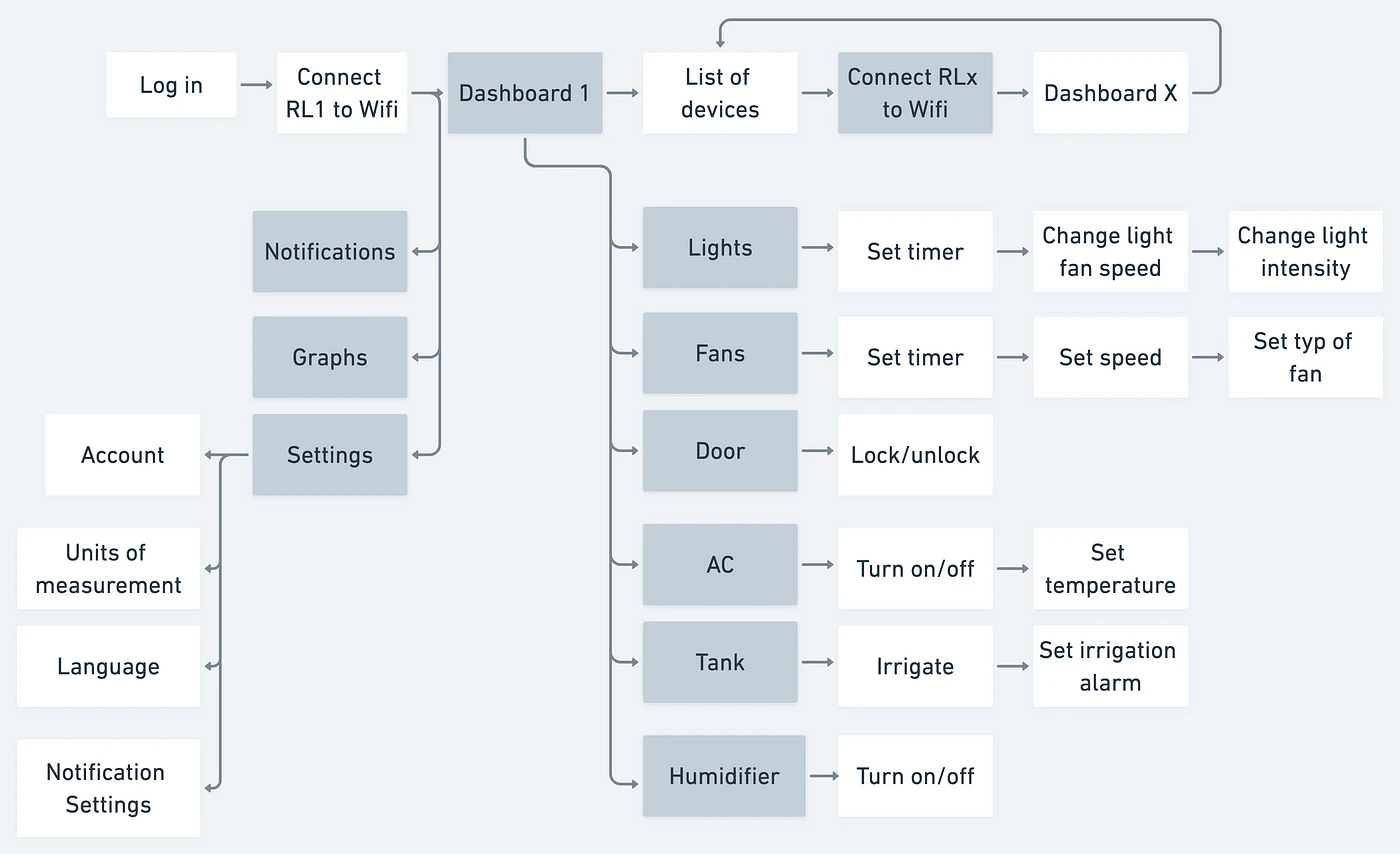
1) Site map
At first, a sitemap was created to understand the way the user would move through the App:
2) Low Fidelity Prototype
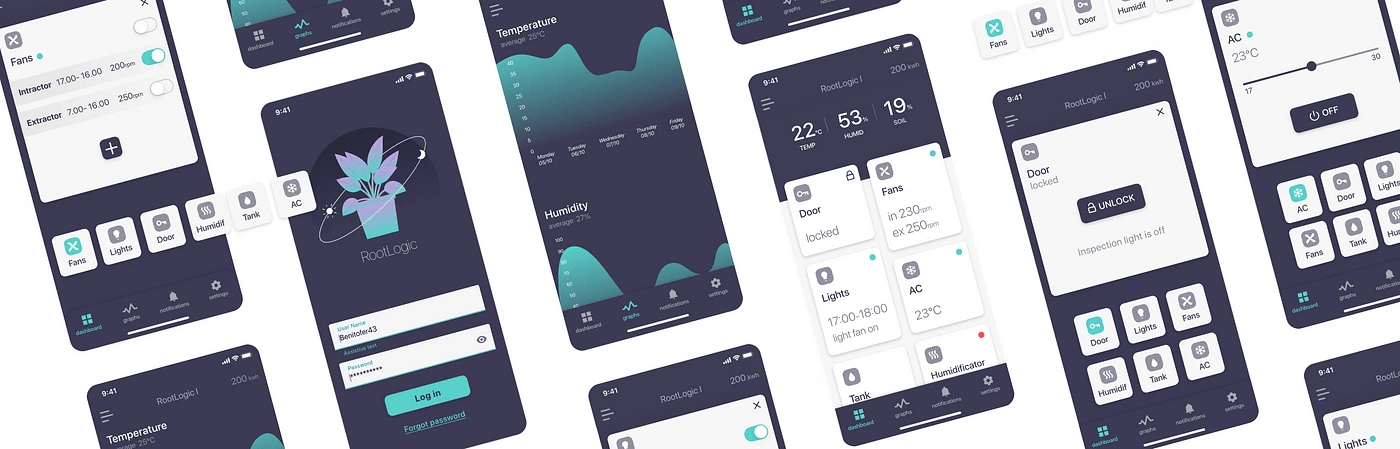
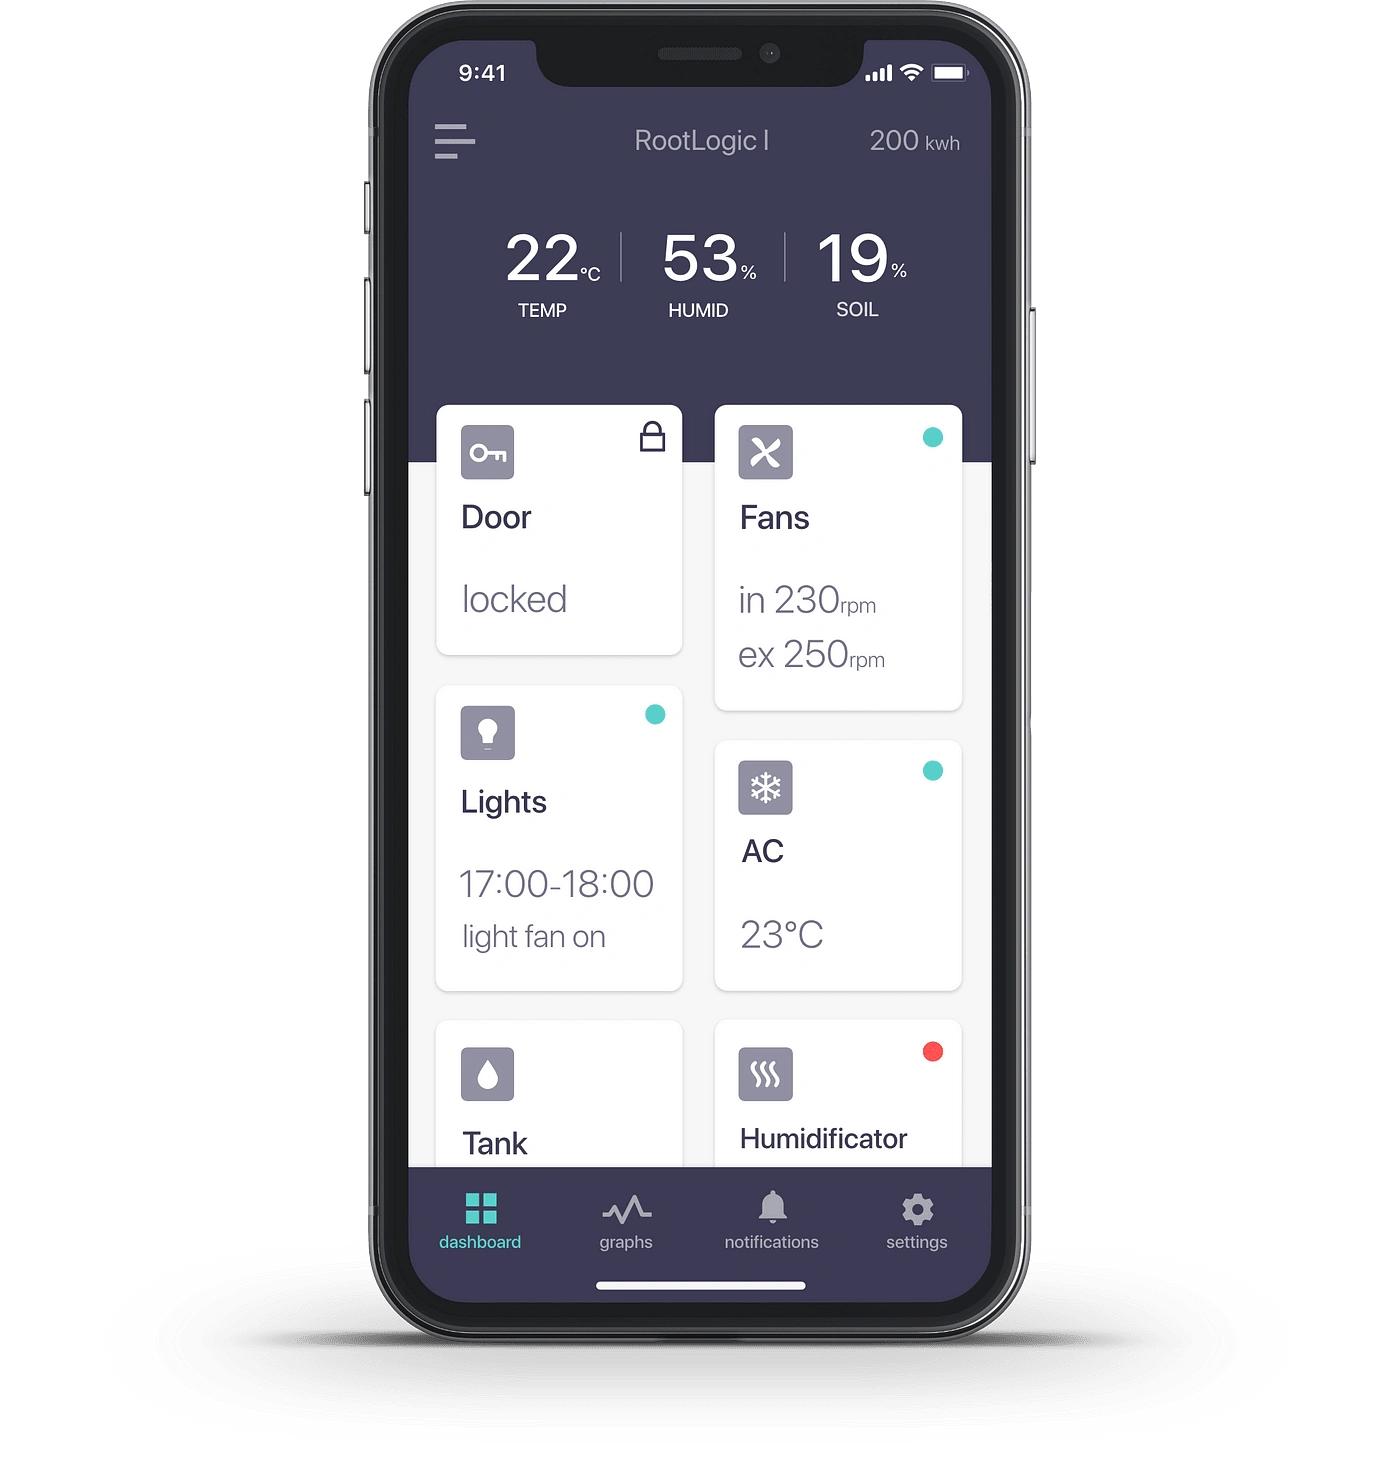
I decided to face RootLogic design with a dashboard as the main screen, which will show the value of weather variables in real-time and the current status of every component.
An important point of dashboard design is that, at a quick glance, users have to be able to know what is going on. Since its function is informative, no changes or actions are executed on the dashboard. To do this, each control has an individual screen.
3) Testing
A usability test took place to evaluate the LoFi Prototype. Users were asked to perform tasks and the rate of success was measured. During the test, they were also asked to express their feelings and thoughts out loud. Feedback was useful to define:
Icons: the dashboard layout was understood, but there was a general agreement on the fact that icons would allow faster recognition of components. People were asked which icons they associated with each component, and this feedback helped to make icon selection in HiFi stages.
Wording: I confirmed that words used in the app were understood (For example AC, Tank, etc).
Navigation: the navigation bar remained unchanged but the way of getting to the list of devices changed. This is shown below:
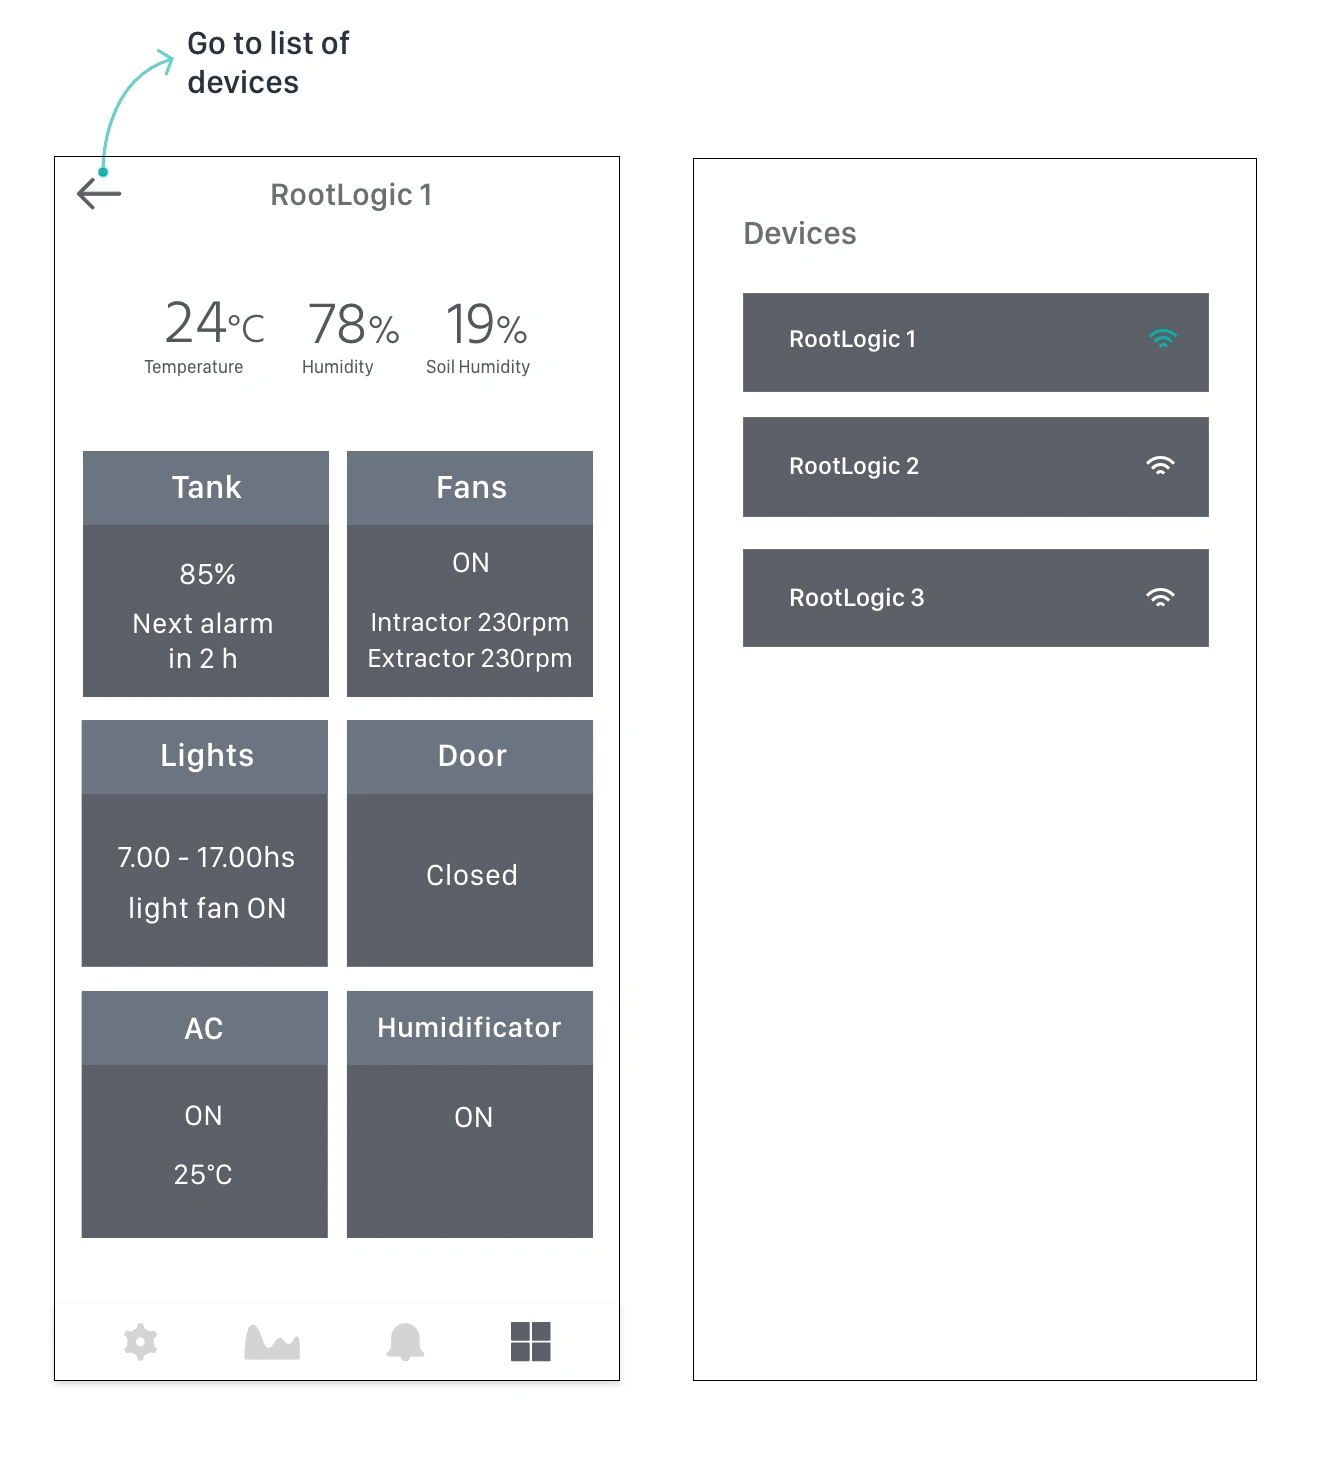
Old Navigation
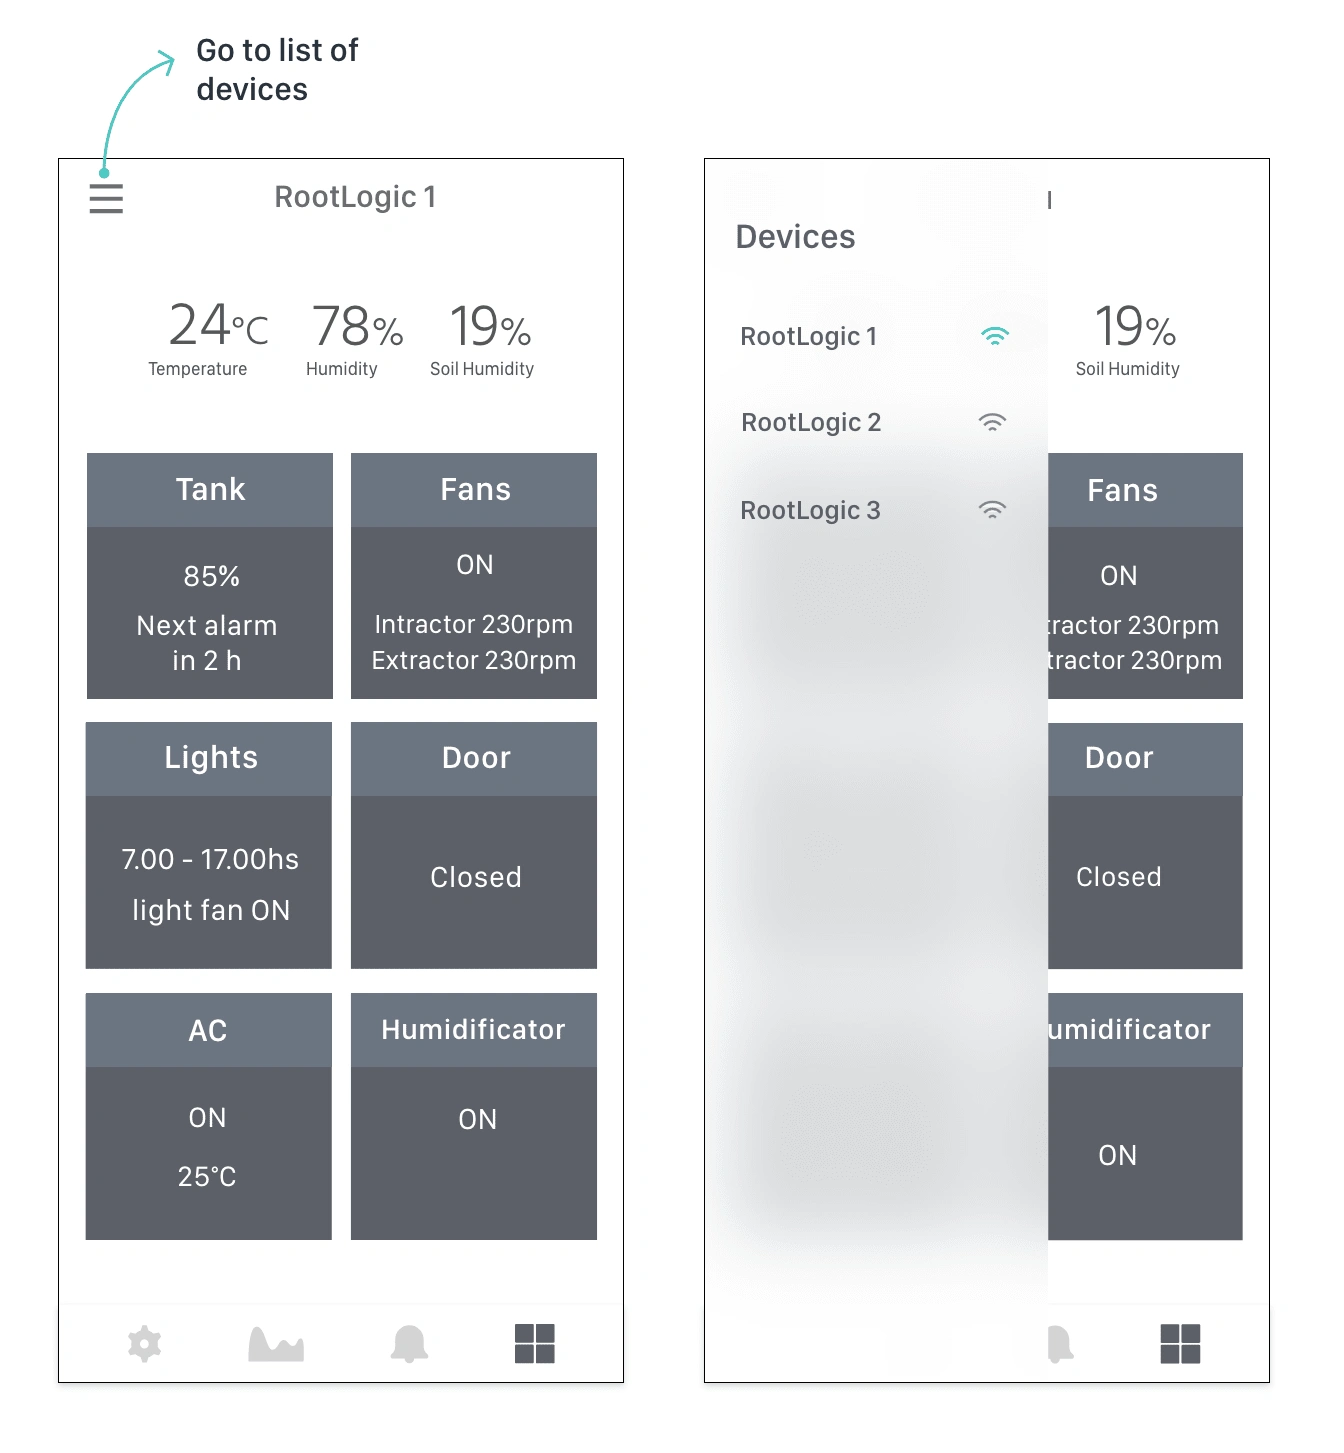
New Navigation
4) High Fidelity Prototype
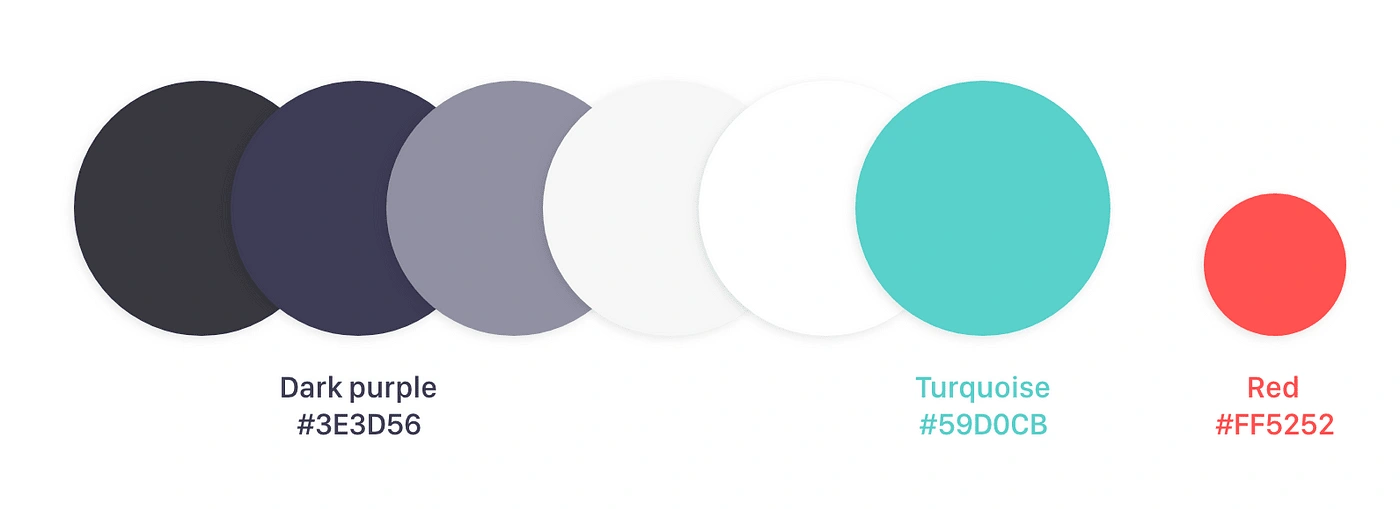
The color palette consists of:
Dark purple.
Turquoise: This color was used for interactions, some CTA buttons and to show ON mode.
Red: To show OFF mode.
Shades of purple: The color palette was completed with shades of purple and white.
Icon selection was done with user feedback, as mentioned earlier. The idea was to pick minimalistic icons to avoid visual overload on our dashboard.
The main screen was divided into two sections in order to differentiate sensors and tappable controls:
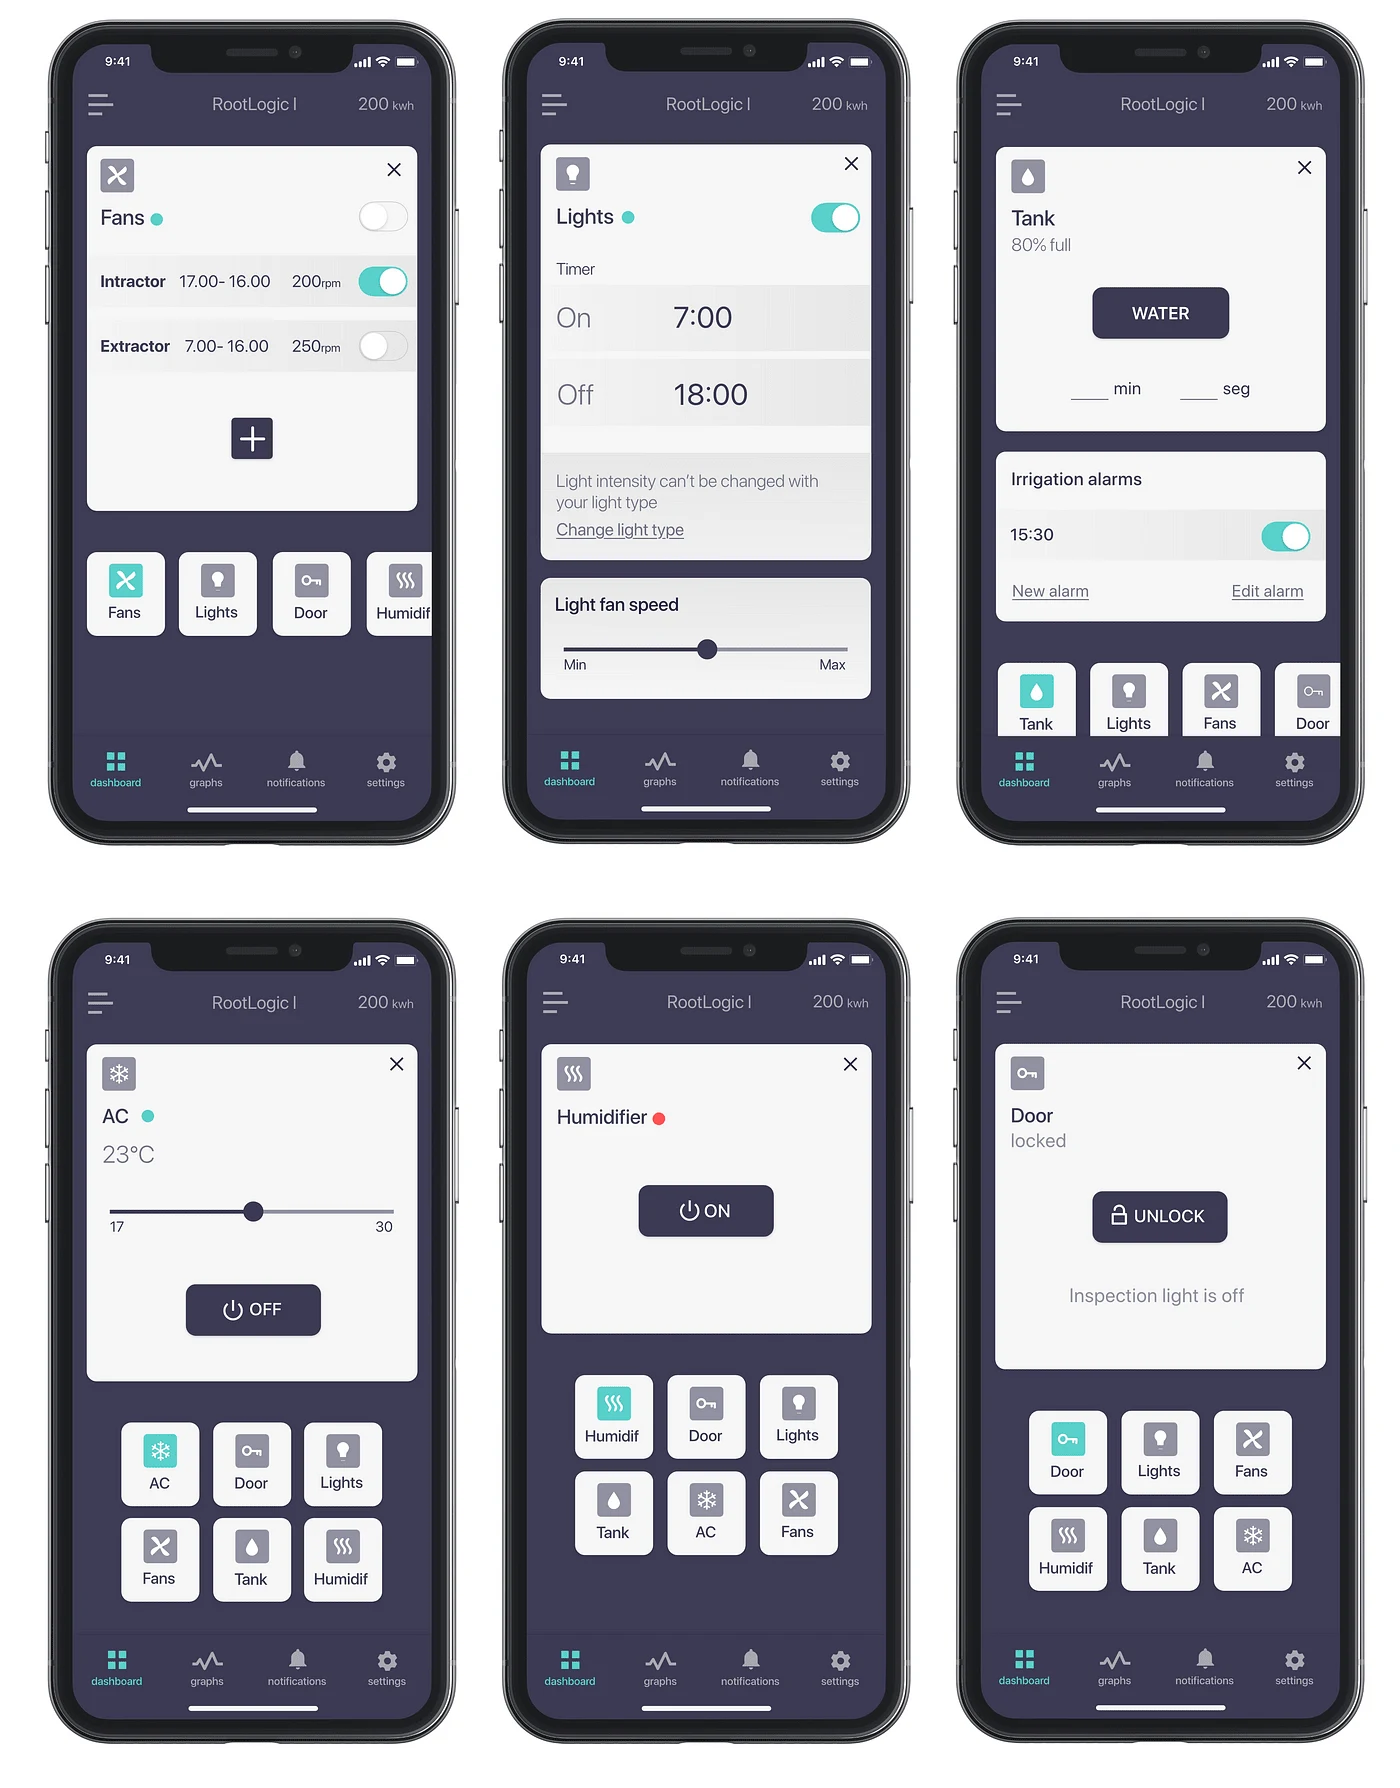
Each control screen is different because they all perform different tasks. Let’s take a look at them:
Final Conclusions
This time, the challenge was to design an app that would give users the ability to control weather variables remotely and in very different types of scenarios. To do that, the dashboard design had to be very clean, neat, and ensure fast visual recognition so it could be easily checked.
I believe the points named above were achieved, but, of course, the UX design process is cyclic and I would like to continue to optimize Rootlogics experience. To do that, more resources designated for research are needed; in this stage, for example, it would be ideal to do field studies.
Future Features and Improvements
Automatization: This feature depends on the electronic device. It would give users even more time and less stress associated with plant care. An example of automatization: When the temperature rises 35°C, the AC is automatically turned on by RootLogic to keep the temperature at 25°C.
APIs: Using APIs to recommend users’ optimum values of Temperature, Humidity and Soil humidity, according to the plant they are growing and their current location.
Microinteractions would enhance the experience of RootLogic by providing a dynamic sense of flow while navigating.
Like this project
Posted Apr 4, 2023
RootLogic is a product that aims to enhance plant growing experiences in indoor environments by providing an electronic device plus a mobile App.