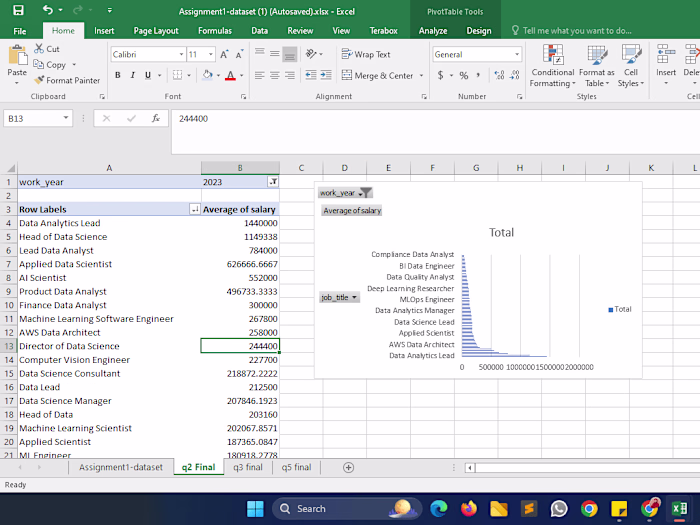
On a dataset I had done Descriptive & Regression Model Analysis
Isra Islam
Target Variable: MPG
Model Fit Metrics:
Multiple R: 0.99094212 (strong positive correlation)
R Square: 0.981966286 (98.2% variation explained)
Adjusted R Square: 0.979142015 (strong model fit)
Model Significance:
F Statistic: 3503.05902 (high value, low p-value, model is significant)
Key Findings:
Strong model fit and significant variables.
Coefficients indicate the direction and magnitude of relationships.
Q8: Regression Function
Equation:
MPG = -4.596 * Cylinders + 0.119 * ModelYear - 0.00393 * Displacement + 0.0836 * Horsepower + 0.8526 * Weight - 0.867 * Acceleration
Explanation: Coefficients show how each feature affects MPG.
Like this project
Posted Sep 23, 2024
Linear regression predicted vehicle MPG using attributes like weight, horsepower, and origin, providing insights to enhance vehicle design and improve fuel effi
Likes
0
Views
0