Sales Report Automation
Essa Mohammed

Sales Report Automation
Data Analyst & Automation
Dubai
+971-506153643
PROJECT 2
Essa Hanif
August 21, 2025
The link of the raw relevant data: https://docs.google.com/spreadsheets/d/1QaM5C5E-crqY8pMhYO8DsiY0Xw-Th4Gb/edit?usp=drive_link&ouid=114386478913810912886&rtpof=true&sd=true
Table 1: Monthly Revenue
Table 2: Top Products
Table 3: Low stock Items
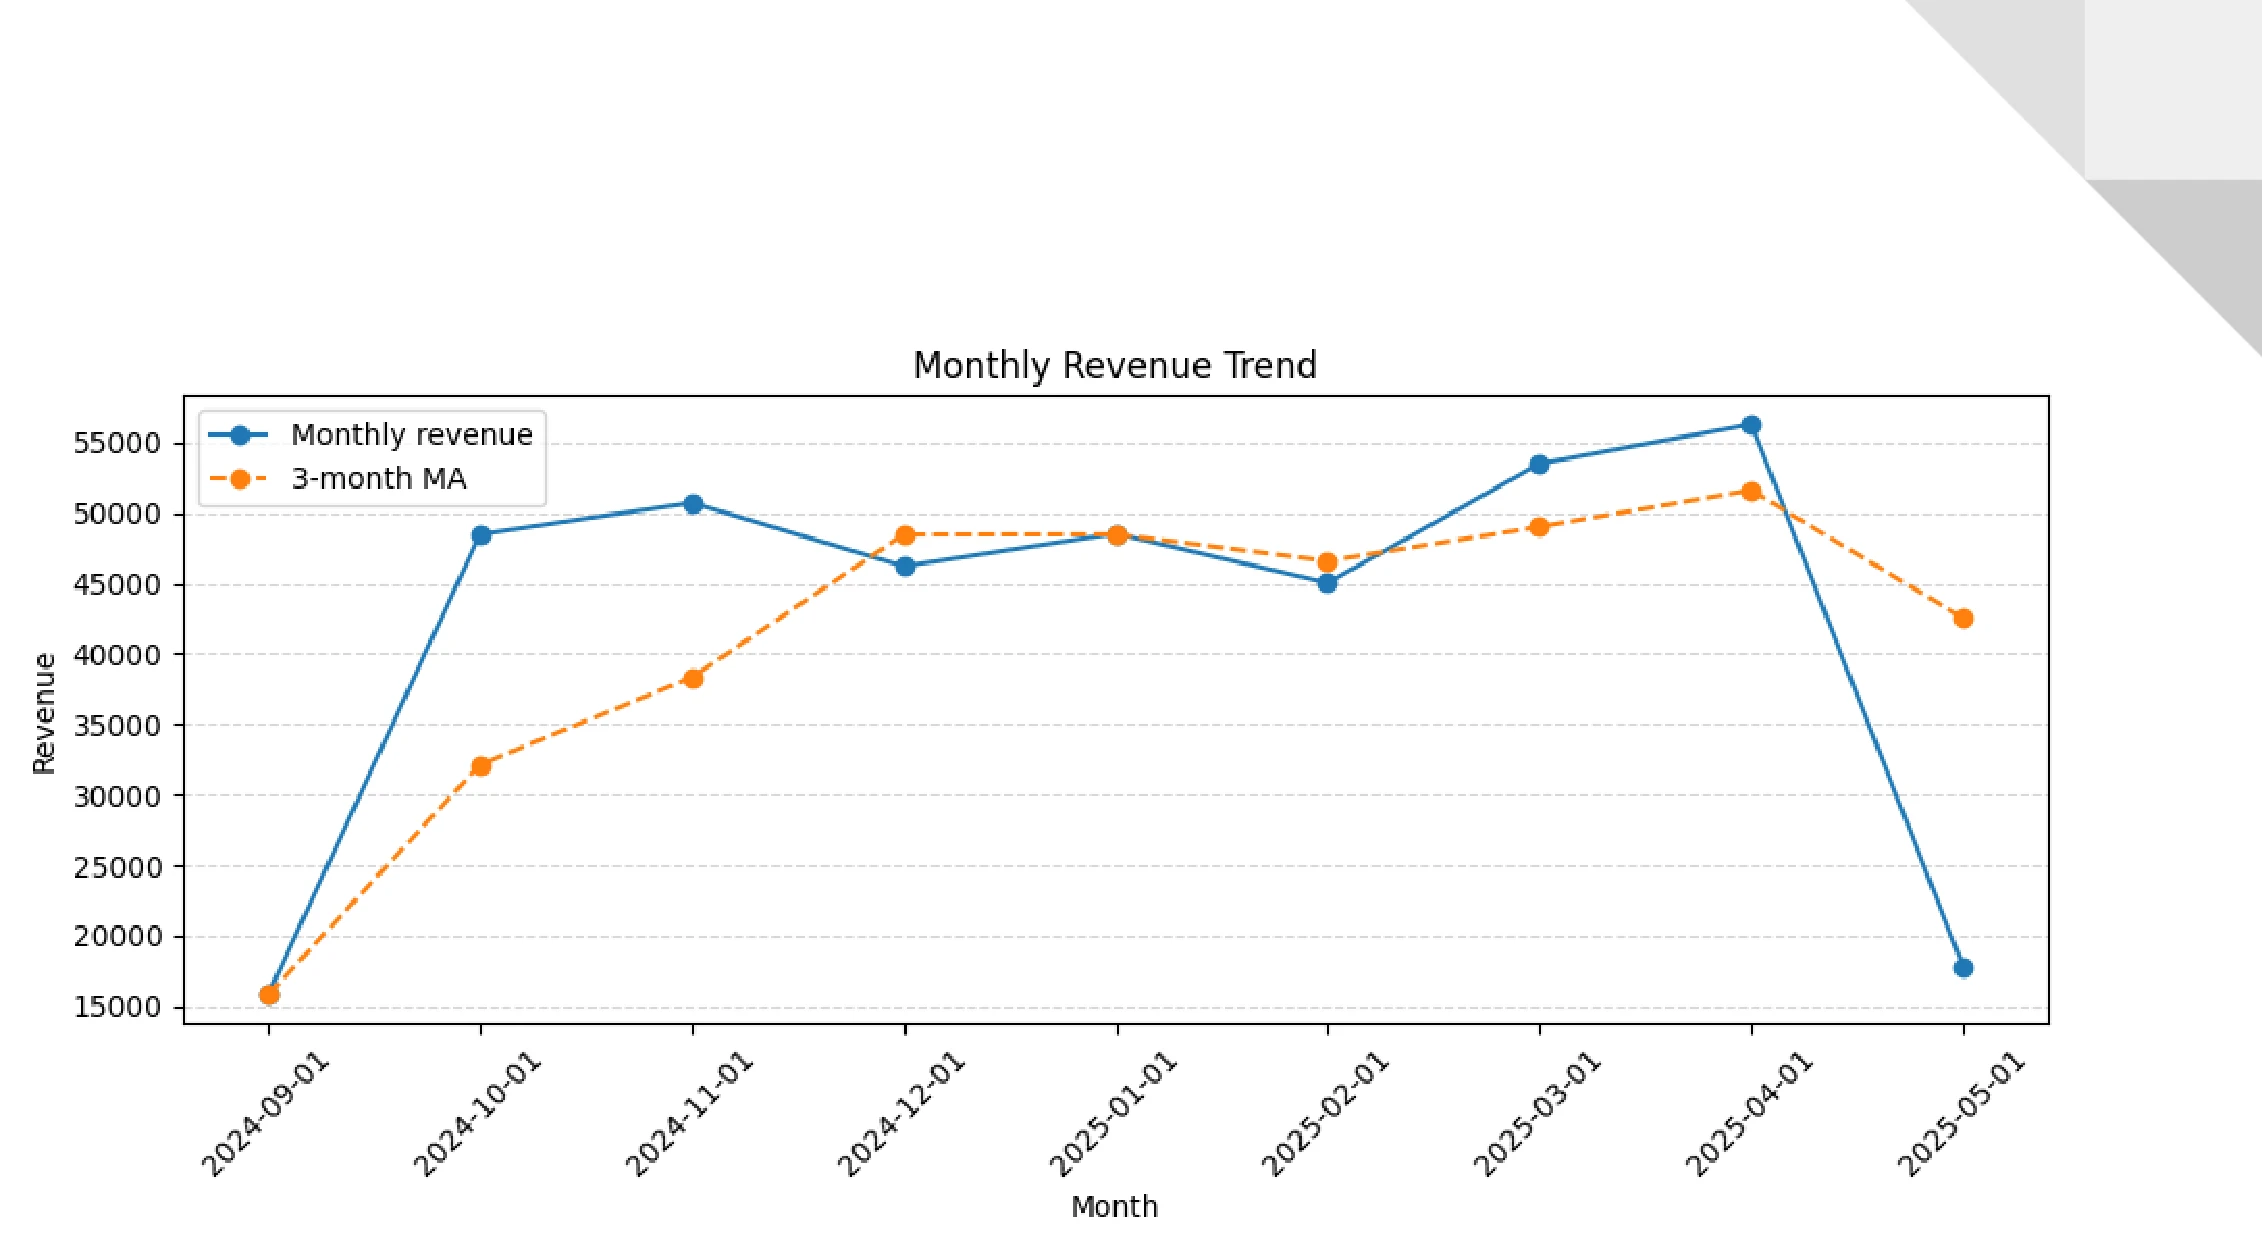
Figure 1: Graph of Monthly Revenue Trend
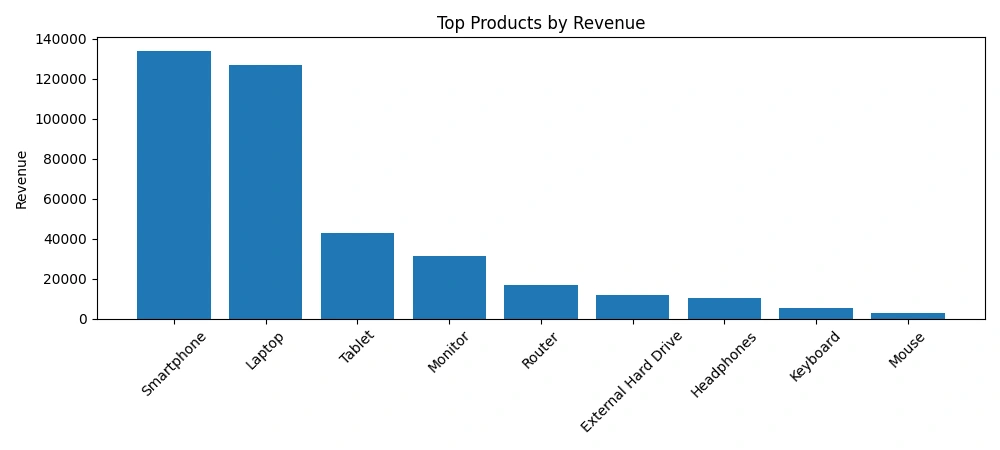
Figure 2: Bar graph of Top Products by Revenue
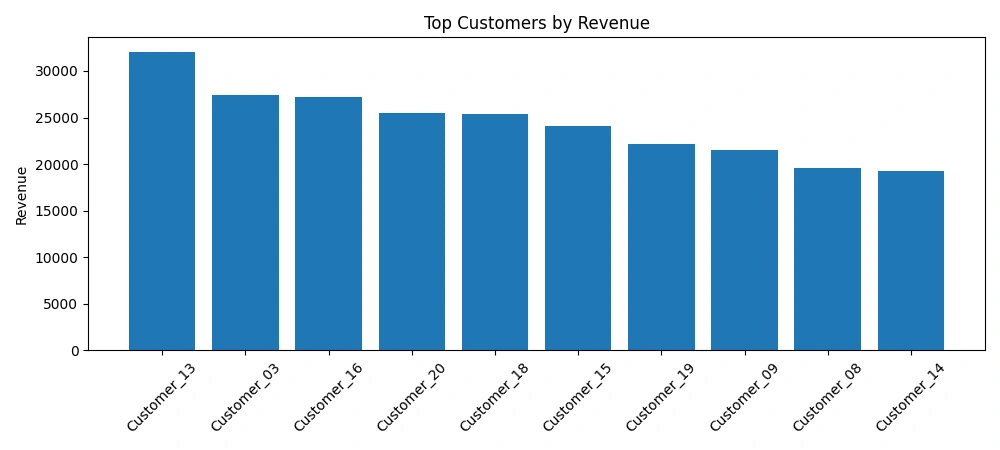
Figure 3: Bar graph of Top Customers by Revenue
Impact
● Saves hours of manual report preparation each month
● Provides clear visibility into sales performance and customer behavior
● Helps managers make faster, data-driven decisions
● Ensures accuracy and consistency in reporting
This project transforms hours of manual labor into a task completed in minutes, empowering businesses to not just view sales numbers but to instantly understand which products and customers drive revenue the most, providing clear direction for strategic growth.
END OF REPORT
Like this project
Posted Sep 22, 2025
Automated sales report for strategic growth and efficiency with hours of manual work done in minutes
Likes
0
Views
0
Timeline
Aug 21, 2025 - Sep 22, 2025