High-impact Infographic Design for Complex Systems
Abdul Hasan
Information Design — Simplifying Complex Systems through Infographics
Project Overview This project involved designing a series of high-impact infographics for various industries, including Fintech (Bitcoin), Logistics (Supply Chain), and Consumer Services (Storage Solutions). The goal was to translate data-heavy concepts into intuitive, "at-a-glance" visual narratives.
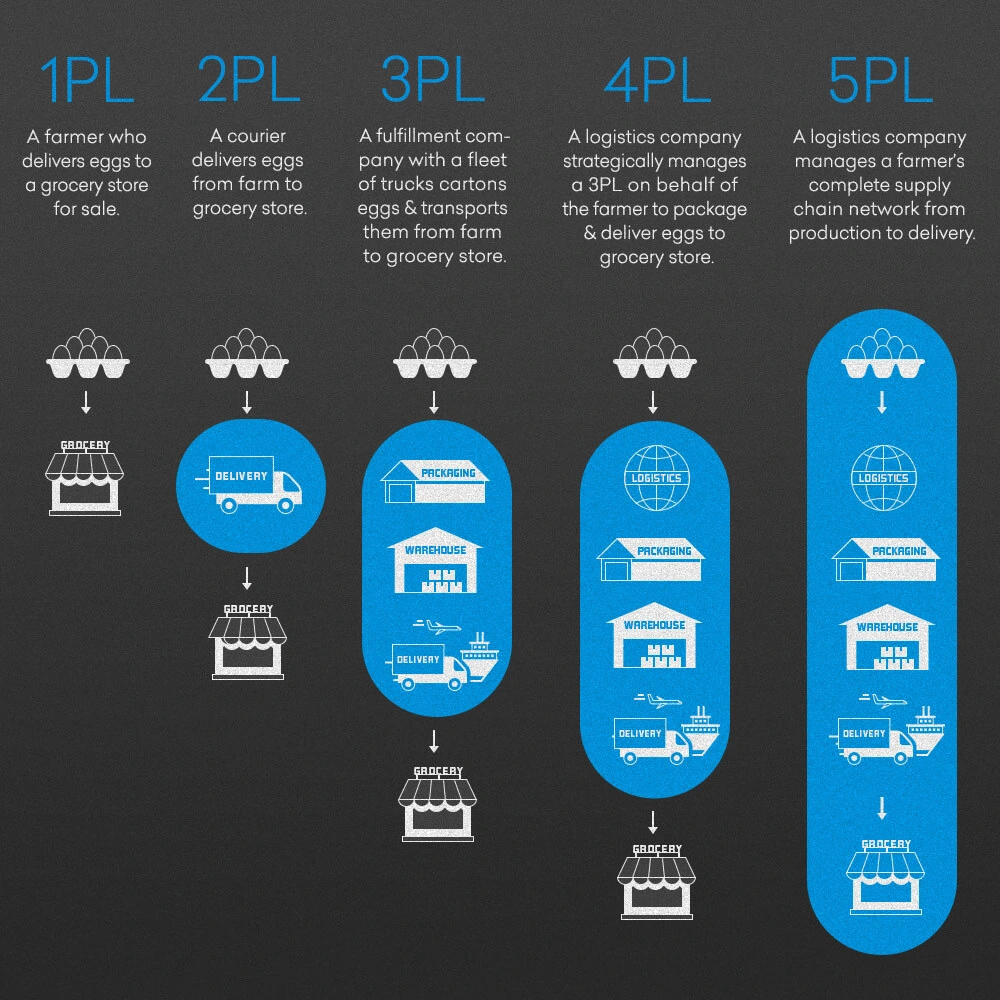
The Challenge Complex topics like Blockchain or 5PL Logistics can be overwhelming for the average reader. The challenge was to maintain technical accuracy while creating a clean visual hierarchy that guides the user’s eye through the "story" of the data without cognitive overload.
My Creative Solution
Visual Storytelling (Bitcoin): I broke down the decentralized nature of Bitcoin using custom illustrations and flowcharts, making the abstract concept of a "ledger" tangible for the viewer.
Hierarchical Flow (Logistics & Storage): For the 1PL-5PL logistics and the Storage Unit flowchart, I implemented a structured vertical and decision-tree layout. This ensures that the user can follow a logical path to find the specific information they need.
Iconography & Branding: I developed a consistent icon set for each infographic to represent complex ideas (like "Warehouse," "Nodes," or "Climate Control") simply and effectively.
Color Strategy: Used high-contrast palettes and "anchor colors" to differentiate between various categories, ensuring the most important data points stand out immediately.
The Result
Successfully transformed dense technical documentation into shareable, high-engagement social and educational assets.
Delivered "decision-making tools" (like the flowchart) that improve user experience and brand authority.
Tools Used
Adobe Illustrator (Vector Illustration & Layout)
Adobe Photoshop (Compositing & Effects)

Like this project
Posted Jan 23, 2026
I designed this infographics for Fintech and Logistics, translating complex data into intuitive visual narratives through custom iconography and flowcharts.