
Built a complete SQL Server (T-SQL) data warehouse for a fictional multi-channel, multi-currency retailer (synthetic dataset created for demonstration purposes). Delivered: staging layer loaded from 17 CSV files (~397K rows); one transactional, re-runnable ETL stored procedure that cleans duplicates, mixed date formats and inconsistent labels; a star schema with keys and constraints; reporting views with business rules defined once (net revenue in USD, contribution margin); automated data-quality tests; and 17 analytical queries (cohort retention, RFM segmentation, Pareto/ABC, constant-currency growth, carrier failure alert, inventory health, CAC vs platform claims, budget vs actual). Key insight: marketplace shows 51% gross margin but only 24.5% contribution margin after commission, shipping and refunds.
1
51
Developed a comprehensive, 10-page interactive Power BI Executive Dashboard for "Altitude Outfitters" (a multi-channel, multi-currency outdoor retail company operating across 8 countries). The goal was to transform 17 raw, messy tables (~146K order lines) into an automated decision-making tool for leadership.
Key Features & Technical Highlights:
• Data Cleaning & ETL (Power Query): Cleaned dirty data, handled missing values, removed duplicates, and standardized multi-format dates and currencies using custom M-code.
• Data Modeling: Designed a robust Star/Snowflake Schema resolving complex relationships and multi-granularity facts (daily marketing spend, weekly sessions, monthly targets, and order-level sales).
• Advanced DAX: Created 50+ measures including dynamic Currency Conversion (Local to USD + Constant Currency FX Impact), Time Intelligence (YTD, YoY), Contribution Margin Waterfall, and Customer Acquisition Cost (CAC).
• Deep-Dive Analytics: Built Customer Cohort Retention Heatmaps, RFM Segmentation, Pareto (80/20) Analysis, Marketing Funnel, and an Inventory Health Quadrant (Days of Cover vs. Sales Velocity).
• Premium UI/UX Design: Applied a custom JSON dark theme, Field Parameters (dynamic metric switching), 'What-If' scenario sliders for target forecasting, Custom Tooltips, and a seamless Master-Detail drill-through experience using Bookmarks.
(Note: Fictional dataset created for portfolio demonstration purposes).
1
69
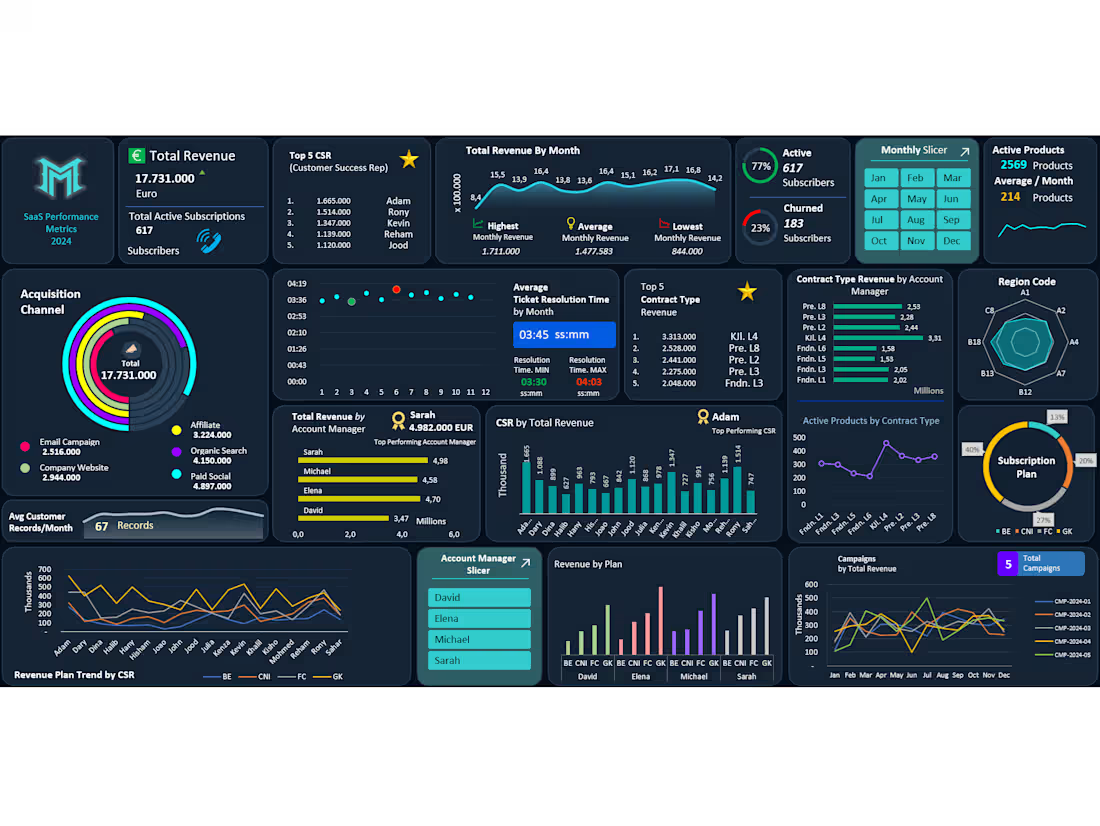
Project Overview
Designed and developed an end-to-end, interactive SaaS Performance Metrics Dashboard to track €17.73M in annual revenue, subscriber retention, acquisition channels, and team performance across 12 months. Built on a robust backend data architecture powered by 23 interconnected Pivot Tables, enabling seamless dynamic filtering via Monthly and Account Manager slicers.
Key Business Metrics & Insights Tracked:
Revenue & Subscription Health: Monitored €17.73M Total Revenue (Peak: €1.71M/month, Avg: €1.48M/month) alongside 617 Active Subscribers (77% retention) vs. 23% Churn rate (183 subscribers) and 2,569 Active Products.
Customer Acquisition Channels: Analyzed ROI across 5 core channels—identifying Paid Social (€4.89M) and Organic Search (€4.15M) as top revenue drivers, followed by Affiliate (€3.22M), Website (€2.94M), and Email Campaigns (€2.51M).
Team & Account Manager Performance: Evaluated individual contributions, highlighting top-performing Account Manager (Sarah – €4.98M) and Top 5 Customer Success Representatives (CSR Leader: Adam – €1.66M).
Operational Efficiency & SLA: Tracked monthly Average Ticket Resolution Time (03:45 min avg, ranging from 03:30 to 04:03) to ensure high customer satisfaction and lower churn.
Product, Contract & Regional Breakdown: Visualized multi-dimensional trends across Subscription Plans (BE, CNI, FC, GK), Contract Types, Regional distribution (Radar Chart), and 5 Marketing Campaigns.
Technical Highlights:
Engineered a complex backend using 23 Pivot Tables and advanced formulas for automated calculations.
Designed a modern Dark Mode UI/UX with custom radial bar charts, line/area trends, radar charts, and dynamic KPI cards for executive-level storytelling.
Integrated interactive Monthly and Account Manager Slicers for instant drill-down analysis.
1
107