The network for creativity
Join 1.25M professional creatives like you
Connect with clients, get discovered, and run your business 100% commission-free
Creatives on Contra have earned over $150M and we are just getting started
Back to feedPost

Project Overview
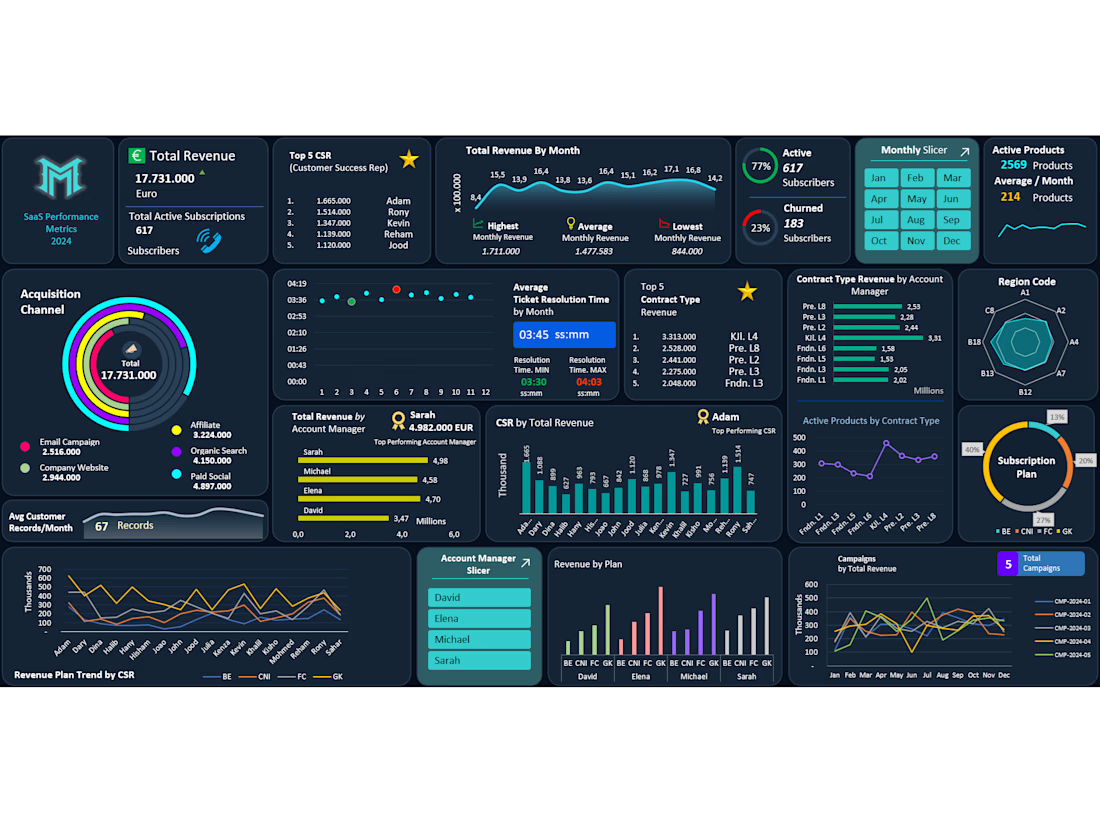
Designed and developed an end-to-end, interactive SaaS Performance Metrics Dashboard to track €17.73M in annual revenue, subscriber retention, acquisition channels, and team performance across 12 months. Built on a robust backend data architecture powered by 23 interconnected Pivot Tables, enabling seamless dynamic filtering via Monthly and Account Manager slicers.
Key Business Metrics & Insights Tracked:
Revenue & Subscription Health: Monitored €17.73M Total Revenue (Peak: €1.71M/month, Avg: €1.48M/month) alongside 617 Active Subscribers (77% retention) vs. 23% Churn rate (183 subscribers) and 2,569 Active Products.
Customer Acquisition Channels: Analyzed ROI across 5 core channels—identifying Paid Social (€4.89M) and Organic Search (€4.15M) as top revenue drivers, followed by Affiliate (€3.22M), Website (€2.94M), and Email Campaigns (€2.51M).
Team & Account Manager Performance: Evaluated individual contributions, highlighting top-performing Account Manager (Sarah – €4.98M) and Top 5 Customer Success Representatives (CSR Leader: Adam – €1.66M).
Operational Efficiency & SLA: Tracked monthly Average Ticket Resolution Time (03:45 min avg, ranging from 03:30 to 04:03) to ensure high customer satisfaction and lower churn.
Product, Contract & Regional Breakdown: Visualized multi-dimensional trends across Subscription Plans (BE, CNI, FC, GK), Contract Types, Regional distribution (Radar Chart), and 5 Marketing Campaigns.
Technical Highlights:
Engineered a complex backend using 23 Pivot Tables and advanced formulas for automated calculations.
Designed a modern Dark Mode UI/UX with custom radial bar charts, line/area trends, radar charts, and dynamic KPI cards for executive-level storytelling.
Integrated interactive Monthly and Account Manager Slicers for instant drill-down analysis.

The network for creativity
Join 1.25M professional creatives like you
Connect with clients, get discovered, and run your business 100% commission-free
Creatives on Contra have earned over $150M and we are just getting started


Related posts

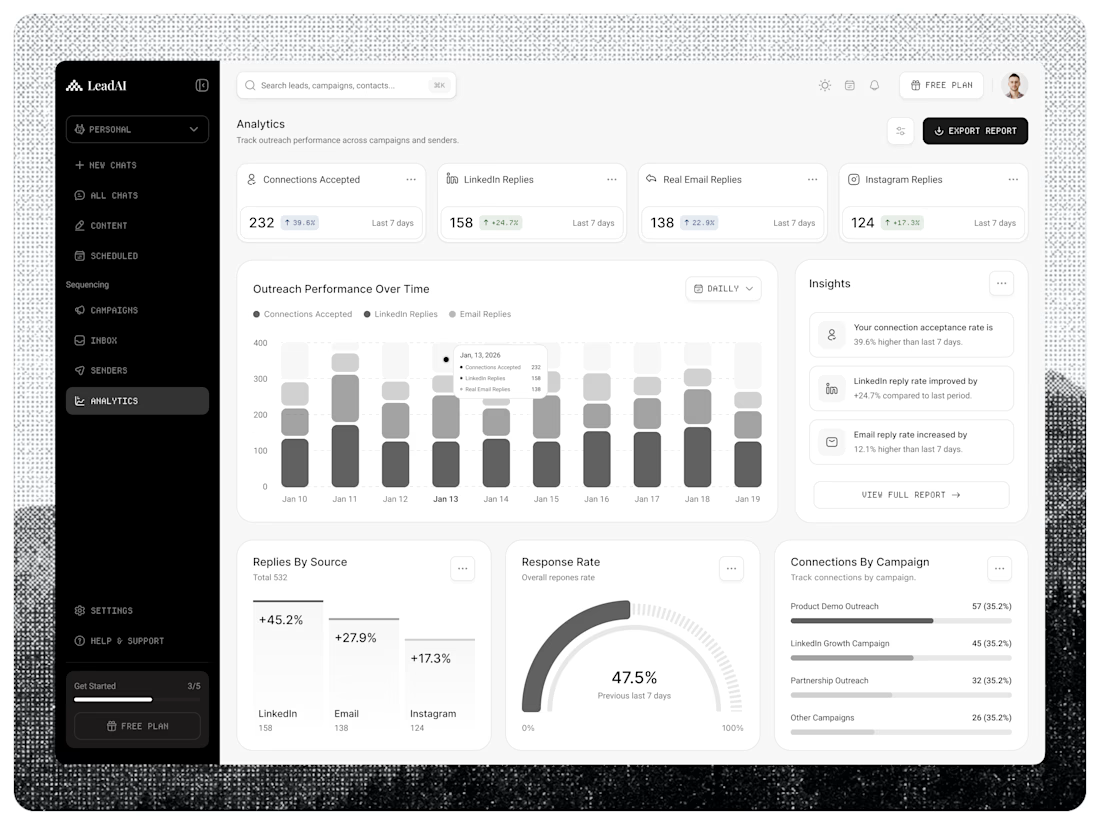
AI-Powered Prospecting SaaS Platform | Analytics Dashboard
LeadAI — AI-Powered Prospecting SaaS Platform A modern AI-powered prospecting platform designed to help sales teams discover high-quality leads, automate outreach, manage campaigns, and turn prospects into opportunities.
The experience combines AI assistance, lead generation, email & LinkedIn outreach, campaign management, analytics, and smart sales workflows into one clean, intuitive SaaS platform.
Designed for: SaaS Founders, Sales Teams, Growth Teams & B2B Businesses.
Focus: AI • Lead Generation • Sales Automation • CRM • SaaS • Dashboard • UI/UX • Product Design Designed with Figma. Interested in building a modern SaaS, AI product, CRM, dashboard, or B2B web application?
Available for UI/UX & AI Product Design projects. 🎯
✅ Full-Time | Contract | Remote



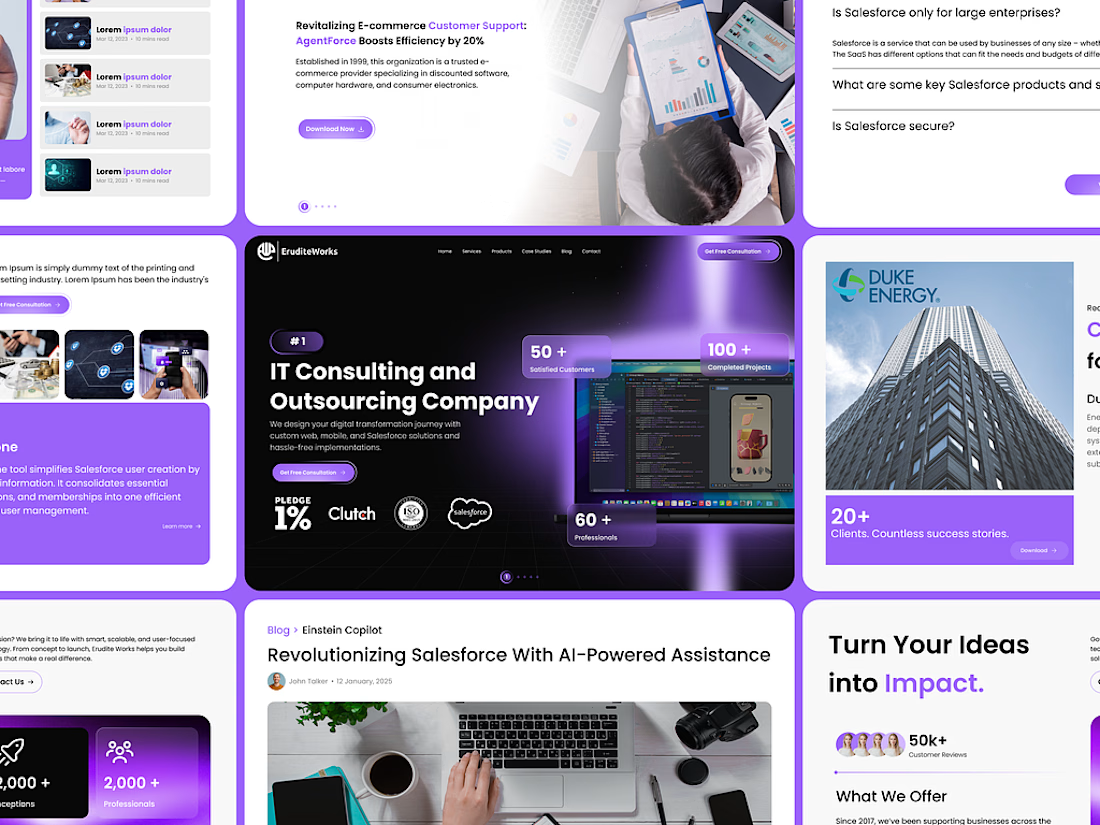
Designed a high-converting, premium enterprise landing page for EruditeWorks, an IT consulting and outsourcing firm.
The Problem: Many corporate tech websites feel flat, text-heavy, and fail to immediately convey tech authority or client trust metrics.
The Solution: I engineered a layout that balances visual richness with strategic information architecture:
• Structured a high-impact hero header featuring validation metrics (100+ Completed Projects, 60+ Professionals).
• Implemented seamless trust badges underneath the core value proposition.
• Created visually engaging secondary layouts for client success stories, AI tools (Einstein Copilot), and intuitive FAQ components.
• Maintained an authoritative yet bleeding-edge aesthetic using a dark palette with premium glowing gradients.
Deliverables included full high-fidelity desktop UI designs and a responsive component system ready for developer handoff.



So clean.