


What skills should I look for when hiring a freelance data visualizer?
Look for skills in data analysis, design, and IT software like Tableau or Power BI. A data visualizer should turn numbers into easy-to-read charts or graphs. Make sure they can also communicate well—this will help them explain their visuals clearly.
How can I ensure a data visualizer understands my project's needs?
Start by clearly explaining your goals and what data you have. Show them examples of visual styles you like. Ensure they can ask questions, as this shows they understand what you're looking for.
What are important portfolio items for a data visualizer?
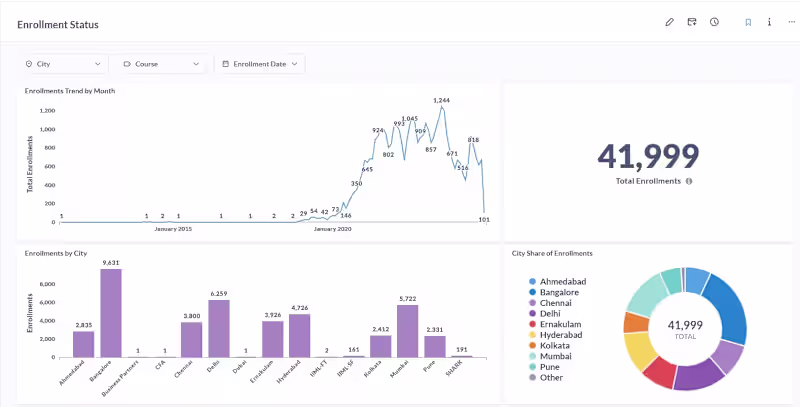
A good portfolio will have different types of charts and graphs showing real-world data. Look for case studies that demonstrate problem-solving skills. Make sure they explain what the visuals represent and why they used specific styles.
How can we agree on deliverables for a data visualization project?
Discuss what the final visuals should look like and how many you need. Set clear targets for what each visual should explain. Write down these deliverables so both you and the freelancer know the goals.
What tools should a data visualizer be familiar with when working on projects in Telangana?
Familiar tools include Tableau, Power BI, and Google Data Studio. These tools help create visuals for local businesses and government data projects. Make sure they are comfortable with spreadsheets and databases used in Telangana.
How do I start a data visualization project focusing on agriculture in Telangana?
Collect data such as crop yields, climate stats, or market prices related to Telangana. Share these data points with your freelancer for creating relevant visuals. Outline the key messages you want every visual to show about agriculture in the region.
When is the best time to hire a data visualizer for an education project in Telangana?
Hire a visualizer early, during the planning phase. They can help with structuring data from schools or colleges. This ensures that educational trends and insights are clearly shown in the final visuals.
What local factors should I consider when working with a data visualizer for a project in Telangana?
Consider cultural nuances and regional preferences in data presentation. Local knowledge can help make the data more relatable to your audience. Be open to ideas about how to incorporate Telangana's data into engaging visuals.
How can I ensure project management runs smoothly with a data visualizer?
Use clear, regular communication, such as weekly updates. Use project management tools to track progress and deadlines. This helps both you and the freelancer stay organized and focused on your goals.
What's the best way to kick off a data visualization project with a new freelancer?
Start with a meeting to introduce your project and team. Share all existing data and explain your objectives. Agree on timelines for drafts and final visuals to keep everyone aligned from the start.
Who is Contra for?
Contra is designed for both freelancers (referred to as "independents") and clients. Freelancers can showcase their work, connect with clients, and manage projects commission-free. Clients can discover and hire top freelance talent for their projects.
What is the vision of Contra?
Contra aims to revolutionize the world of work by providing an all-in-one platform that empowers freelancers and clients to connect and collaborate seamlessly, eliminating traditional barriers and commission fees.