Projects using ggplot2
Projects using ggplot2
Sign Up
Post a job
Sign Up
Log In
Filters
1
Projects
People
Message
0
Anastasiya Kotelnikova
Equity Portfolio Optimization with R
0
3
Message
1
Adriana E. Reyes
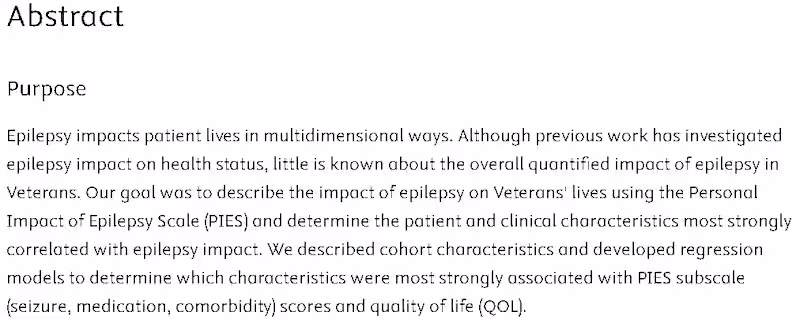
First Author & Data Scientist | Presented at the American Epilepsy Society Annual Meeting Led the quantitative analysis of epilepsy's multidimensional impact on Veterans' lives using the Personal Impact of Epilepsy Scale (PIES). Built regression models to identify patient and clinical characteristics most strongly associated with seizure, medication, and comorbidity burden and quality of life outcomes. Developed all data visualizations in R and ggplot2. Key findings included a consistent association between seizure frequency and negative epilepsy impact, and age effects aligned with broader quality-of-life literature.
1
54
Message
0
Eric Holton
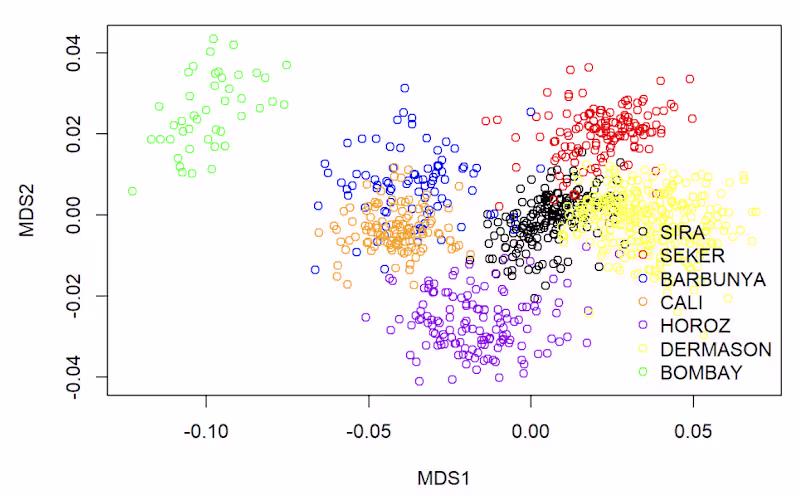
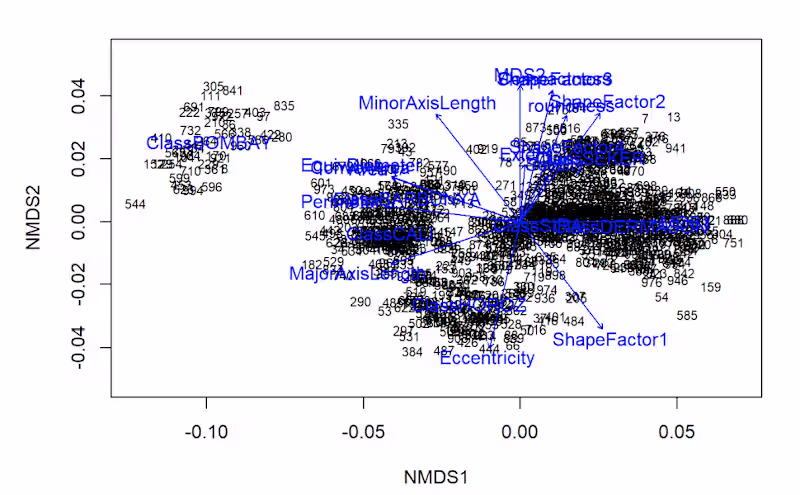
Non-metric MultiDimensional Scaling (NMDS) analysis of a publicly-available legume dataset for sorting machine development
0
30
Message
0
Karim Kardous
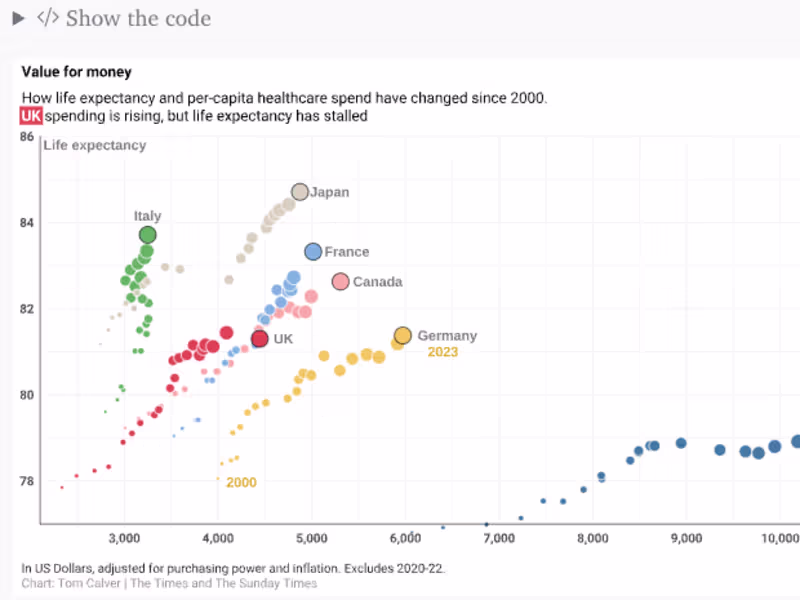
Interactive Visualization of NHS Satisfaction Trends
0
2
Message
0
Enric Real
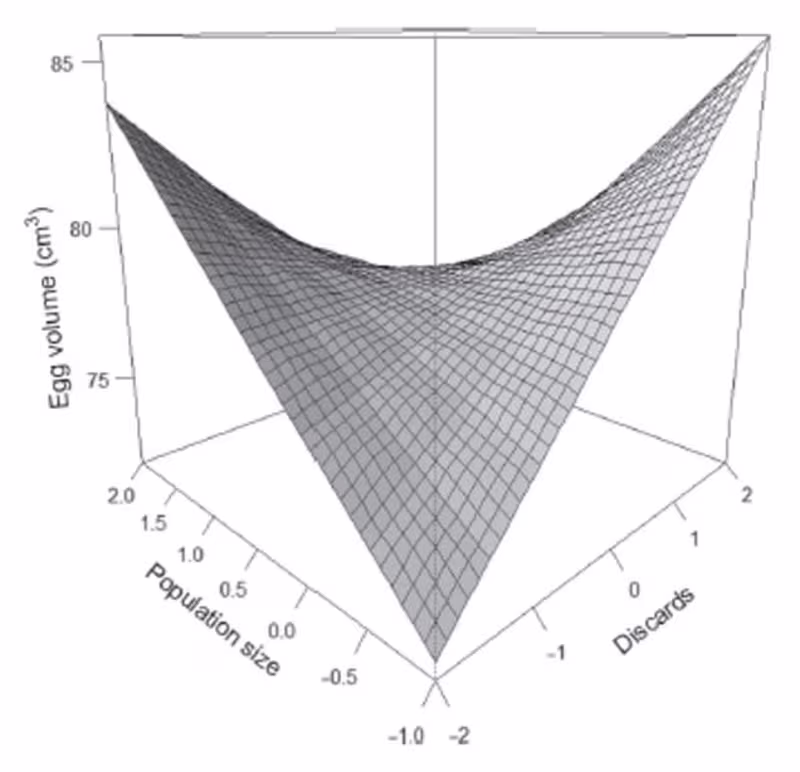
3D Ecological Response Surface (Environmental Gradients)
0
37
Message
0
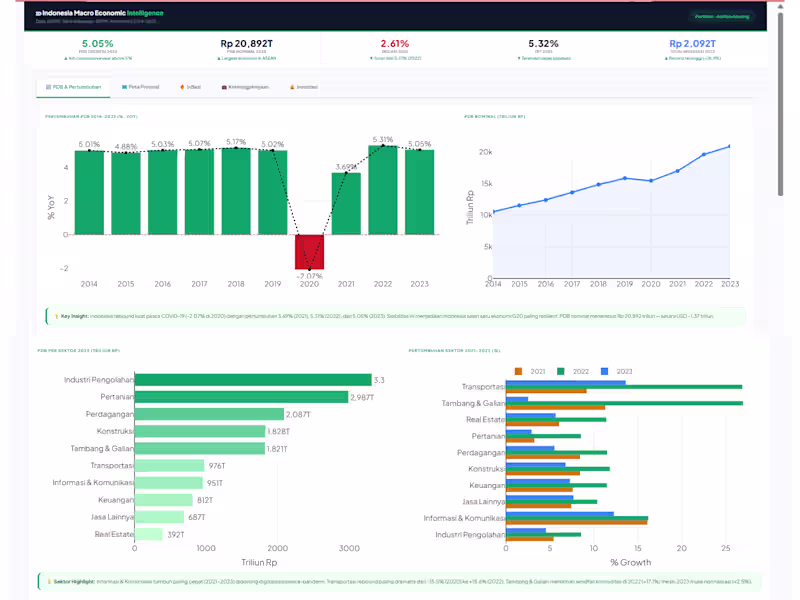
Arditya Apusing
Interactive macroeconomic dashboard built in R Shiny covering GDP growth trends, provincial inflation heatmaps, unemployment-investment correlation, and Gini coefficient analysis across Indonesia (2014–2023). Data sourced from BPS RI, Bank Indonesia, and BKPM. Built for policymakers and analysts who need fast, visual access to national economic indicators.
0
55
Message
0
Ahmad Karaki
R Shiny Dashboard with MySQL for Interactive Data Analysis
0
8
Message
0
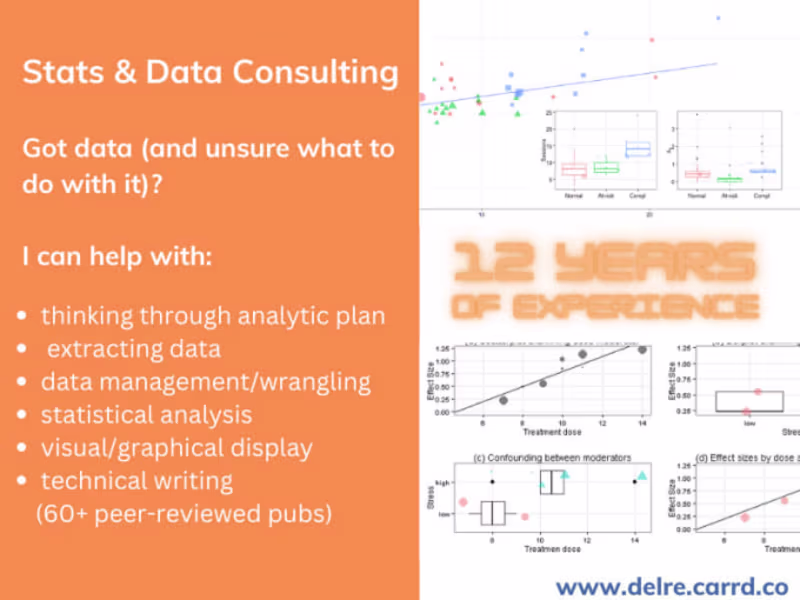
Aaron Del Re
I will turn your data into actionable insights
0
14
Message
0
Marcelo Segall
Bear Conservation Data Analysis
0
12
Message
0
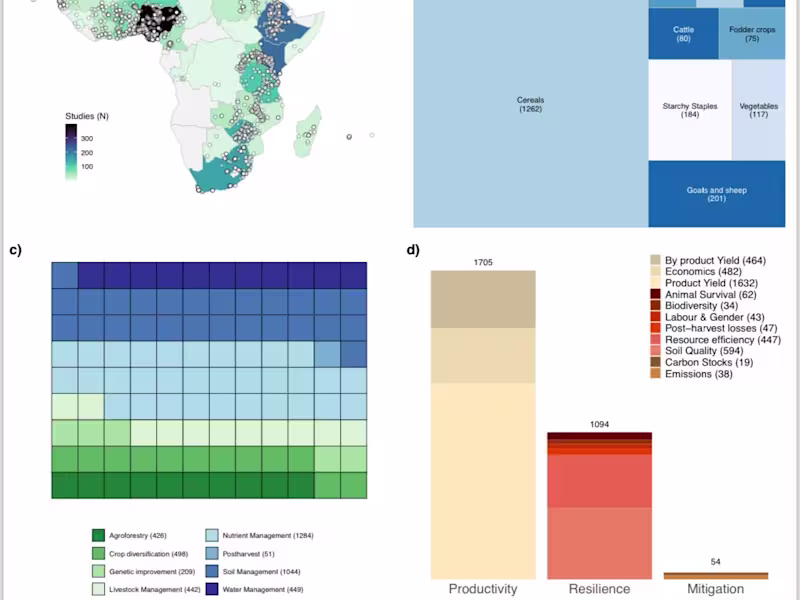
Lolita Muller
Summarize Big data into plots
0
6
Message
0
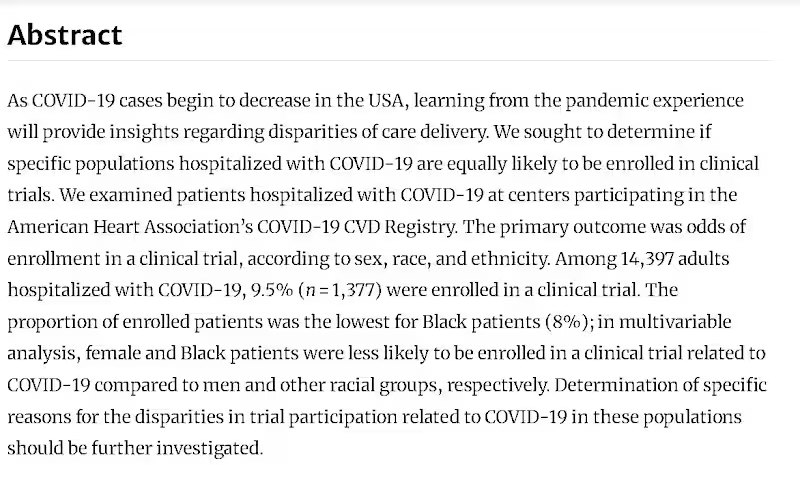
Adriana E. Reyes
I was the lead data analyst on a peer-reviewed cardiology study with Dr. Kevin Shah, examining disparities in COVID-19 clinical trial enrollment across sex, race, and ethnicity. Using R, I performed descriptive analysis and built multivariable models on 14k+ hospitalized patients from the AHA COVID-19 CVD Registry. The study revealed lower enrollment for Black and female patients, highlighting equity gaps in clinical research and the value of rigorous healthcare data analysis.
0
56
Message
0
Eric Holton
Non-metric MultiDimensional Scaling (NMDS) on a publicly-available legume dataset
0
23
Message
0
Karim Kardous
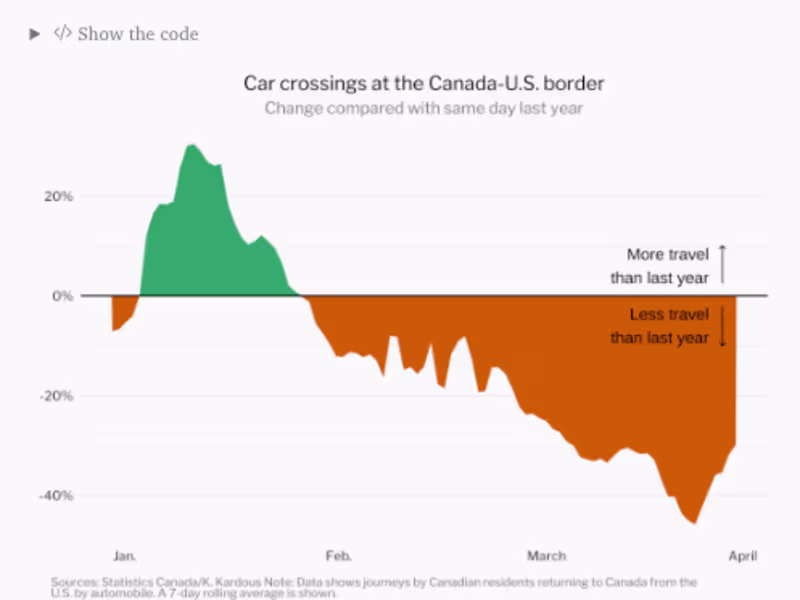
Data Visualization for NYT Travel Article
0
1
Message
0
Enric Real
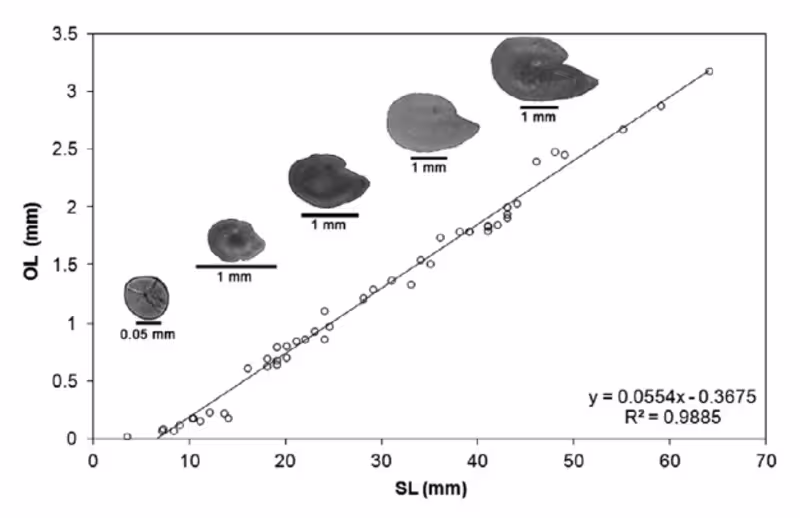
Otolith Size–Length Regression Analysis
0
33
Message
0
Aaron Del Re
Unlock Data-Driven Decisions with Automated Reporting
0
17
Message
1
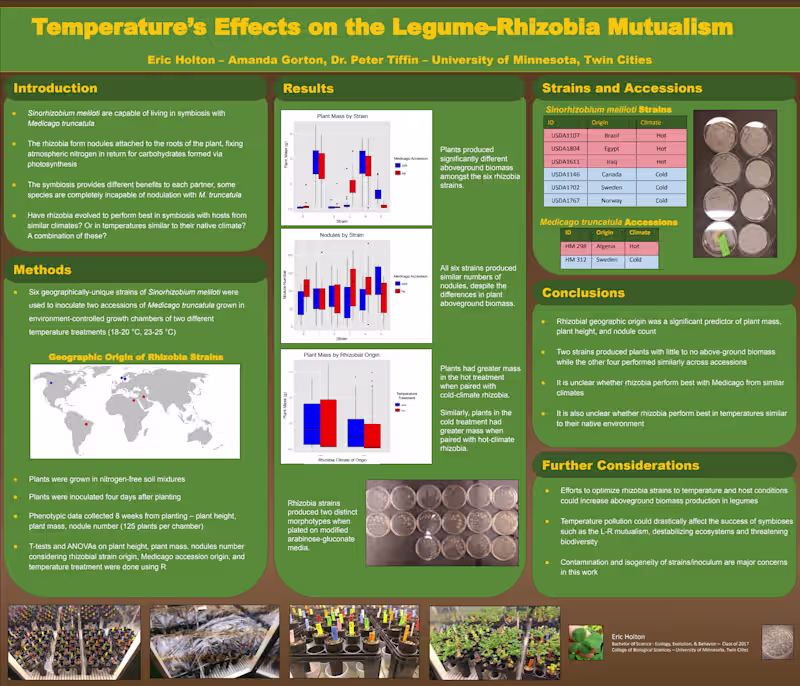
Eric Holton
Temperature's Effects on the Legume-Rhizobia Mutualism as seen at the Winchell Symposium
1
42
Explore projects