Summarize Big data into plots
Lolita Muller
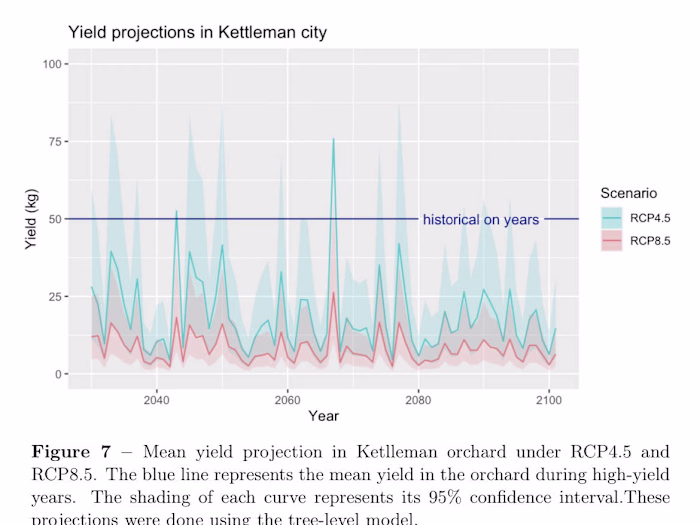
I summarized Big Data on agriculture in Africa, transforming complex datasets into a single, accessible visualization aimed at empowering policymakers. This involved extensive data cleaning in R, followed by the creation of innovative and creative plots that distilled vast information into an insightful, easy-to-understand format. The goal was to make the data clear, actionable, and impactful for decision-makers in the agricultural sector. the figure got published in Nature Data journal.
Like this project
Posted Aug 16, 2024
Figure for Nature Data journal. I summarized Big Data on agriculture in Africa, performing comprehensive data cleaning in R to ensure accuracy. I then created
Likes
0
Views
6