
Fullstack Engineer | 14+ yrs Shipping React,Next.js,Node,AI

Fullstack Engineer | 14+ yrs Shipping React,Next.js,Node,AI


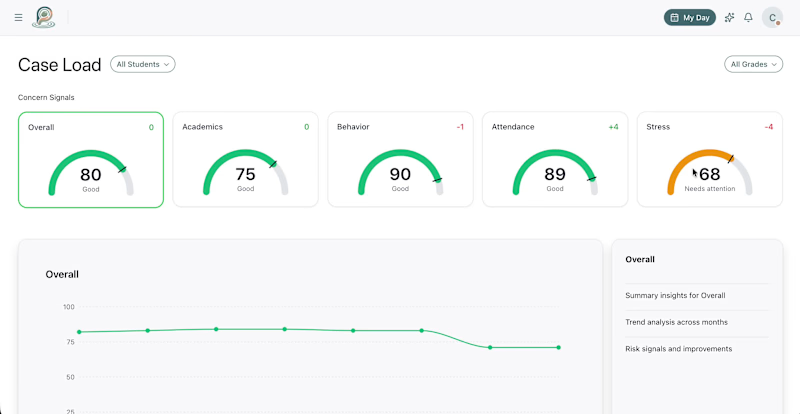
Led delivery of a cloud-native K-12 student wellness platform that helps counselors monitor wellbeing, surface at-risk students, and act early—balancing product velocity with FERPA/COPPA-aware design and multi-tenant isolation (API RBAC, PostgreSQL RLS, district-scoped analytics).
→ Owned technical direction and delivery rhythm across a TypeScript monorepo (pnpm/Turbo):
backend API, web app, shared packages, DB migrations, CI/CD gates, and staged deploys to GCP (e.g. Cloud Run), aligning engineering work with roadmap and release risk.
→ Orchestrated an AI assistant for counselors on Google Vertex AI (Gemini):
system prompts, safety settings for K-12, function-calling tool design, multi-round tool loops, and strict separation so UI widgets render from verified tool results—not model hallucinations—with tracing/feedback hooks (e.g. Langfuse) for quality and auditability.
→ Drove access-control and compliance posture for sensitive student data:
role/permission middleware, tenant-scoped queries, and defense-in-depth database policies—documentation and evidence suitable for enterprise security reviews (e.g. SOC 2–style narratives).
→ Partnered on product and program management:
phased feature rollout, PR/branch discipline, and clear ownership of scope vs. risk so pilot schools could onboard without compromising data boundaries.
→ Shaped integrations and platform boundaries:
Firebase auth, Neon PostgreSQL + Drizzle ORM, real-time patterns, BigQuery analytics isolation, and operational practices (testing, lint, type-check) that keep the stack maintainable at scale.
→ Established a disciplined, AI-accelerated delivery model—not ad-hoc prompting:
Cursor rules and Claude skills/agents for repeatable workflows; Husky + lint/type-check/test gates; GitHub Actions CI/CD; Cursor Cloud Agents for automated PR review; and daily monitoring of E2E, coverage, and critical issues—owning AI-orchestrated implementation while enforcing accuracy, consistency, and observability
1
614

Design & Development Made Easy

Forward Deployed Architect | AI, ERP & Platform Delivery
- $5k+
- Earned
- 1x
- Hired
- 5.0
- Rating
- 16
- Followers
Forward Deployed Architect | AI, ERP & Platform Delivery


Full-Stack AI Architect | Rapid MVPs & Production-Ready Apps
- 12
- Followers
Full-Stack AI Architect | Rapid MVPs & Production-Ready Apps




Founder & AI Automation Systems Architect
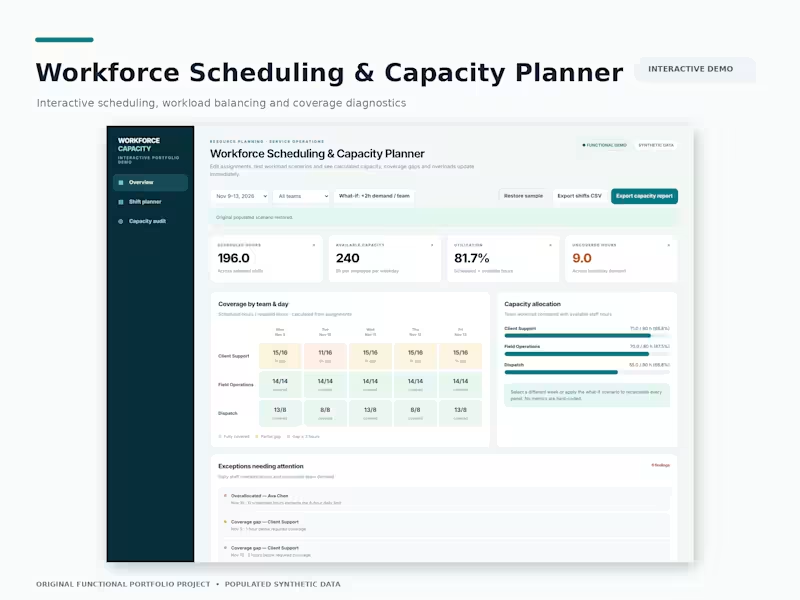
Workforce Scheduling & Capacity Planner | Interactive Demo
This video demonstrates a desktop-optimized workforce scheduling application designed to help operations teams manage staff assignments, monitor capacity, and identify coverage gaps.
Using populated synthetic workforce data, the walkthrough shows how scheduling changes automatically recalculate staffing availability and operational performance metrics.
What the Video Demonstrates
Workforce Capacity Dashboard: Displays 196 scheduled hours, 240 available hours, and 81.7% workforce utilization.
Interactive Shift Management: Demonstrates adding staff assignments and automatically recalculating capacity metrics.
What-If Scenario Planning: Simulates increased staffing demand, raising uncovered hours from 9 to 33.
Multi-Dimensional Coverage Analysis: Displays staffing requirements across departments and weekdays using interactive coverage grids.
Capacity Auditing: Identifies staffing shortages, employee overallocations, and operational exceptions requiring attention.
Technical Implementation
Application Logic: Developed interactive state management that updates dashboard calculations when assignments, reporting periods, or staffing requirements change.
Data Processing: Implemented calculations comparing scheduled staffing hours against available capacity and departmental demand.
Data Management: Built CSV import/export functionality, input validation, and downloadable capacity reports.
Technology: JavaScript, HTML5, and CSS3.
The demonstration showcases a functional workforce planning application with traceable calculations and interactive scenario analysis.
0
32
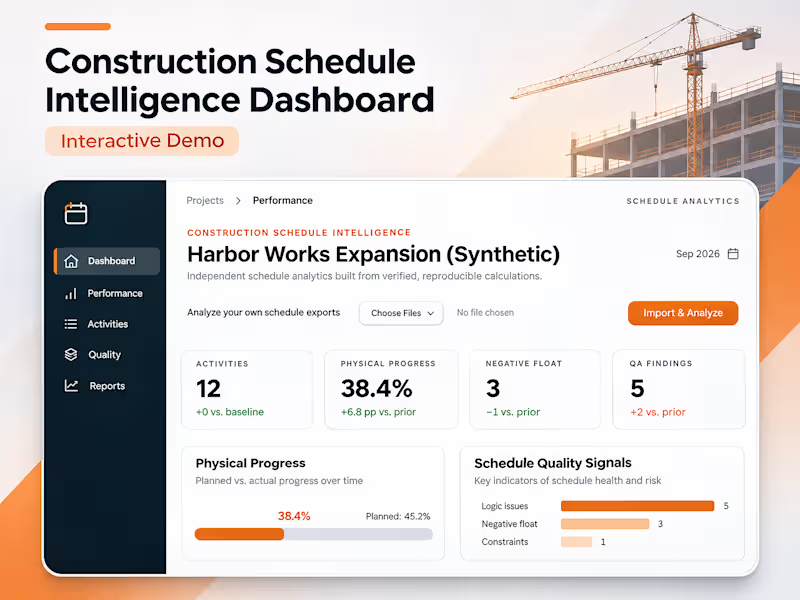
Construction Schedule Intelligence Dashboard | Interactive Demo
This video demonstrates an interactive, local-first construction schedule analytics dashboard designed to process Primavera P6 XER files, evaluate project performance, and identify scheduling risks.
Using the Harbor Works Expansion synthetic project, the walkthrough highlights how construction schedule data is transformed into measurable performance insights.
What the Video Demonstrates
Schedule Data Processing: An interactive dashboard populated with construction activity data and project scheduling information.
Project Health Metrics: 12 activities, 38.4% calculated physical progress, 3 negative-float activities, and 5 automated quality assurance findings.
Performance Visualization: Interactive progress tracking comparing 38.4% completion against a 33% baseline target.
Schedule Risk Detection: Identification of negative float and scheduling quality issues requiring attention.
Data Export: CSV and JSON export capabilities for sharing activity records and calculated results.
The demonstration showcases how automated schedule analysis can support faster project reviews, clearer performance reporting, and more informed project controls decisions.
0
32
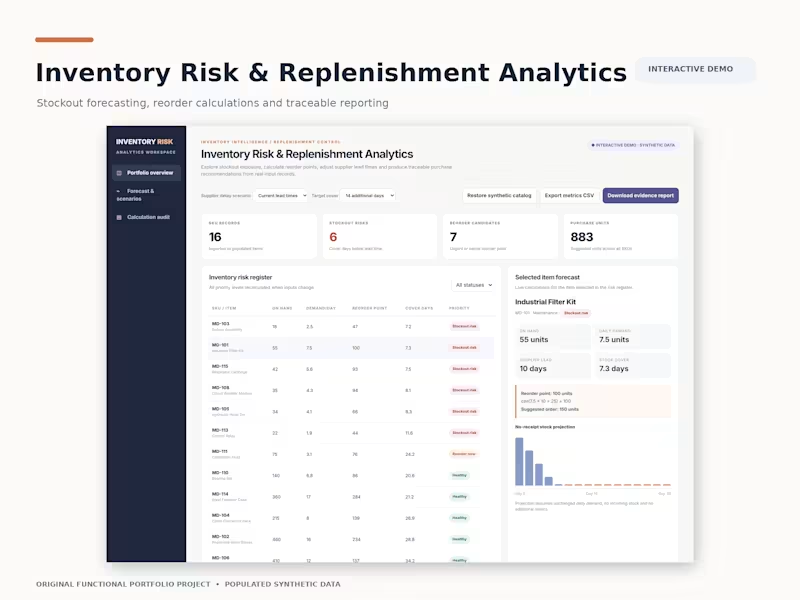
This video demonstrates an interactive inventory analytics application designed to help operations teams monitor stock availability, identify supply shortages, and make informed replenishment decisions.
Using 16 populated synthetic inventory records, the walkthrough demonstrates how changes in stock quantities and supplier lead times automatically update inventory risk calculations.
What the Video Demonstrates
Inventory Dashboard: Displays stock availability, six stockout-risk items, and seven replenishment candidates.
Stockout Risk Detection: Identifies products that may run out before replacement inventory arrives.
Supplier Delay Simulation: Demonstrates how changing lead times affects replenishment calculations and risk exposure.
Interactive Inventory Management: Shows how stock adjustments immediately update dashboard metrics.
Replenishment Analytics: Calculates reorder points using demand, lead time, and safety stock.
Reporting: Provides calculated inventory results and export capabilities.
Technical Implementation
Developed the interactive dashboard, inventory calculation logic, scenario controls, risk filtering, and data import/export functionality using JavaScript, HTML5, and CSS3.
The demonstration showcases a functional inventory management analytics application with reproducible calculations and clearly identified synthetic data.
2
0
125

Senior Frontend Engineer | Software Engineer | 9+ years
Senior Frontend Engineer | Software Engineer | 9+ years


Expert Web Developer & UI/UX Designer
Expert Web Developer & UI/UX Designer


View more →

🚀 React.js & TypeScript Web Expert 🌐
🚀 React.js & TypeScript Web Expert 🌐


