Results that are similar to your search
Similar results
AI & ML Engineer
I’m an AI & Machine Learning engineer with expertise in deve
I’m an AI & Machine Learning engineer with expertise in deve
AI Chatbot Developer | Data Scientist | ML Engineer


View more →
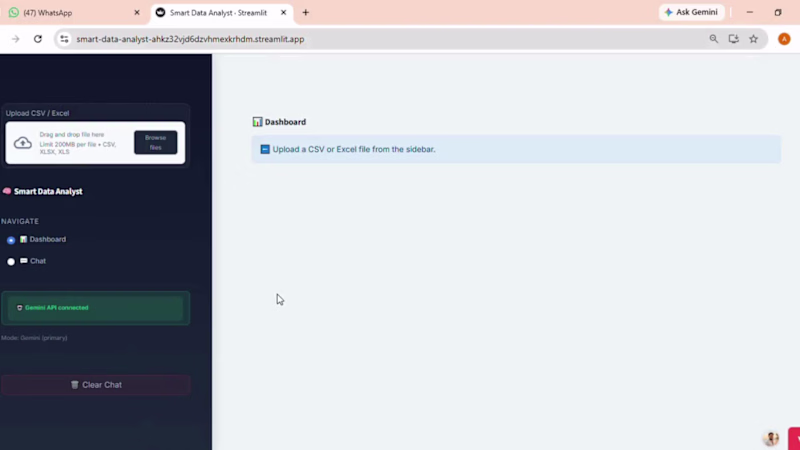
Power BI Data Analyst + ML AI Automation Expert
- 5.0
- Rating
- 100
- Followers
Power BI Data Analyst + ML AI Automation Expert
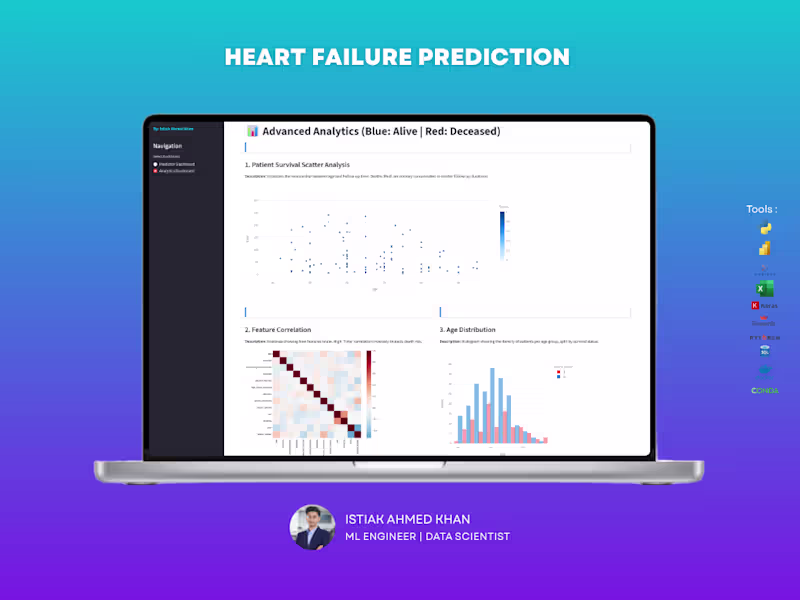
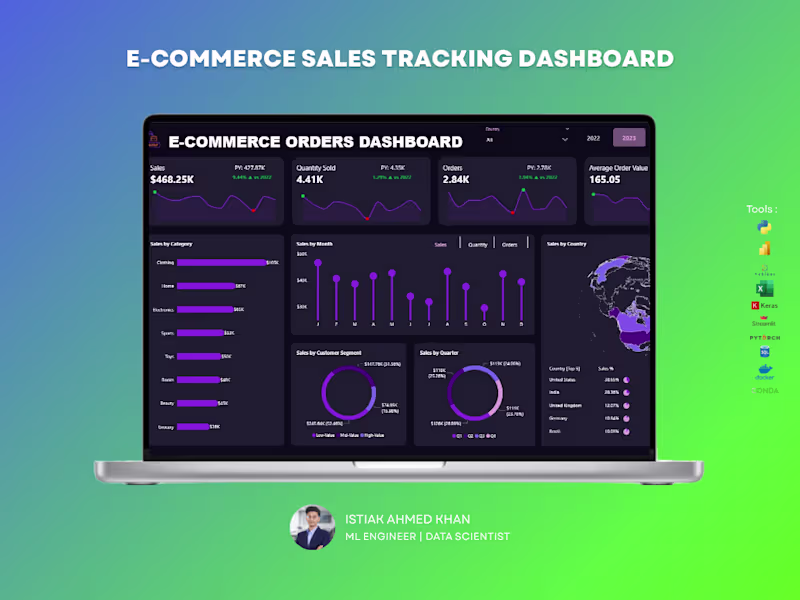
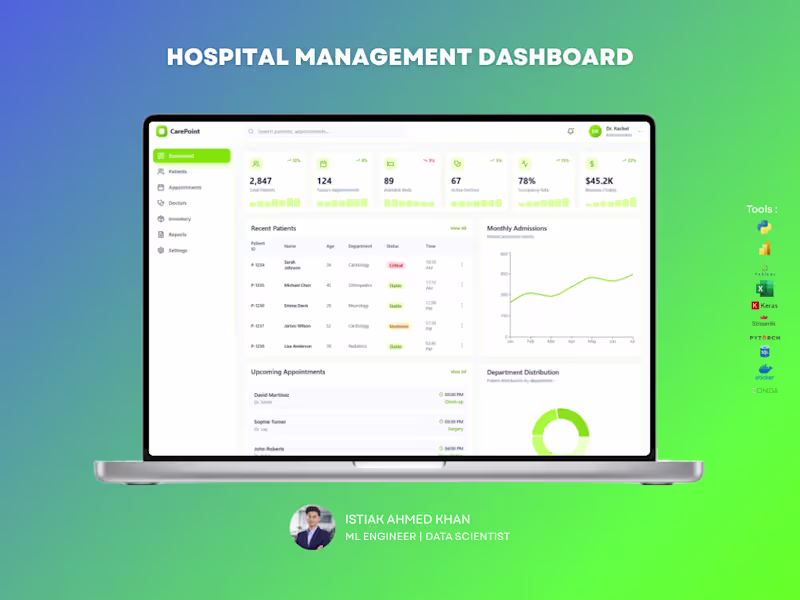
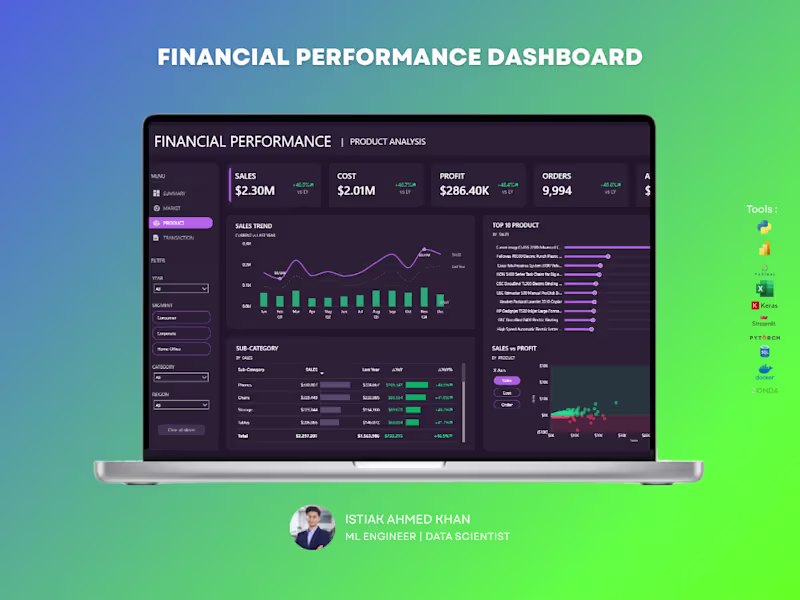
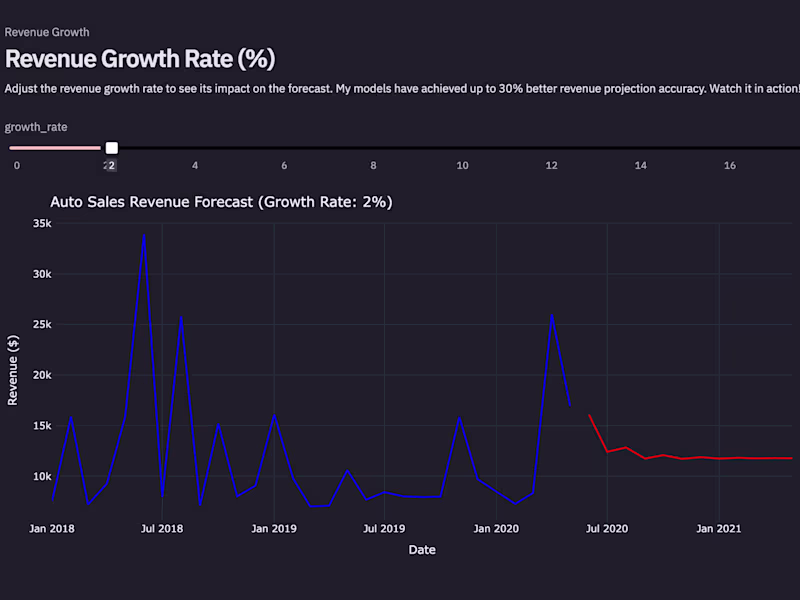
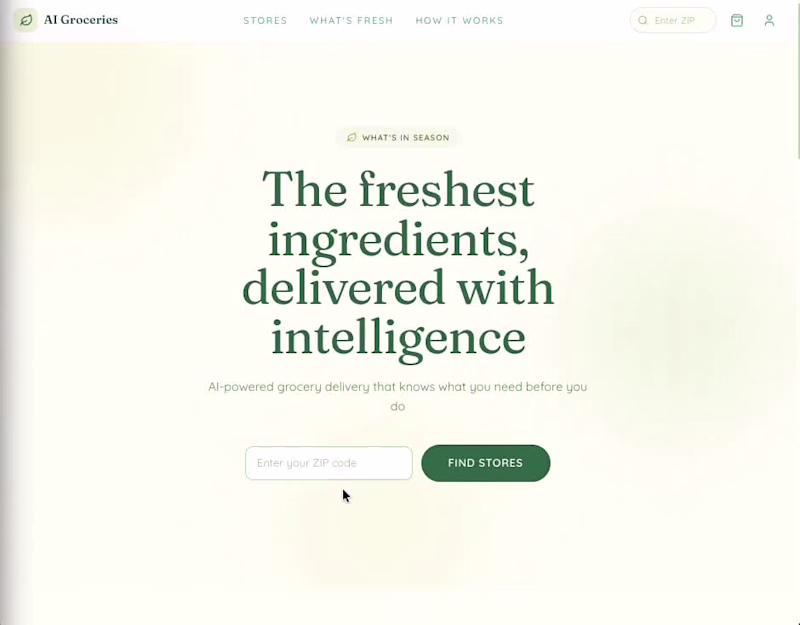
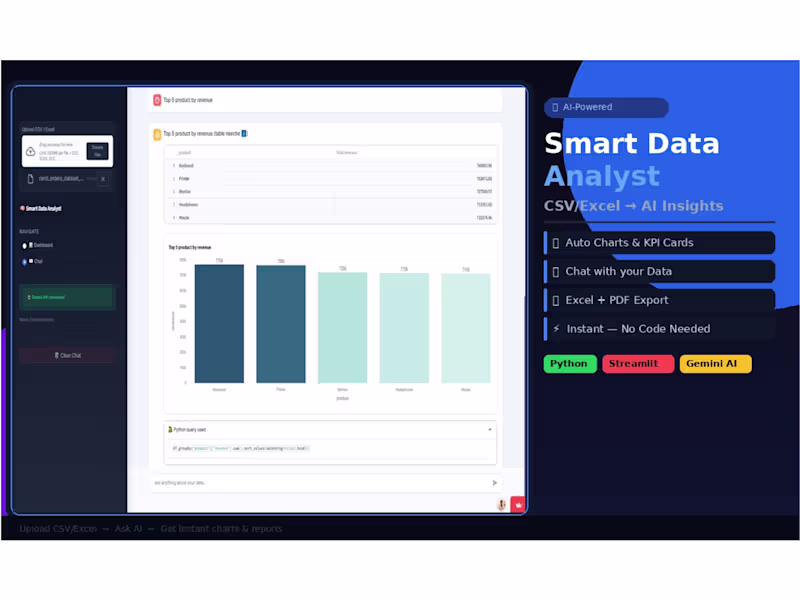
I build AI-powered data apps and dashboards

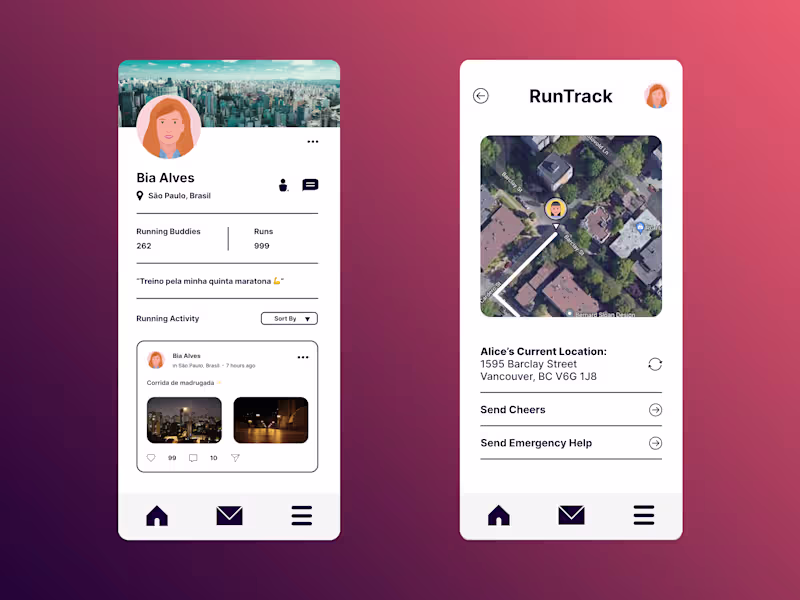
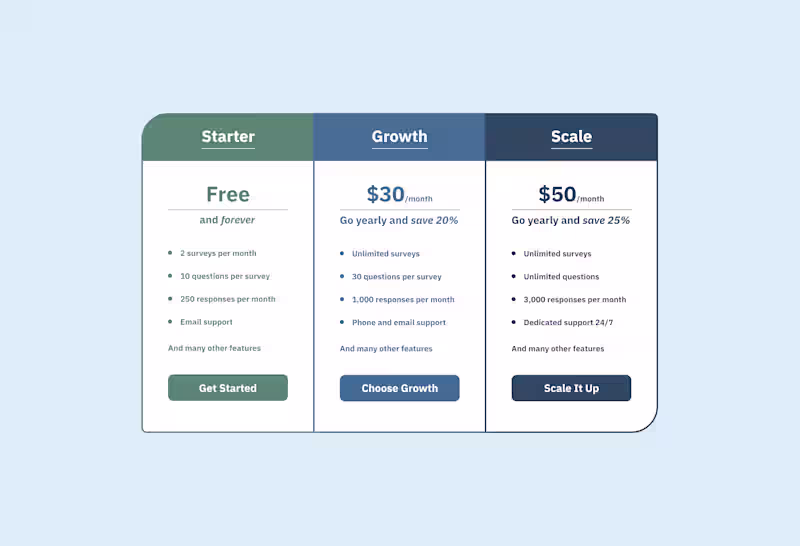
UI/UX Designer & Researcher | Market Research Background
- 18
- Followers
UI/UX Designer & Researcher | Market Research Background

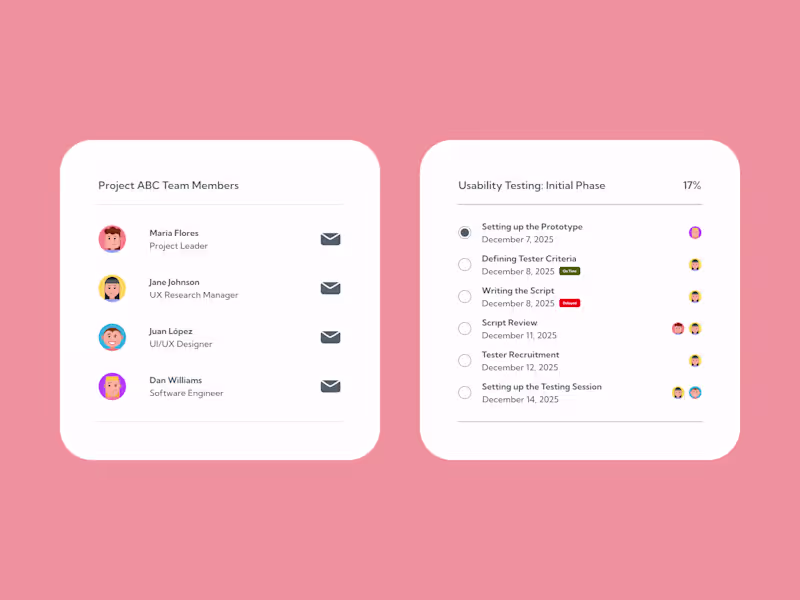
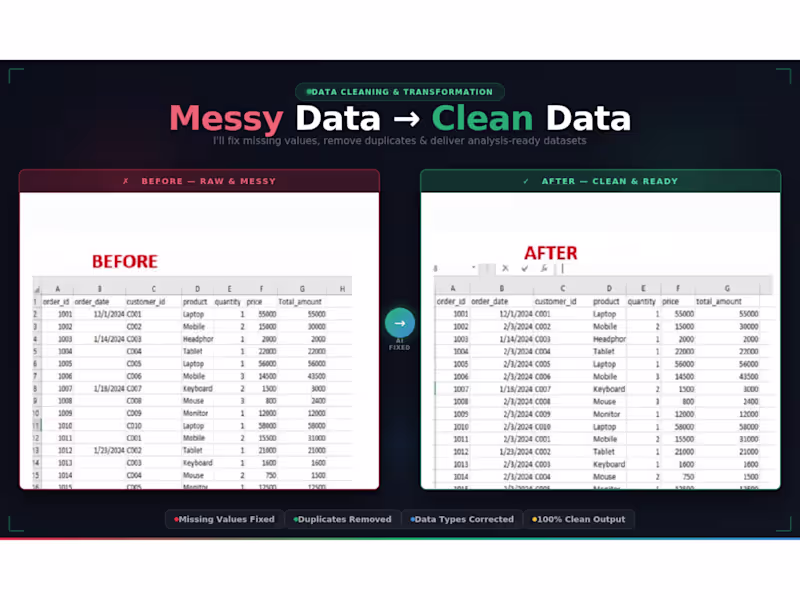
Data Analyst provided data driven decisions to stakeholders.


Data Science | Mathematics Tutor| AI Automations
Data Science | Mathematics Tutor| AI Automations
View more →