Data Visualization Projects in Telangana
Data Visualization Projects in Telangana
Sign Up
Post a job
Sign Up
Log In
Filters
2
Projects
People
Message
2
Geethasree Naguboina
pro
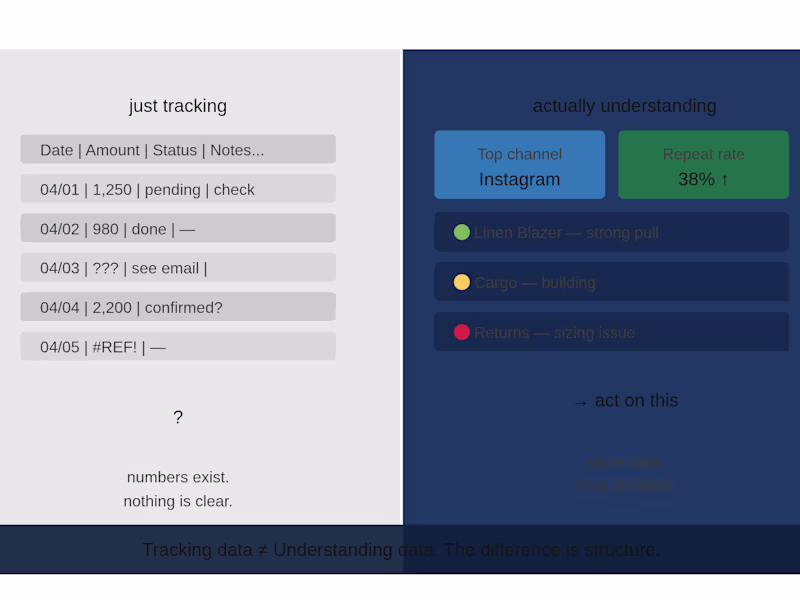
Title: The difference between tracking data and understanding it Most businesses are tracking data. Very few are understanding it. There is a difference — and it shows up in how decisions get made. Tracking data means you have numbers somewhere. A spreadsheet updated every week. A report sent every month. An export sitting in someone's downloads folder. Understanding data means those numbers tell you something specific. This channel is growing. This SKU is draining margin. This client segment is not renewing. Something you can act on before it becomes a problem. The gap between the two is almost never about having more data. It is about structure. Unstructured data gives you a feeling that things are being measured. Structured data gives you a direction. I work with founders and business owners who have plenty of the first and very little of the second. The fix is usually simpler than they expect — not a new software, not a bigger team. Just a cleaner system around the data they already have. If your numbers are being tracked but not really being used — that is the gap worth closing first.
2
147
Message
1
Mujtaba Quadri
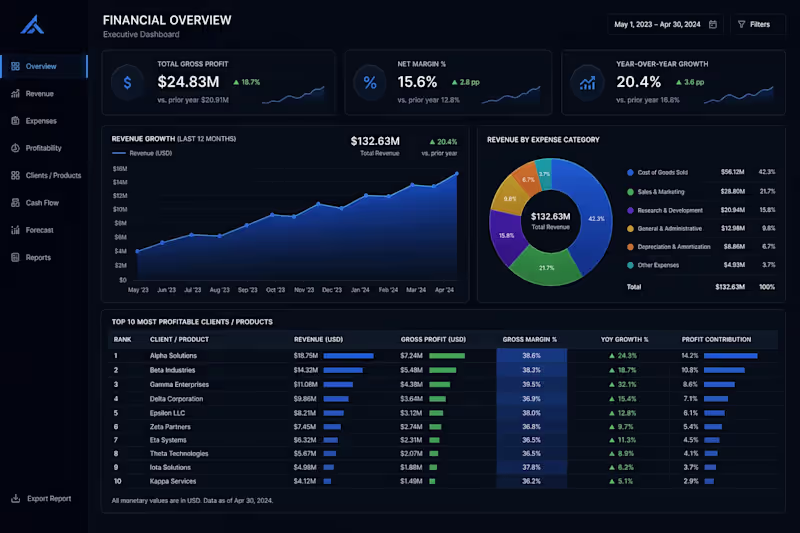
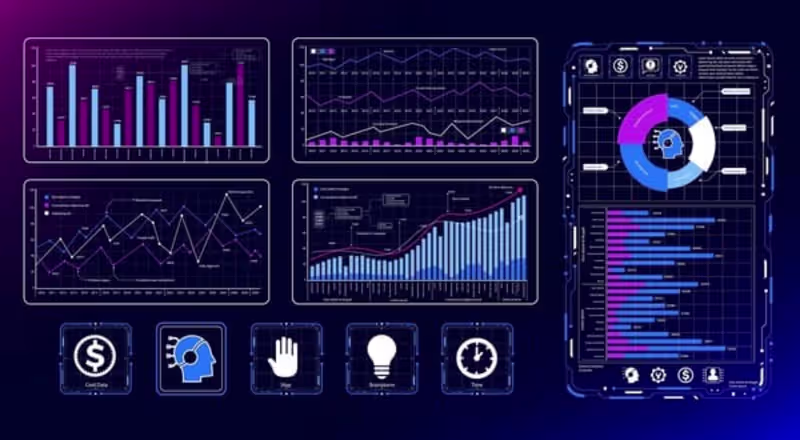
This Project Involved The Development Of A Comprehensive Financial Intelligence Suite Designed To Monitor Corporate Fiscal Health And Strategic Growth Metrics. Utilizing A Unified Data Model Engineered Through Complex SQL Aggregations, The System Integrates Disparate Transactional Streams Into A High-Fidelity Executive Dashboard. The Analysis Focuses On Critical Performance Indicators Including Total Gross Profit ($24.83M), Net Margins (15.6%), And Year-Over-Year (YoY) Revenue Trends. By Implementing Dynamic Profit Contribution Models And Expense Categorization, The Project Provides Stakeholders With Granular Visibility Into Net Profitability Across The Entire Client Portfolio, Facilitating Data-Driven Resource Allocation And Identifying A 20.4% Sustained Growth Trajectory.
1
60
Message
0
Krishna Chaitanya Mukundala
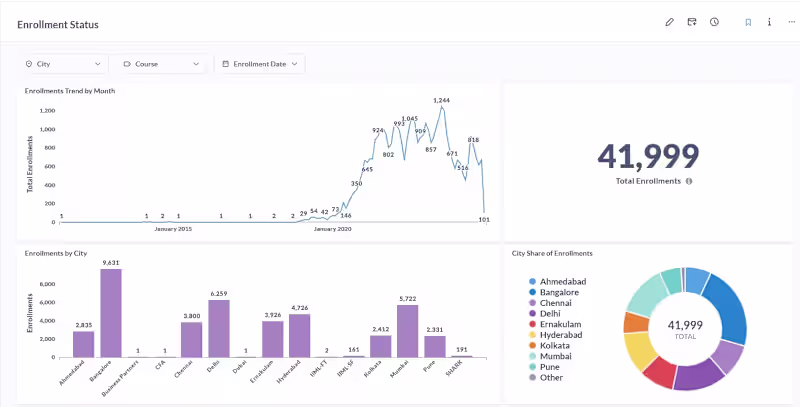
Metabase Dashboards for Edtech
0
15
Message
0
Rakesh Ranjan
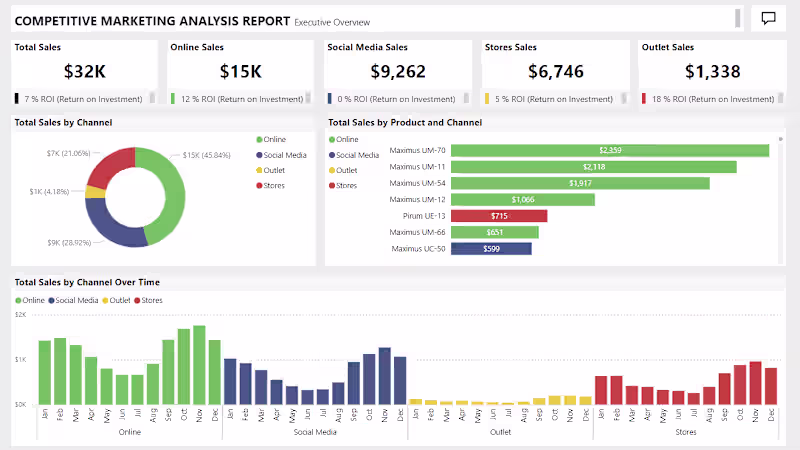
Sales Channel Analysis
0
1
Message
0
Shaik Nawaz
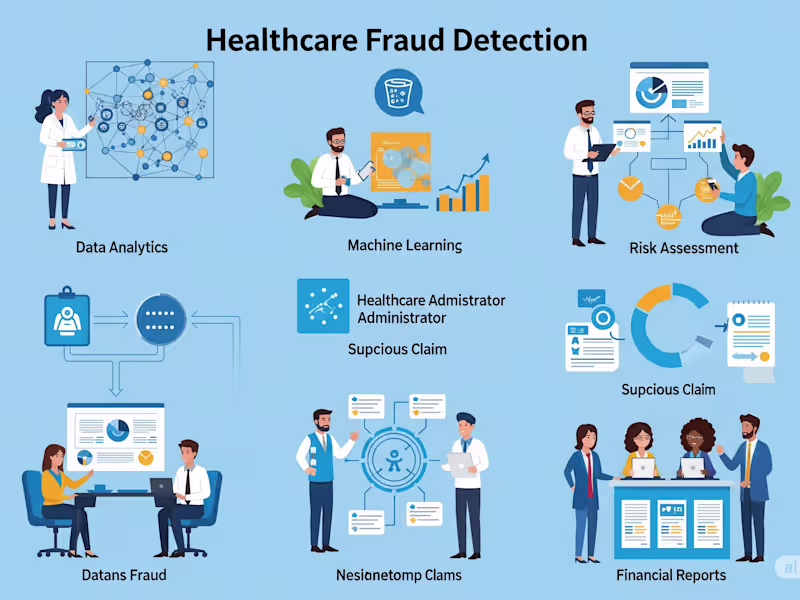
Healthcare Provider Fraud Detection
0
2
Message
0
Vikas Devarakonda
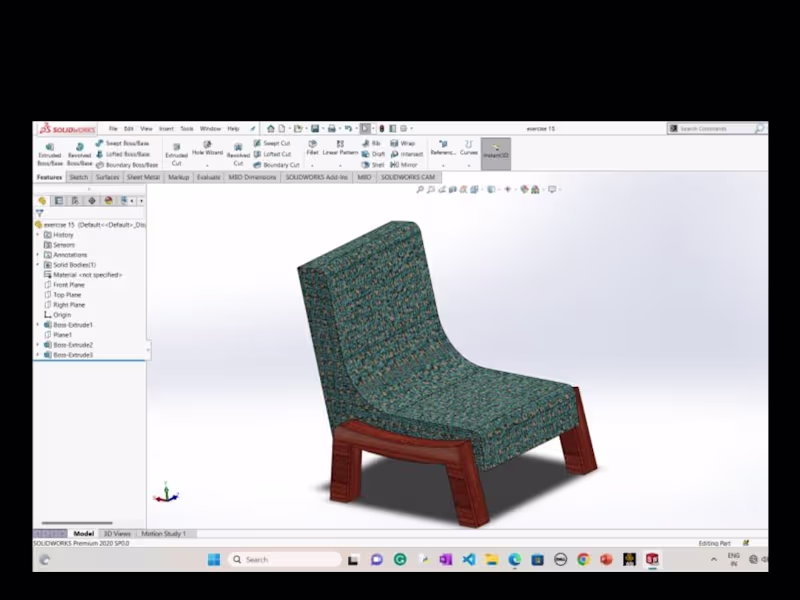
Designing and Architecture.
0
0
Message
0
MOHAMMED ABDUL RAFAY IMRAN KHAN
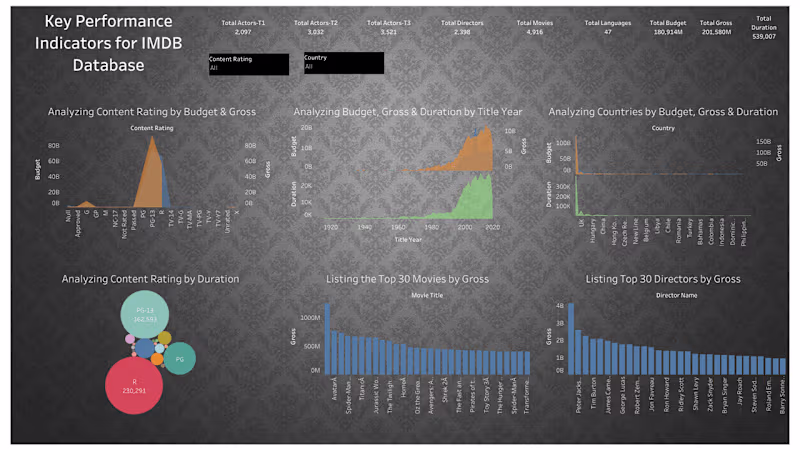
Data Analysis of IMDB KPI's
0
0
Message
1
Suhani kapoor
mental health survey.ipynb
1
0
Message
0
Raju Krovidi
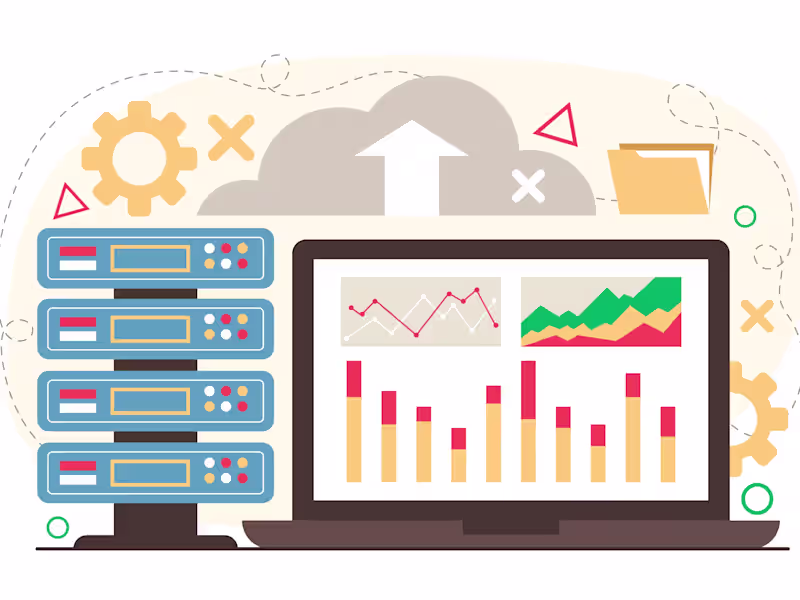
Datawarehouse & Analytics
0
0
Message
0
srinivas varada
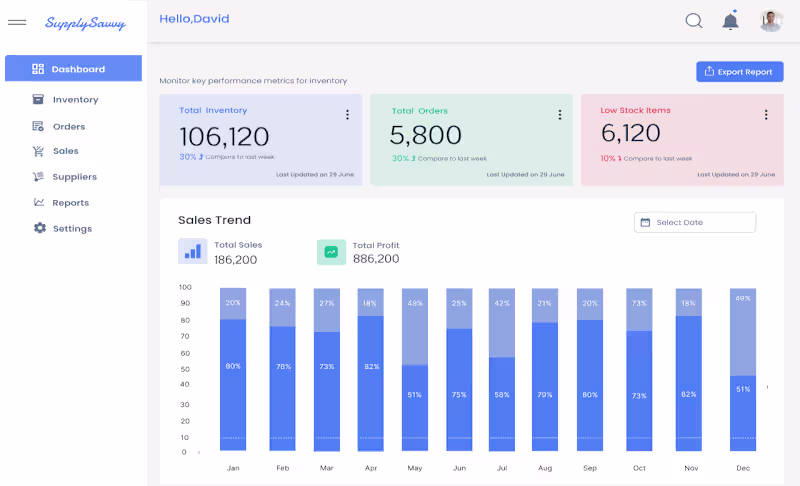
Inventory Management Dashboard – UI/UX Case Study
0
0
Message
5
Geethasree Naguboina
pro
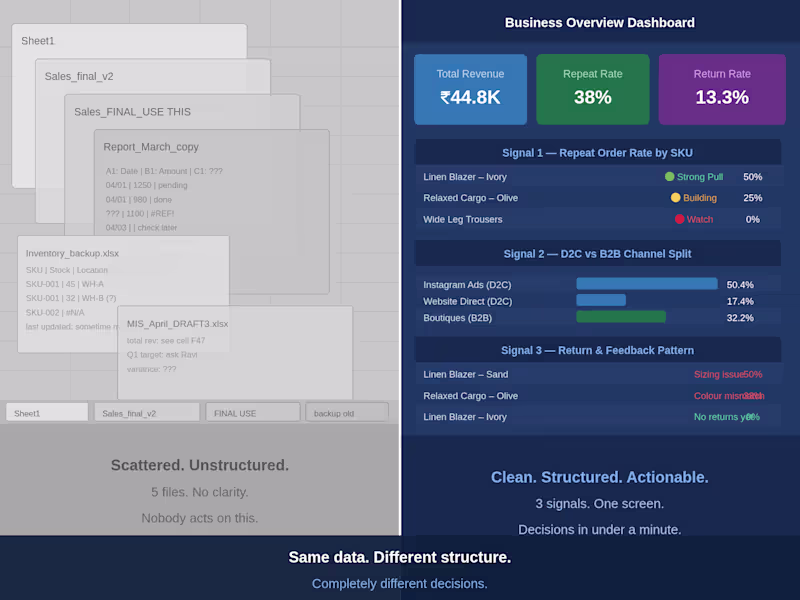
Title: Your data is not the problem. The structure is. Most business owners I speak to are not short on data. They have spreadsheets. Exports. Reports sent every month. Numbers sitting in three different files that nobody looks at after the first week. The real problem is not missing data — it is data that cannot be read quickly enough to change a decision. A 5,000 row export tells you nothing at a glance. But a single dashboard showing revenue by channel, top performing SKU, and pending payments — that changes how a founder spends the next hour. I have seen this pattern across CA firms, D2C brands, and small businesses. The data exists. The structure does not. Clean structure means: One place for all numbers Metrics linked to actual decisions Flags that tell you when something needs attention — not just what the current state is If your data lives in scattered sheets and nobody is acting on it, the issue is not the data. It is the system around it. That is exactly what I fix.
2
5
298
Message
1
Mujtaba Quadri
"I Developed An Automated Python Pipeline To Process And Categorize Over 1,000 Customer Reviews. Using The Pandas Library, I Built A Logic-Based Scoring System That Translates Raw Text Into Actionable Sentiment Insights, Helping Product Teams Identify Critical Issues In Real-Time."
1
88
Message
0
Krishna Chaitanya Mukundala
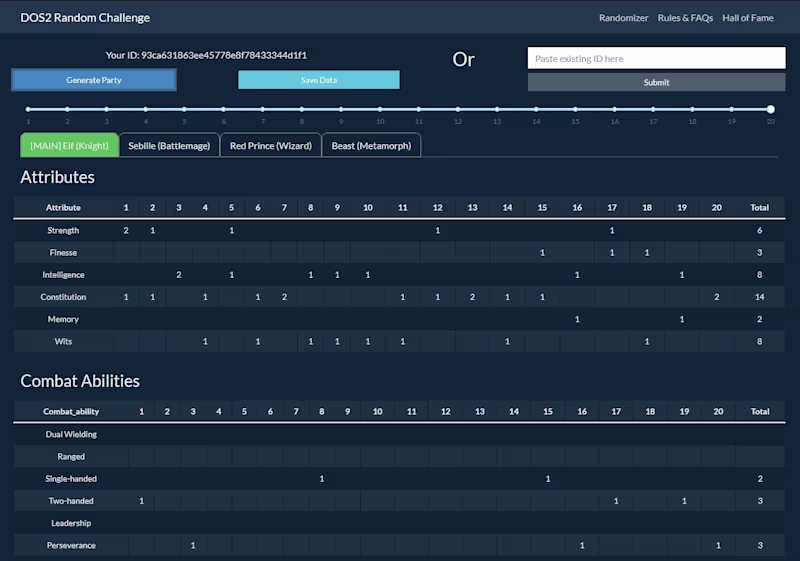
Randomizer for Game Challenge
0
5
Message
0
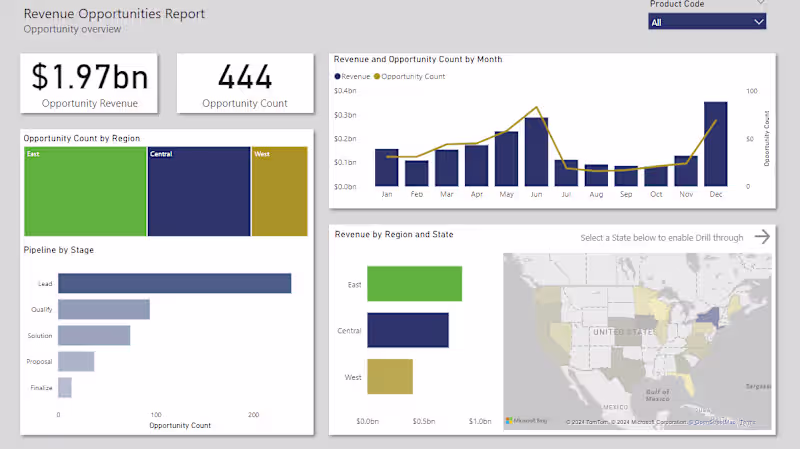
Rakesh Ranjan
Revenue Opportunity Summary
0
2
Message
0
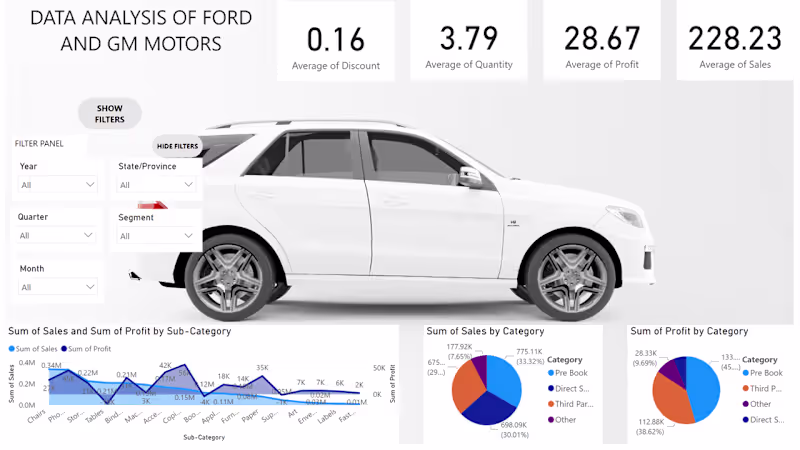
MOHAMMED ABDUL RAFAY IMRAN KHAN
Data Analysis of Cars
0
0
Message
6
Geethasree Naguboina
pro
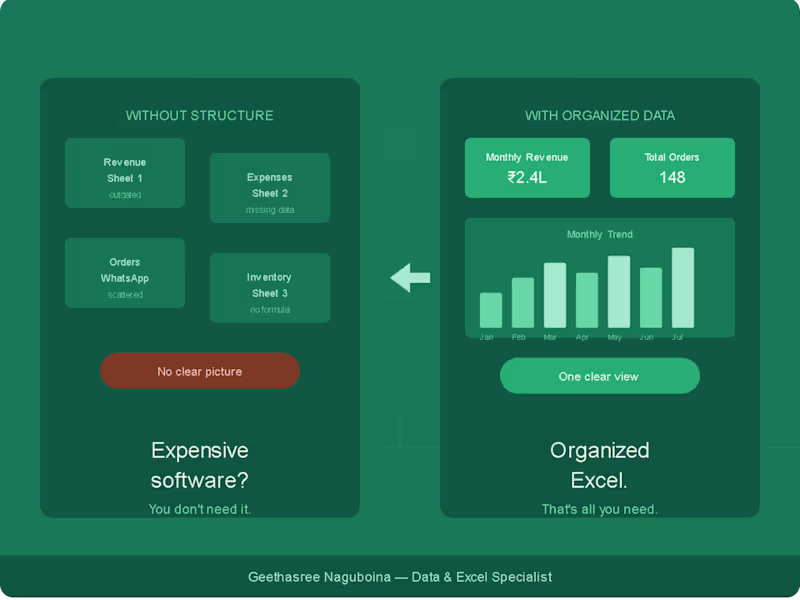
Most small business owners think they need expensive software to get their data under control. An ERP. A CRM. A dashboard platform. So they either spend lakhs on software they barely use — or they do nothing and keep drowning in scattered spreadsheets. Here's what I've seen actually work for small businesses: Not expensive software. Just organized data. A well-built Excel system can track your inventory, sales, expenses, and performance — all in one place. Clean. Automated. No monthly subscription. When I talk to founders and business owners, the most common situation I hear is: — Revenue tracked in one sheet — Expenses in another — Orders on WhatsApp — And no single view of how the business is actually doing The tool was never the problem. The structure was. If your data feels chaotic right now — you probably don't need new software. You need someone to organize what you already have. That's exactly what I do. Happy to build you a free sample dashboard based on your business — just drop a comment or DM me.
2
6
192
Explore projects