Projects using Microsoft Power BI in SindhProjects using Microsoft Power BI in SindhSpotify Analysis Dashboard
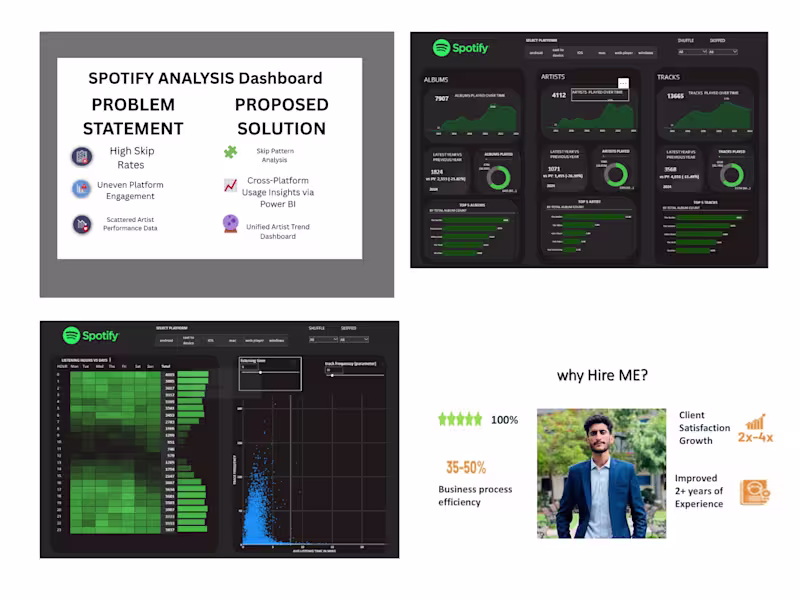
Turned raw Spotify streaming data into a clear, interactive dashboard that reveals how listeners actually engage with music.
Built in Power BI using SQL and DAX, this project explores user behavior across devices, identifies skip patterns, and highlights top-performing artists and tracks.
With dynamic visuals powered by key metrics like reason_start, reason_end, platform, and ms_played, the dashboard uncovers:
• Why users skip songs or stop playback
• Which platforms drive the most engagement
• Which artists and albums perform best by time and device
Perfect for music analysts, record labels, or streaming teams who want actionable insights into listener habits and engagement trends.