
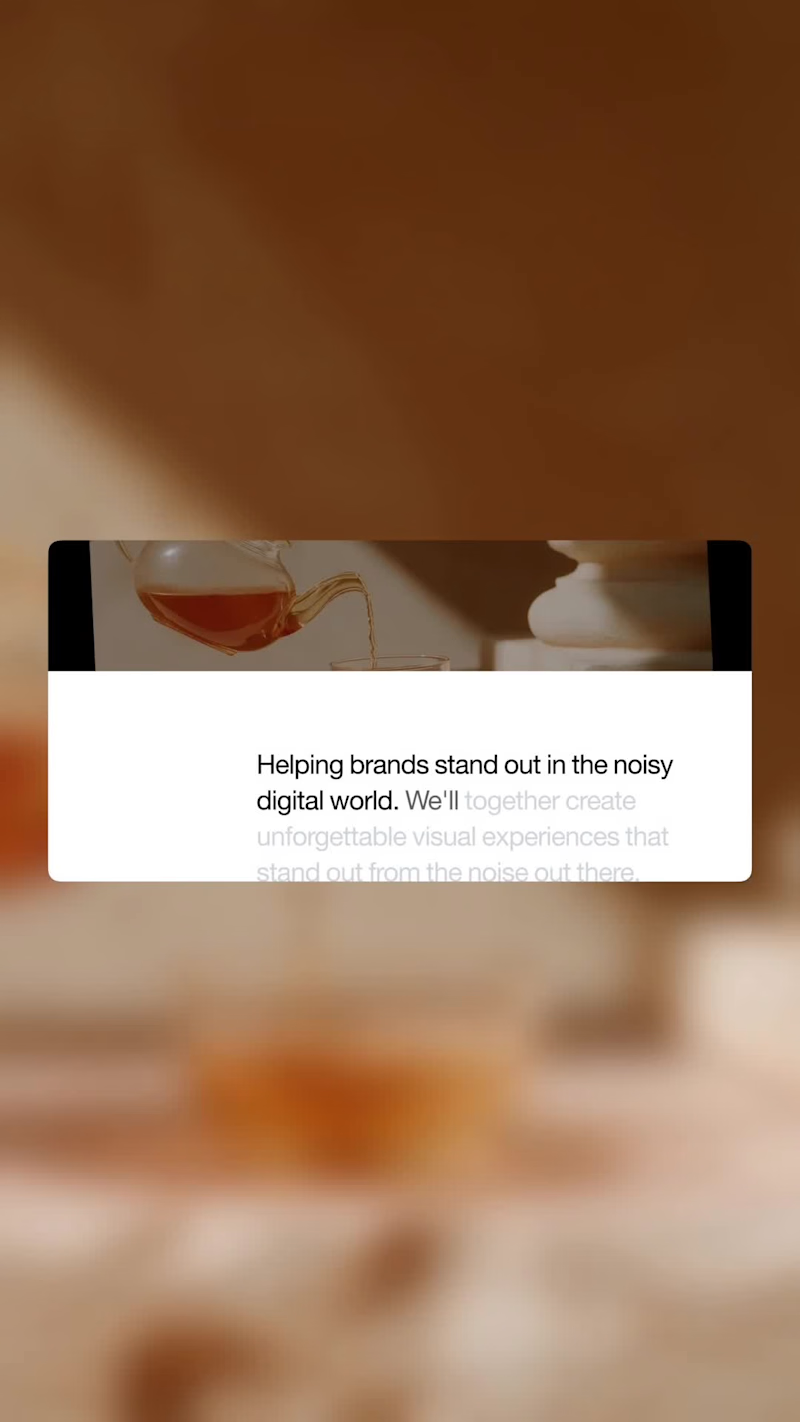
MARCA LUNA - Personal Project
The problem
Photographers and creatives have incredible portfolios.
But their websites feel dated.
Flat layouts. No soul. Slow performance.
The work gets lost in the noise
→ potential clients move on.
What we’ve built
We didn’t just build a gallery. We built an editorial experience.
✔️ 3D Perspective Transitions
✔️ Headless CMS Integration (Sanity.io (http://Sanity.io)) for real-time updates
✔️ Responsive, high-performance animations
✔️ Cinematic "Works" scroll interactions
✔️ A digital space that feels as premium as the work it holds
The result →
The work is no longer just "on a site." It’s in a gallery.
Clean code. Brutalist design. Performance that scales.
💭 What’s the biggest challenge you face when presenting your work online?
Lack of immersion? Speed issues? Design that doesn't fit the brand?
📌 Save this if you’re elevating your digital presence in 2026
🚀 checkout this passion project here: https://marc-luna-portfolio-pi.vercel.app/
0
67


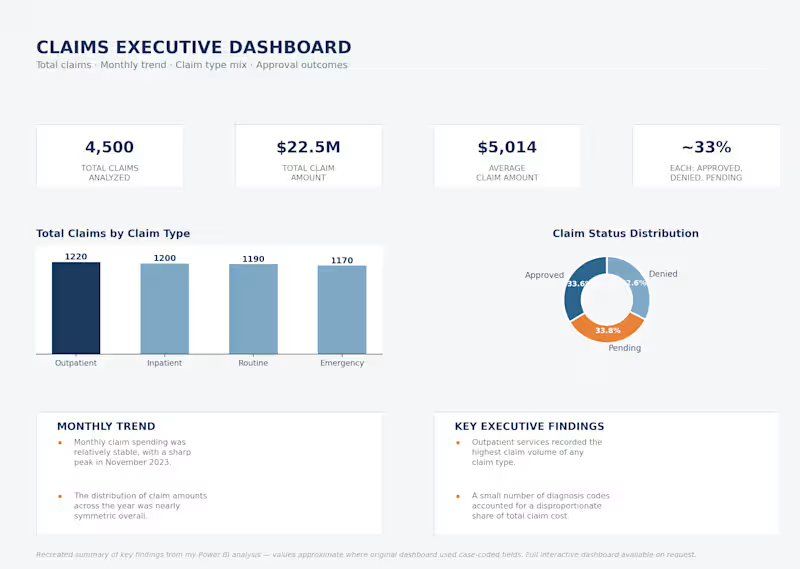
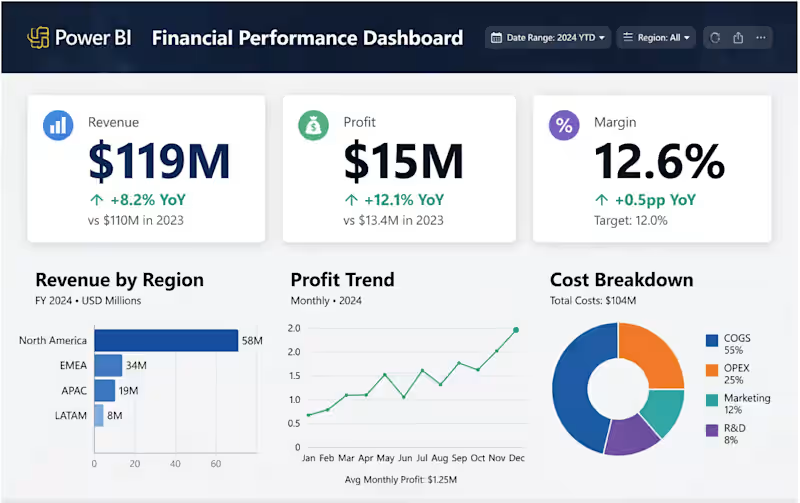
I ran statistical tests on 4,500 healthcare insurance claims worth $22.5M, half-expecting patient demographics to explain at least some of the cost variation.
They didn't. Age, income, gender, provider specialty, even claim type — none of it came back statistically significant against claim amount or status.
What actually stood out was Pediatrics. $4.9M in claims, the highest average claim amount of any specialty. Not a "who's filing the claim" problem — a specialty-specific one.
I built four Power BI dashboards (Executive, Patient Insights, Provider Performance, Claims Analysis) so this kind of pattern shows up as it happens, not just in a one-off report six months later.
If your team is still reviewing claims by demographic segment, this might be worth a second look.
0
19