Delivering Strategic Growth Through Data, Finance & Tech.
Presentations, Infographics & Graphic Design Pro
Presentations, Infographics & Graphic Design Pro


View more →
I will always meet your expectations on the fields stated
I will always meet your expectations on the fields stated


Expert Data Analyst & Academic Writer 📊✍️
Expert Data Analyst & Academic Writer 📊✍️

View more →
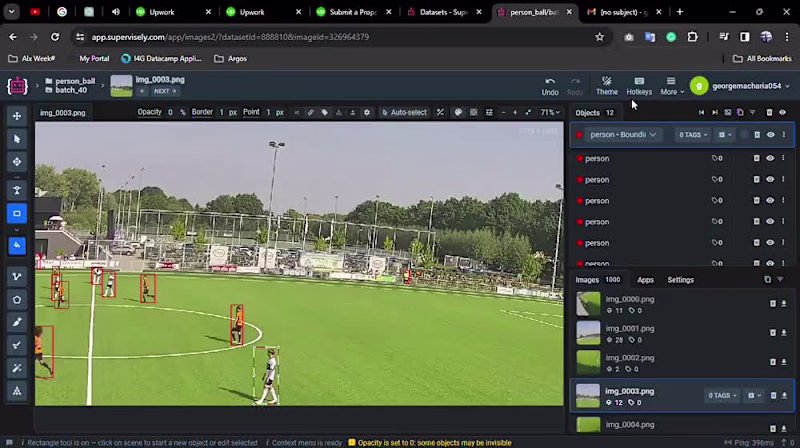
Data Annotator/Labeler for ML & AI
10yrs Data Science & Analytics Expert
10yrs Data Science & Analytics Expert


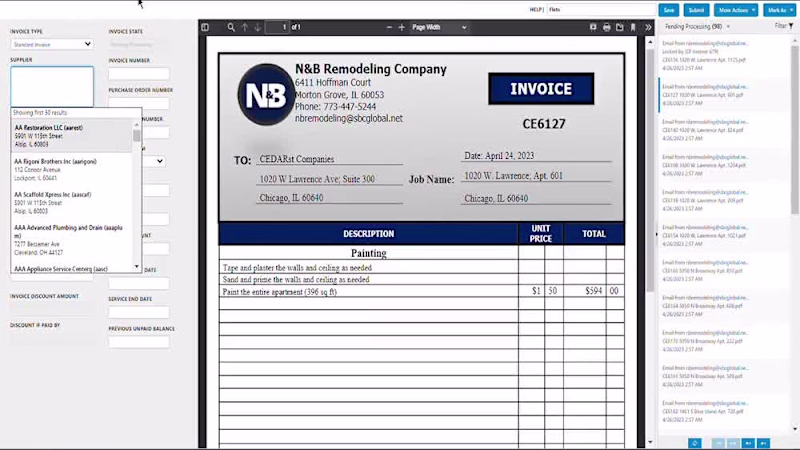
Financial Analyst,writer,Transcriptionist
Financial Analyst,writer,Transcriptionist