Freelance Data Engineers in Nairobi CountyFreelance Data Engineers in Nairobi County
Data Engineer/Analysis Expert 📊
Passionate Technical Writer & Data Specialist
Delivering Strategic Growth Through Data, Finance & Tech.
8
Followers
Delivering Strategic Growth Through Data, Finance & Tech.
Cover image for Alphabet Performance Analysis: What Business
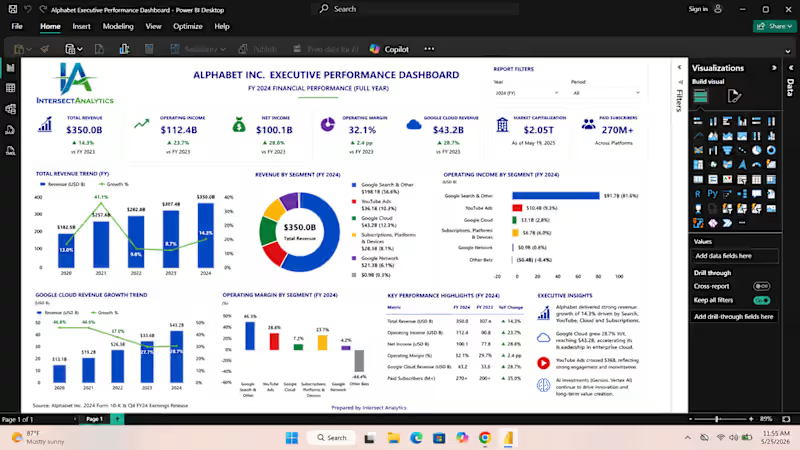
Alphabet Performance Analysis: What Business Leaders Can Learn From One of the World’s Most Successful Companies Prepared by Intersect Analytics | Business Intelligence, Financial Analysis & Automation Prepared by Intersect Analytics At Intersect Analytics, we analyzed Alphabet Inc.’s financial and operational performance using Python for data extraction and transformation and Power BI for dashboard development to understand how business segments contribute to growth, profitability, and long-term performance. Key Findings Google Search Remains the Core Revenue Driver Google Search & Other continues contributing the largest share of Alphabet’s revenue, maintaining its leadership in digital advertising and search services. Google Cloud Continues Strong Growth Google Cloud remains one of Alphabet’s fastest-growing business segments, supported by increased enterprise demand, AI adoption, and cloud infrastructure expansion. YouTube Strengthens Revenue Performance YouTube continues generating strong advertising revenue, reinforcing Alphabet’s ability to monetize digital engagement at scale. Profitability Remains Strong Despite major investments in AI, cloud infrastructure, and innovation, Alphabet continues maintaining strong operational performance and financial resilience. Diversified Revenue Supports Stability Alphabet benefits from multiple business segments across Search, Cloud, YouTube, Devices, and Emerging Ventures, strengthening resilience and reducing dependency on a single revenue source. Recommendations ✔ Improve performance visibility through real-time dashboards and KPI tracking. ✔ Invest strategically in high-performing business segments. ✔ Use automation and analytics to improve reporting speed and decision-making. ✔ Strengthen operational monitoring to identify inefficiencies early. How Intersect Analytics Helps Businesses We help organizations transform manual reporting into intelligent business systems through: 📊 Power BI Dashboards & Business Intelligence 📈 Financial Analysis & Performance Reporting 🐍 Python Data Scraping & Automation ⚙️ Excel & Google Sheets Automation 🔄 Business Process Automation 📉 Data Analytics & Strategic Insights Why Choose Intersect Analytics ✅ Business-focused solutions ✅ Executive-quality dashboards ✅ Automation-driven reporting ✅ Scalable analytics systems Because growth is driven by better visibility, faster decisions, and intelligent execution. INTERSECT ANALYTICS Decisions Backed by Data. Growth Driven by Insight. 📞 +254 723 632 207
1
2
74
Cover image for 🚗 Executive Automotive Industry Intelligence
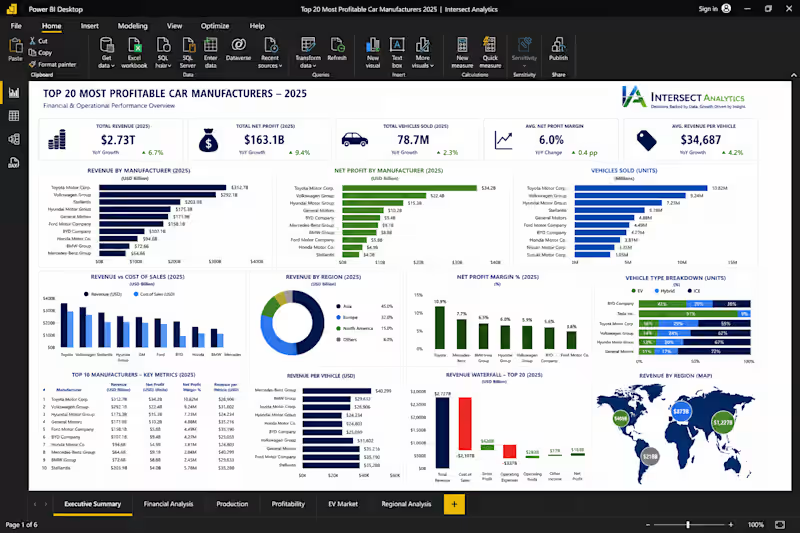
🚗 Executive Automotive Industry Intelligence — Powered by Power BI How do the world's leading automotive manufacturers compare when it comes to revenue, profitability, production, and market performance? At Intersect Analytics, we developed this executive Power BI dashboard to transform complex automotive industry data into a single source of truth for strategic decision-making. 📊 Executive Insights Our analysis revealed several key industry trends: 🏆 Toyota Motor Corporation continues to lead the global automotive market, generating the highest revenue while maintaining exceptional profitability and vehicle production volumes. 📈 Volkswagen Group remains one of the strongest global competitors, demonstrating consistent revenue growth and a diversified international market presence. ⚡ BYD has emerged as one of the fastest-growing manufacturers, driven by rapid expansion in electric vehicle production and increasing global demand. 💰 While several manufacturers generate significant revenue, profit margins vary considerably, highlighting differences in operational efficiency, manufacturing costs, and pricing strategies. 🌍 Asian manufacturers continue to dominate the global automotive industry, contributing the largest share of revenue and vehicle production compared to Europe and North America. 🚘 The transition toward electric and hybrid vehicles is reshaping the competitive landscape, with manufacturers investing heavily in next-generation mobility technologies. 📉 Comparing Revenue against Cost of Sales reveals that companies with stronger cost control consistently deliver higher profitability despite operating in the same competitive environment. 📊 Revenue per vehicle varies significantly across manufacturers, reflecting differences in brand positioning, product mix, and premium versus mass-market strategies. What This Dashboard Delivers ✔ Executive KPI Scorecards ✔ Revenue & Profitability Benchmarking ✔ Global Vehicle Sales Analysis ✔ Regional Performance Comparison ✔ Revenue vs Cost Analysis ✔ Net Profit Margin Analysis ✔ EV, Hybrid & ICE Market Breakdown ✔ Interactive Geographic Performance Mapping ✔ Executive-ready Multi-page Reporting Our Services At Intersect Analytics, we help organizations transform raw business data into executive intelligence through: ✅ Power BI Dashboard Development ✅ Financial Analytics & Executive Reporting ✅ Business Intelligence Solutions ✅ Excel & Google Sheets Automation ✅ SQL Data Modeling & ETL ✅ Power Query & DAX Optimization ✅ KPI Scorecards & Performance Monitoring ✅ Predictive Analytics & Decision Support Every dashboard we build is designed to help leaders move beyond reporting—to uncover trends, optimize performance, and make confident, data-driven decisions. 📊 Decisions Backed by Data. Growth Driven by Insight. If your organization is ready to unlock the full potential of its data, let's build a solution tailored to your business.
0
8
Cover image for 📊 GLOBAL AI STOCK MARKET
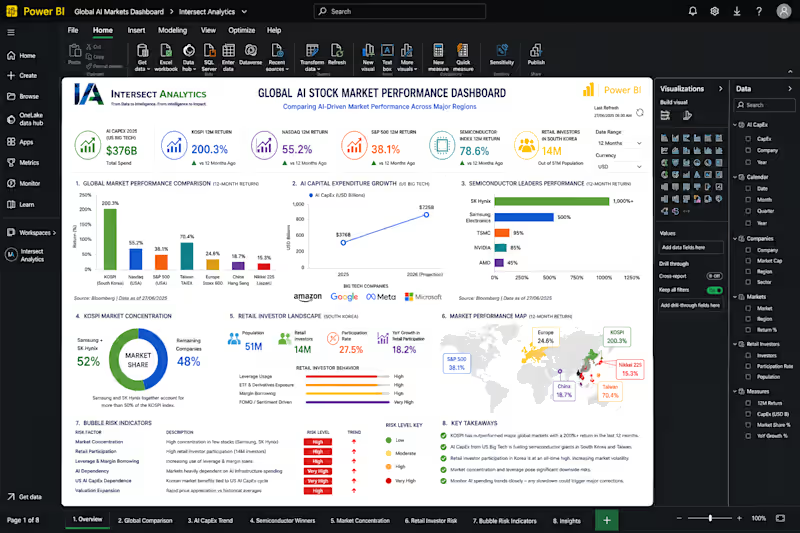
📊 GLOBAL AI STOCK MARKET PERFORMANCE DASHBOARD Artificial Intelligence is no longer influencing individual companies alone — it is reshaping entire financial markets. At Intersect Analytics, we developed this interactive Global AI Stock Market Performance Dashboard to analyze how AI investment is driving market performance across the United States, South Korea, Taiwan, Europe, China, and Japan. Our analysis highlights several key findings: ✅ South Korea's KOSPI significantly outperformed many major global markets, driven largely by AI-related semiconductor companies. ✅ Massive AI capital expenditure by major US technology companies continues to fuel global semiconductor demand. ✅ Market concentration risk is increasing, with a small number of companies accounting for a significant share of market performance. ✅ Retail investor participation has reached historic levels in some markets, increasing both opportunity and risk. ✅ AI infrastructure spending is becoming one of the strongest drivers of global equity markets. How We Built This Solution This dashboard was developed using a complete Business Intelligence workflow: • Data collection and market research • Data transformation and modeling • Power Query data preparation • DAX calculations and performance measures • KPI development and financial analysis • Geographic and market visualization • Risk assessment and investment analysis • Executive dashboard design in Power BI Services Delivered by Intersect Analytics 📈 Power BI Dashboard Development 📊 Financial & Market Analytics 🤖 Business Intelligence Solutions ⚙️ Data Modeling & Automation 📉 Executive Reporting & KPI Design 🗄️ Power Query & DAX Optimization 🌍 Economic & Market Intelligence Dashboards ☁️ Data Integration & Analytics Infrastructure At Intersect Analytics, we help businesses, investors, and organizations transform complex data into clear insights that support better decisions. DECISIONS BACKED BY DATA. GROWTH DRIVEN BY INSIGHT. #PowerBI #BusinessIntelligence #DataAnalytics #FinancialAnalytics #ArtificialIntelligence #StockMarket #DashboardDesign #DataVisualization #InvestmentAnalytics #BusinessGrowth
0
15
Technical writer and developer advocate AI/ML
Data Analyst skilled in SQL, Python, and Power BI, transform