Creating a Stock Market Analysis Bokeh Web App
Armstrong Asenavi
Creating a Stock Market Analysis Bokeh Web App
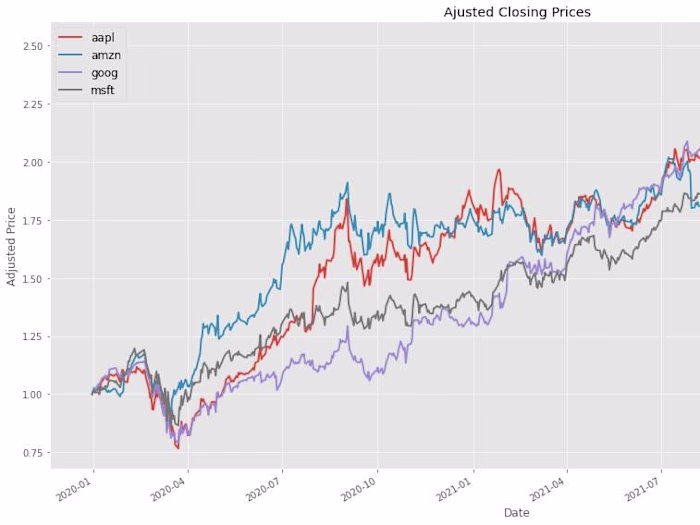
In this section, we will show you how to create a simple web app and deploy it for financial analysts to use. The web app will provide a solution to the case study in finance detailed above. This web app allows users to select two stock tickers and visualize their descriptive statistics (such as mean and standard deviation) of both prices and returns, correlation plots, and price trend charts for the selected stocks. Interactivity is created by enabling the selection of a combination of different tickers and different time periods (on the price trend charts). Take a look at the web app here:
Like this project
Posted Feb 11, 2023
The tutorial will show you how to create a simple web app and deploy it for financial analysts to use.