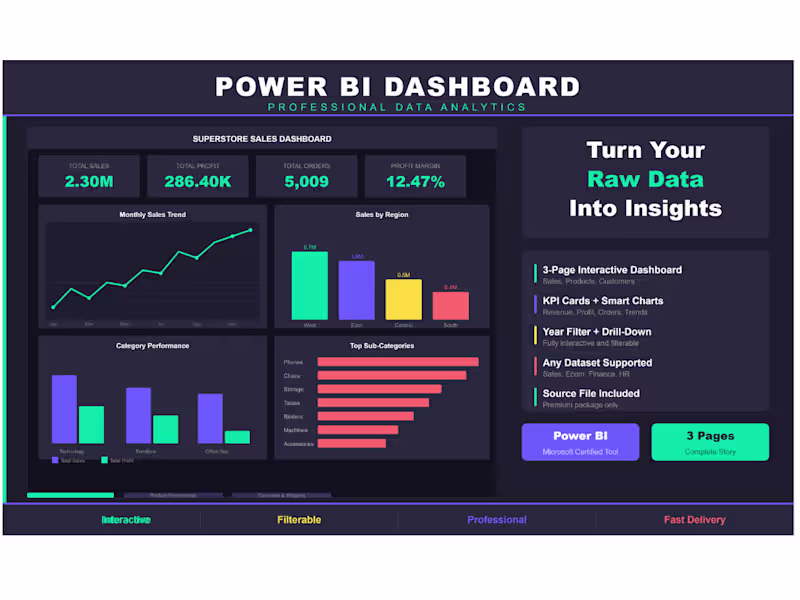
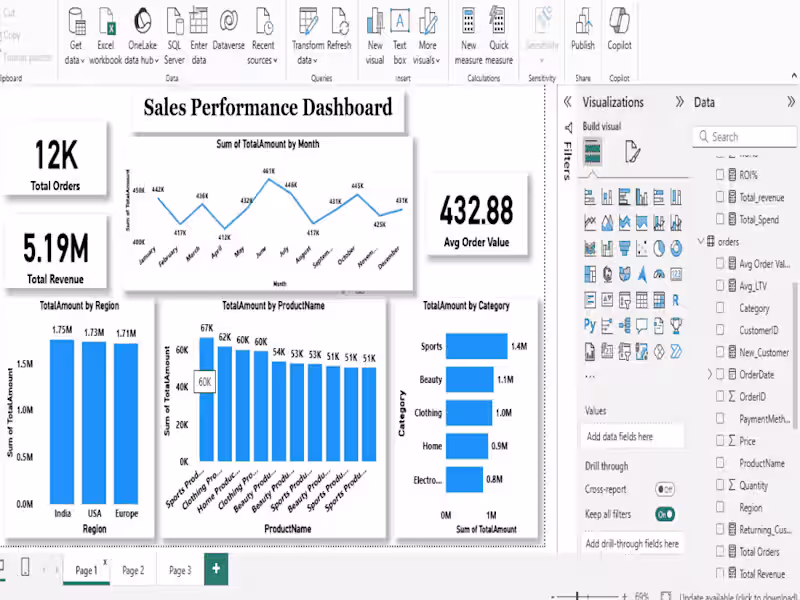
Projects using Microsoft Power BI in MumbaiProjects using Microsoft Power BI in MumbaiSuperstore Sales Dashboard — 3-Page Power BI Report
Built an interactive 3-page Power BI dashboard using
the Superstore Sales dataset (9,994 orders across USA).
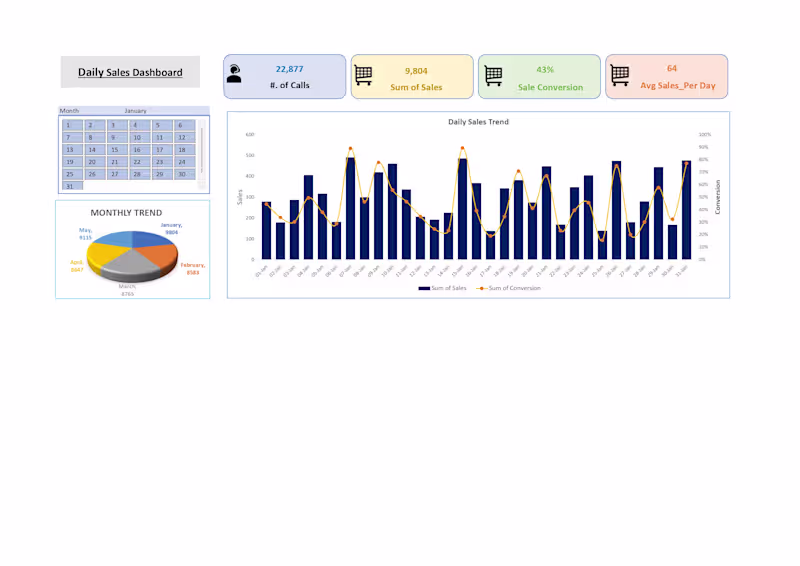
Page 1 — Sales Overview: KPI cards, monthly trend,
regional breakdown, category performance.
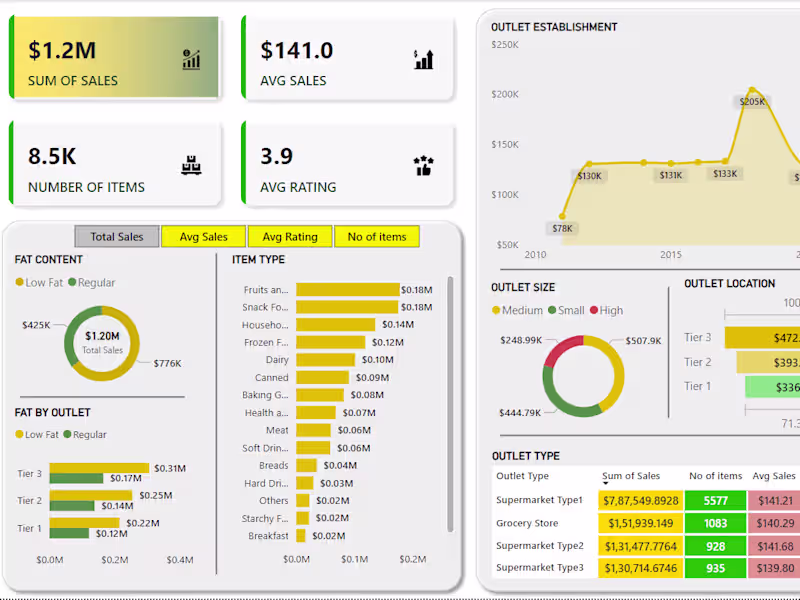
Page 2 — Product Performance: Top products, category
donut, profit analysis, sales vs profit scatter.
Page 3 — Customer & Shipping: Segment breakdown,
top 10 customers, monthly growth, ship mode distribution.
Tools: Power BI, DAX, Superstore Dataset
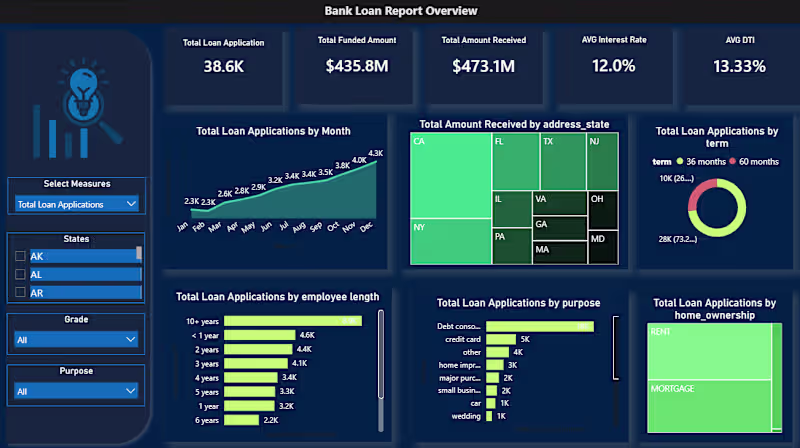
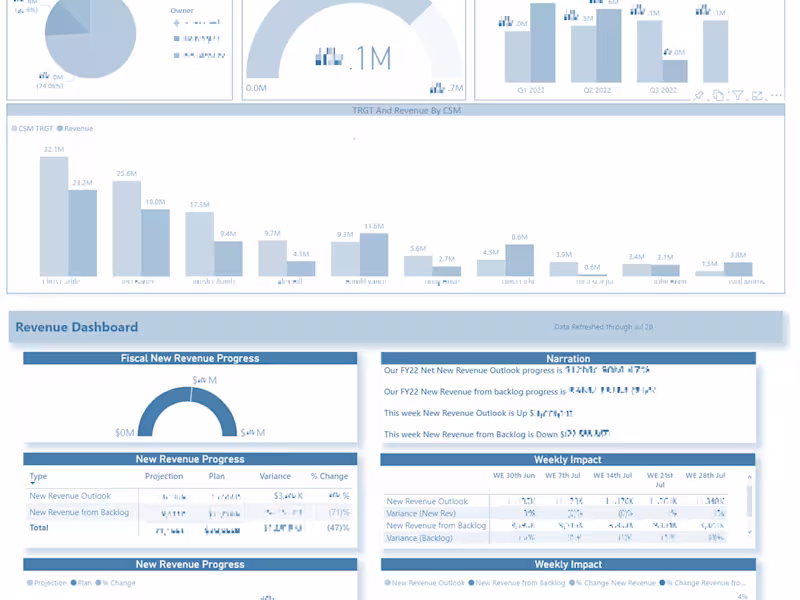
Theme: Dark professional with interactive year filter. 🏦 Bank Loan Portfolio Analysis | Power BI Dashboard Project
Analyzed 38,576 loan records across 50 states to give a bank's lending division a unified view of portfolio health — something they simply didn't have before.
What the data revealed:
✅ Net-positive portfolio: $435.8M disbursed, $473.1M recovered
⚠️ 13.8% bad loan rate = $28.25M net capital loss
📊 Debt consolidation drives nearly half of all loan applications
⏳ 73% of borrowers chose 60-month terms over 36-month
📍 60%+ of repayments concentrated in just 5 states (CA, NY, FL, TX, NJ)
Tools used: PostgreSQL → Excel → Power Query → Power BI + DAX
Built two interactive dashboards:
→ Summary: KPI cards, good vs. bad loan segmentation, loan status grid
→ Overview: Trends, geographic maps, term/purpose/employment breakdowns
The next phase? Building a predictive risk scoring layer using DTI, interest rate, and employment length to flag at-risk loans before they default.
Open to feedback from data folks in the community 👇
#PowerBI #DataAnalytics #SQL #DAX #BankingAnalytics #PortfolioAnalysis #DataVisualization