Freelancers using Grafana in Lahore
Sign Up
Post a job
Sign Up
Log In
Filters
2
Projects
People
abdullah masood
Lahore, Pakistan
AI & Full-Stack Engineer | Building Production AI SaaS, APIs
New to Contra
Follow
Message
AI & Full-Stack Engineer | Building Production AI SaaS, APIs
1
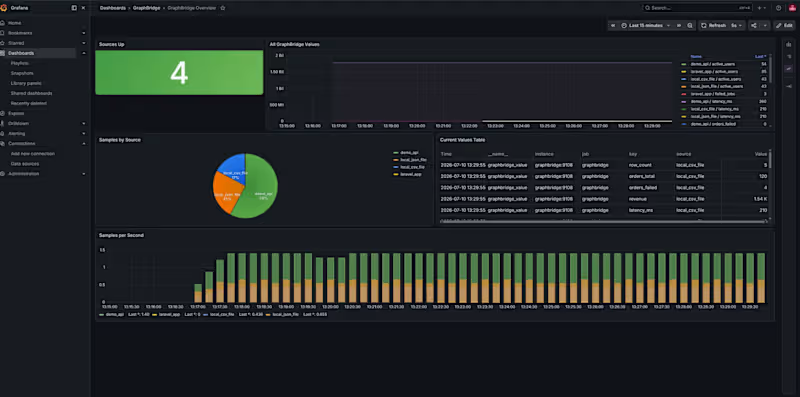
π Introducing GraphBridge β Turn JSON into Grafana Dashboards One thing I've noticed while working on different projects is that applications already have valuable metrics, but getting those metrics into Grafana often requires exporters, custom integrations, or additional setup. I wanted something much simpler. So I built GraphBridge. The idea is straightforward: Your Application β Send JSON β GraphBridge β Prometheus β Grafana Instead of writing custom exporters, your application simply sends JSON metrics to GraphBridge. For example: { "active_users": 85, "orders_today": 42, "revenue_today": 9840, "failed_jobs": 3, "latency_ms": 210 } GraphBridge automatically converts the data into Prometheus metrics, making it immediately available for Grafana dashboards. Current features β JSON Webhook API β REST API polling β JSON & CSV data sources β Prometheus /metrics endpoint β Docker Compose deployment β Auto-configured Grafana dashboard β Example integrations for Laravel, FastAPI, Node.js, and custom applications Possible use cases β’ Application monitoring β’ Queue & background job metrics β’ Business dashboards β’ API performance monitoring β’ FFmpeg streaming statistics β’ IoT sensor metrics β’ Internal analytics β’ Custom operational dashboards The goal is simple: Send JSON. Visualize everything. This is the first public MVP, and I'm planning to continue improving it with additional integrations and monitoring templates. I'd love your feedback and suggestions! β GitHub: https://lnkd.in/dAYdNJxg
1
80
1
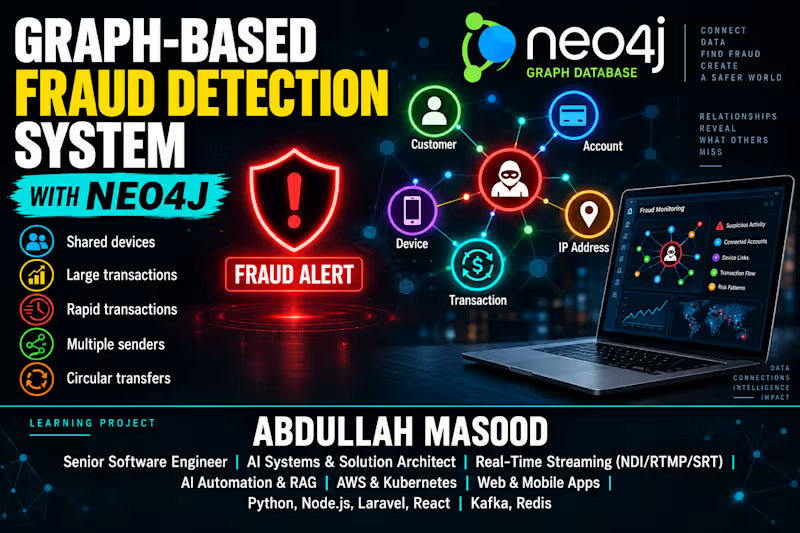
π Building a Graph-Based Fraud Detection System with Neo4j A single transaction may look normal. Its connections can tell a different story. Iβm building a learning project using Neo4j and Cypher to explore relationships between customers, accounts, transactions, and devicesβand flag patterns worth investigating. π Patterns Iβm exploring: β’ Multiple customers sharing the same device β’ Unusually large transactions β’ Rapid transactions within a short period β’ Multiple accounts sending money to one account β’ Circular transfers between connected accounts The focus is explainability: showing the relationships behind each flag so the suspicious activity is easier to understand. Through this project, Iβm strengthening my graph data modelling, Cypher queries, and rule-based detection skills. Next: FastAPI integration, transaction risk scores, fraud alerts, and an interactive monitoring dashboard. π οΈ Currently a learning prototype, with more updates coming as I build. What would you investigate first: shared devices or circular transfers? #Neo4j #GraphDatabase #FraudDetection #Cypher #BackendDevelopment #LearningInPublic
1
134
1
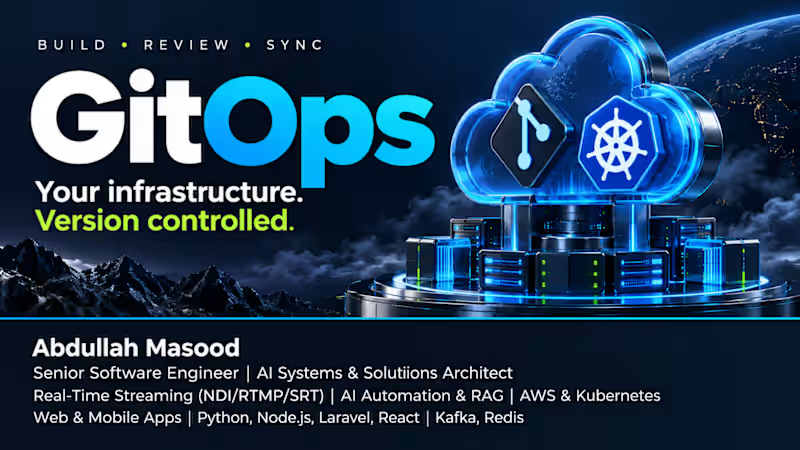
A Kubernetes deployment should be easy to trace: what changed, who changed it, and why. Thatβs what interests me about GitOps. With GitOps, the desired state of your infrastructure and applications lives in Git. Changes go through commits and pull requests, while a controller such as Argo CD or Flux continuously reconciles the running environment with that desired state. A typical workflow looks like this: β’ Build and test the application through CI. β’ Push the Docker image to a registry. β’ Update the image version in the Git configuration. β’ Review and merge the change. β’ Let the GitOps controller reconcile the cluster. The benefits go beyond automated deployments: β A versioned history of configuration changes β Reviewable changes before deployment β Visibility into configuration drift β A repeatable way to manage environments One important detail: reverting a Git commit can restore an earlier configuration, but database migrations and changes to application data still need their own recovery plan. For me, GitOps connects development and operations through a workflow both teams already understand: Git. Are you using Argo CD, Flux, or CI-driven deployments for your Kubernetes workloads?
1
171
1
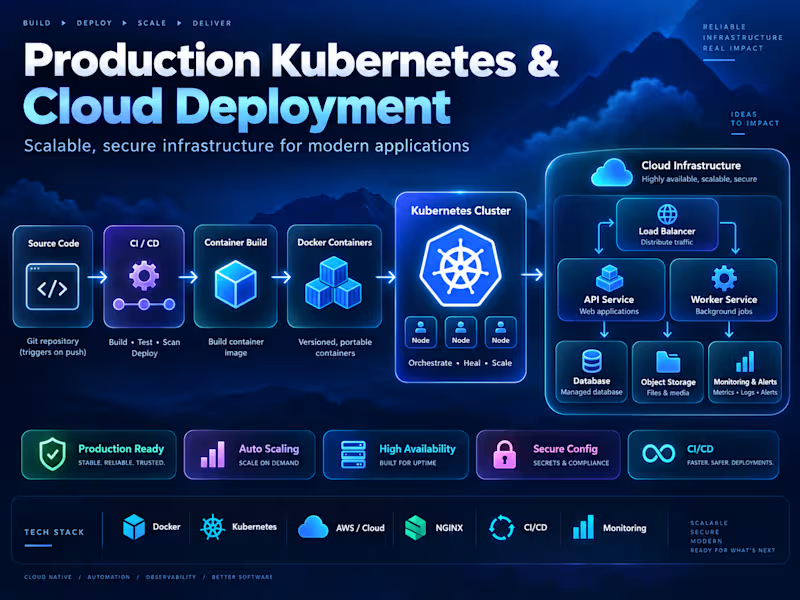
Production Kubernetes & Cloud Deployment
1
152
Grafana
(1)
Follow
Message
Shereen Hasnain
Lahore, Pakistan
DevOps Engineer | Docker, Kubernetes & CI/CD Specialist.
New to Contra
Follow
Message
DevOps Engineer | Docker, Kubernetes & CI/CD Specialist.
0
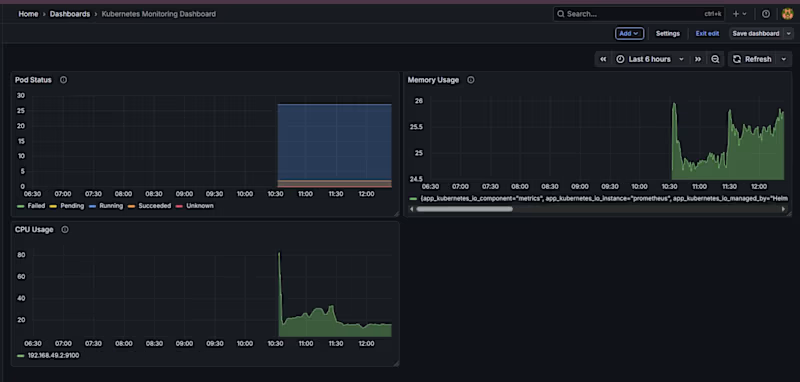
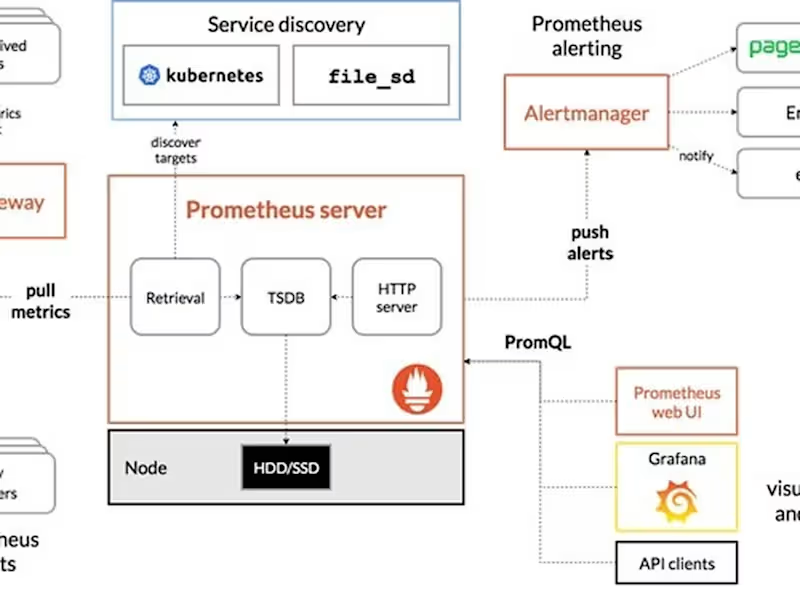
π Completed a Kubernetes Monitoring Project with Prometheus & Grafana As part of my DevOps learning journey, I completed a hands-on Kubernetes monitoring project where I deployed and monitored a Kubernetes environment using Helm, Prometheus, and Grafana. π§ Technologies Used: β’ Kubernetes & Minikube β’ Helm β’ Prometheus β’ Grafana β’ Node Exporter β’ Kube State Metrics π What I implemented: β’ Deployed Prometheus and Grafana using Helm β’ Monitored Kubernetes pods and services β’ Collected node and cluster metrics β’ Created a Grafana monitoring dashboard β’ Monitored CPU, memory, and pod status β’ Created PromQL queries for monitoring β’ Configured a High CPU Usage alert (CPU > 80%) β’ Verified deployments using kubectl get pods, kubectl get svc, and helm list πΈ Screenshots below show the actual implementation, including Kubernetes resources, Helm releases, Grafana dashboard, and alert configuration. This project helped me strengthen my understanding of Kubernetes monitoring, observability, Prometheus, Grafana, Helm, and alerting Currently continuing my journey toward becoming a Junior DevOps Engineer, focusing on Kubernetes, CI/CD, cloud technologies, monitoring, and automation. hashtag#DevOps (https://www.linkedin.com/search/results/all/?keywords=%23devops&origin=HASH_TAG_FROM_FEED) hashtag#Kubernetes (https://www.linkedin.com/search/results/all/?keywords=%23kubernetes&origin=HASH_TAG_FROM_FEED) hashtag#Prometheus (https://www.linkedin.com/search/results/all/?keywords=%23prometheus&origin=HASH_TAG_FROM_FEED) hashtag#Grafana (https://www.linkedin.com/search/results/all/?keywords=%23grafana&origin=HASH_TAG_FROM_FEED) hashtag#Helm (https://www.linkedin.com/search/results/all/?keywords=%23helm&origin=HASH_TAG_FROM_FEED) hashtag#Monitoring (https://www.linkedin.com/search/results/all/?keywords=%23monitoring&origin=HASH_TAG_FROM_FEED) hashtag#Minikube (https://www.linkedin.com/search/results/all/?keywords=%23minikube&origin=HASH_TAG_FROM_FEED) hashtag#CloudComputing (https://www.linkedin.com/search/results/all/?keywords=%23cloudcomputing&origin=HASH_TAG_FROM_FEED) hashtag#DevOpsJourney (https://www.linkedin.com/search/results/all/?keywords=%23devopsjourney&origin=HASH_TAG_FROM_FEED)
0
21
0
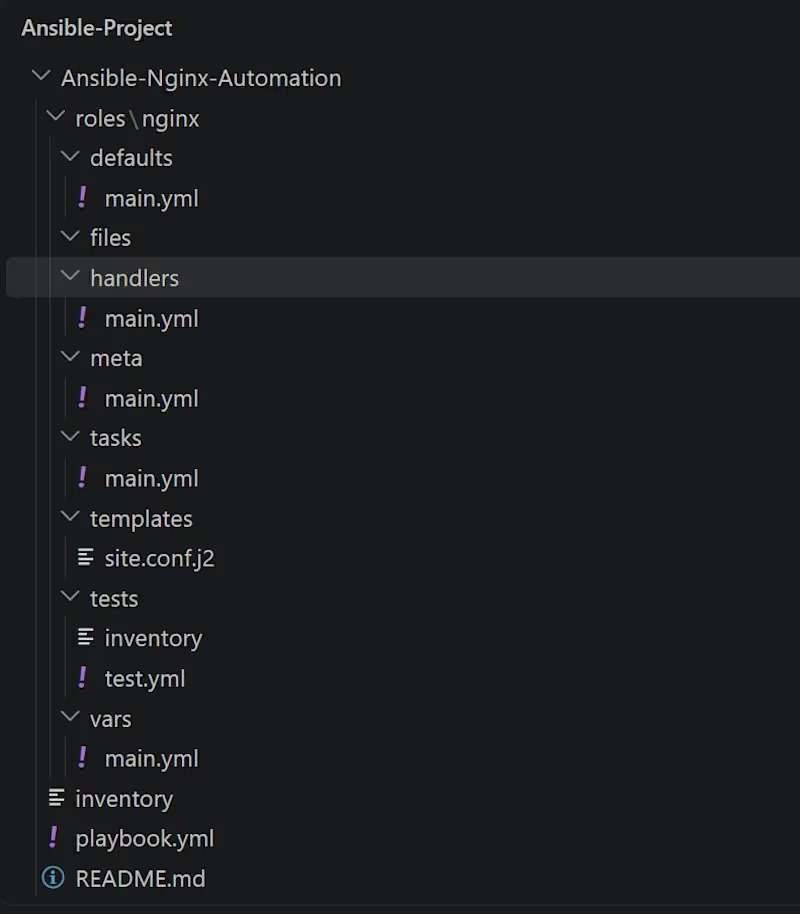
π Ansible Nginx Automation Project Built a hands-on DevOps project to automate Nginx deployment and configuration using Ansible. π§ Key concepts: β’ Ansible Roles & Playbooks β’ Jinja2 Templates β’ Handlers & Tasks β’ Nginx Configuration β’ Linux Server Automation β’ Infrastructure as Code (IaC) This project strengthened my practical understanding of server automation and configuration management.
0
29
0
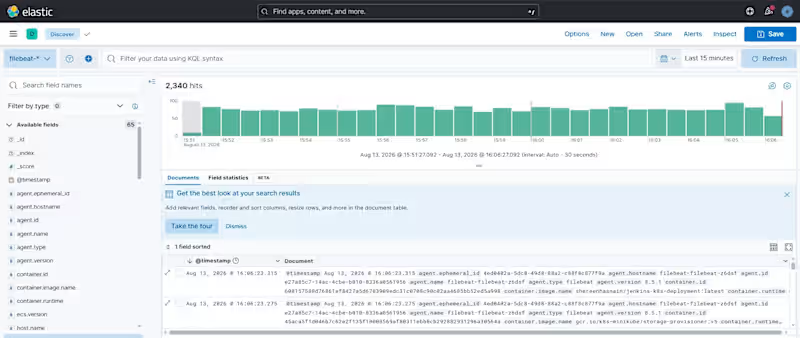
π Just completed a Kubernetes Logging project using the ELK Stack! Built and verified a centralized logging pipeline using: πΉ Kubernetes & Minikube πΉ Helm πΉ Filebeat πΉ Elasticsearch πΉ Kibana Kubernetes logs are now collected by Filebeat, stored in Elasticsearch, and visualized through Kibana Discover. This project strengthened my hands-on skills in Kubernetes logging, Helm deployments, troubleshooting, and observability.
0
36
0
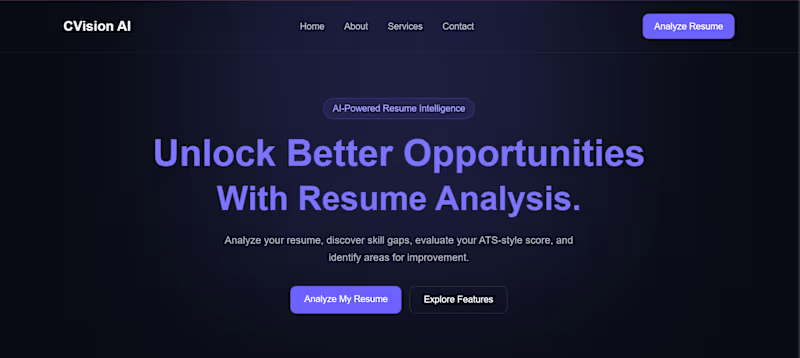
CVision AI | AI-Powered Resume Analyzer Built, containerized, and deployed an end-to-end AI Resume Analyzer. Analyzes resumes for ATS scoring, job matching, and skill gap suggestions. Tech Stack: Docker, Git/CI/CD, Render Cloud, Python/Flask, OpenRouter AI
0
21
Grafana
(1)
Follow
Message
Safoor Safdar
Lahore, Pakistan
Cloud Solution Architect & DevOps Engineer / SRE
Follow
Message
Cloud Solution Architect & DevOps Engineer / SRE

0
Advanced observability for Zand.ae (Logicera)
0
22
0
Enhancing AWS & Magento 2 Efficiency β Kent.ca
0
18
0
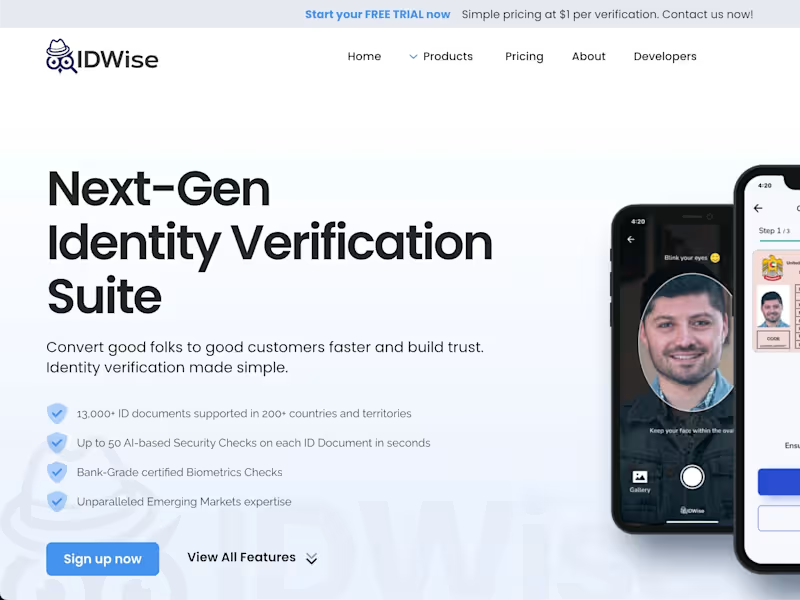
AI-Based Identity Verification - Trust but verify | IDWise
0
19
View more β
Grafana
(1)
Follow
Message
Explore people